Free Statistics
of Irreproducible Research!
Description of Statistical Computation | |||||||||||||||||||||||||||||||||||||||||||||||||||
|---|---|---|---|---|---|---|---|---|---|---|---|---|---|---|---|---|---|---|---|---|---|---|---|---|---|---|---|---|---|---|---|---|---|---|---|---|---|---|---|---|---|---|---|---|---|---|---|---|---|---|---|
| Author's title | |||||||||||||||||||||||||||||||||||||||||||||||||||
| Author | *Unverified author* | ||||||||||||||||||||||||||||||||||||||||||||||||||
| R Software Module | rwasp_pairs.wasp | ||||||||||||||||||||||||||||||||||||||||||||||||||
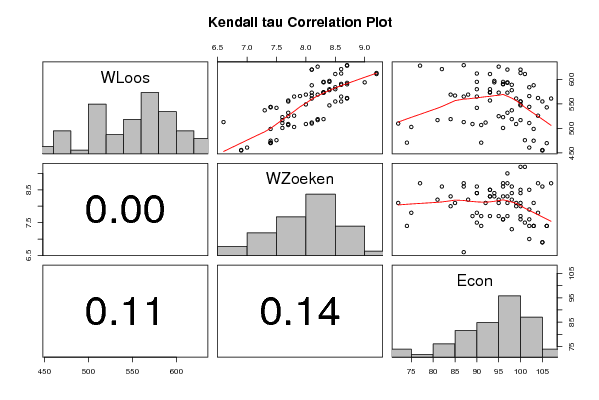
| Title produced by software | Kendall tau Correlation Matrix | ||||||||||||||||||||||||||||||||||||||||||||||||||
| Date of computation | Thu, 20 Dec 2007 09:13:51 -0700 | ||||||||||||||||||||||||||||||||||||||||||||||||||
| Cite this page as follows | Statistical Computations at FreeStatistics.org, Office for Research Development and Education, URL https://freestatistics.org/blog/index.php?v=date/2007/Dec/20/t1198166177cr6x50a4hlufpbf.htm/, Retrieved Mon, 29 Apr 2024 08:26:12 +0000 | ||||||||||||||||||||||||||||||||||||||||||||||||||
| Statistical Computations at FreeStatistics.org, Office for Research Development and Education, URL https://freestatistics.org/blog/index.php?pk=4748, Retrieved Mon, 29 Apr 2024 08:26:12 +0000 | |||||||||||||||||||||||||||||||||||||||||||||||||||
| QR Codes: | |||||||||||||||||||||||||||||||||||||||||||||||||||
|
| |||||||||||||||||||||||||||||||||||||||||||||||||||
| Original text written by user: | |||||||||||||||||||||||||||||||||||||||||||||||||||
| IsPrivate? | No (this computation is public) | ||||||||||||||||||||||||||||||||||||||||||||||||||
| User-defined keywords | |||||||||||||||||||||||||||||||||||||||||||||||||||
| Estimated Impact | 255 | ||||||||||||||||||||||||||||||||||||||||||||||||||
Tree of Dependent Computations | |||||||||||||||||||||||||||||||||||||||||||||||||||
| Family? (F = Feedback message, R = changed R code, M = changed R Module, P = changed Parameters, D = changed Data) | |||||||||||||||||||||||||||||||||||||||||||||||||||
| - [Pearson Correlation] [PAPER, TIM, GIEL,...] [2007-12-13 15:05:38] [beddef6ae4019f3e51da5e10d233ec85] - RM D [Kendall tau Correlation Matrix] [Paper Tim, Giel, Rik] [2007-12-20 16:13:51] [d41d8cd98f00b204e9800998ecf8427e] [Current] | |||||||||||||||||||||||||||||||||||||||||||||||||||
| Feedback Forum | |||||||||||||||||||||||||||||||||||||||||||||||||||
Post a new message | |||||||||||||||||||||||||||||||||||||||||||||||||||
Dataset | |||||||||||||||||||||||||||||||||||||||||||||||||||
| Dataseries X: | |||||||||||||||||||||||||||||||||||||||||||||||||||
513 6,6 87 503 7,8 75 471 7,4 74 471 7,4 91 476 7,5 101 475 7,4 103 470 7,4 106 461 7 102 455 6,9 105 456 6,9 105 517 7,6 100 525 7,7 95 523 7,6 96 519 8,2 98 509 8 99 512 8,1 92 519 8,3 84 517 8,2 81 510 8,1 72 509 7,7 89 501 7,6 96 507 7,7 91 569 8,2 88 580 8,4 90 578 8,4 98 565 8,6 87 547 8,4 100 555 8,5 100 562 8,7 104 561 8,7 107 555 8,6 105 544 7,4 102 537 7,3 98 543 7,4 106 594 9 97 611 9,2 101 613 9,2 100 611 8,5 93 594 8,3 94 595 8,3 96 591 8,6 96 589 8,6 98 584 8,5 102 573 8,1 95 567 8,1 85 569 8 84 621 8,6 82 629 8,7 87 628 8,7 77 612 8,6 90 595 8,4 90 597 8,4 94 593 8,7 97 590 8,7 96 580 8,5 93 574 8,3 93 573 8,3 93 573 8,3 97 620 8,1 100 626 8,2 95 620 8,1 97 588 8,1 103 566 7,9 102 557 7,7 93 561 8,1 99 549 8 100 532 7,7 97 526 7,8 104 511 7,6 102 499 7,4 103 555 7,7 100 565 7,8 90 542 7,5 90 | |||||||||||||||||||||||||||||||||||||||||||||||||||
Tables (Output of Computation) | |||||||||||||||||||||||||||||||||||||||||||||||||||
| |||||||||||||||||||||||||||||||||||||||||||||||||||
Figures (Output of Computation) | |||||||||||||||||||||||||||||||||||||||||||||||||||
Input Parameters & R Code | |||||||||||||||||||||||||||||||||||||||||||||||||||
| Parameters (Session): | |||||||||||||||||||||||||||||||||||||||||||||||||||
| Parameters (R input): | |||||||||||||||||||||||||||||||||||||||||||||||||||
| R code (references can be found in the software module): | |||||||||||||||||||||||||||||||||||||||||||||||||||
panel.tau <- function(x, y, digits=2, prefix='', cex.cor) | |||||||||||||||||||||||||||||||||||||||||||||||||||