Free Statistics

of Irreproducible Research!

Author's title

Author*Unverified author*
R Software Modulerwasp_arimabackwardselection.wasp
Title produced by softwareARIMA Backward Selection
Date of computationThu, 20 Dec 2007 08:29:33 -0700
Cite this page as followsStatistical Computations at FreeStatistics.org, Office for Research Development and Education, URL https://freestatistics.org/blog/index.php?v=date/2007/Dec/20/t1198163498f8xf98zv5kwe7kr.htm/, Retrieved Mon, 29 Apr 2024 15:59:30 +0000
Statistical Computations at FreeStatistics.org, Office for Research Development and Education, URL https://freestatistics.org/blog/index.php?pk=4736, Retrieved Mon, 29 Apr 2024 15:59:30 +0000
QR Codes:

Original text written by user:
IsPrivate?No (this computation is public)
User-defined keywords
Estimated Impact221
Family? (F = Feedback message, R = changed R code, M = changed R Module, P = changed Parameters, D = changed Data)
-       [ARIMA Backward Selection] [ARIMA bc totaal g...] [2007-12-20 15:29:33] [7c5f7a910a5108d789a748f71ee8daf4] [Current]
Feedback Forum

Post a new message
Dataseries X:
103,8
100,8
110,6
104,0
112,6
107,3
98,9
109,8
104,9
102,2
123,9
124,9
112,7
121,9
100,6
104,3
120,4
107,5
102,9
125,6
107,5
108,8
128,4
121,1
119,5
128,7
108,7
105,5
119,8
111,3
110,6
120,1
97,5
107,7
127,3
117,2
119,8
116,2
111,0
112,4
130,6
109,1
118,8
123,9
101,6
112,8
128,0
129,6
125,8
119,5
115,7
113,6
129,7
112,0
116,8
127,0
112,1
113,3
120,5
127,7


Summary of compuational transaction
Raw Inputview raw input (R code)
Raw Outputview raw output of R engine
Computing time4 seconds
R Server'Gwilym Jenkins' @ 72.249.127.135

\begin{tabular}{lllllllll}
\hline
Summary of compuational transaction \tabularnewline
Raw Input & view raw input (R code)  \tabularnewline
Raw Output & view raw output of R engine  \tabularnewline
Computing time & 4 seconds \tabularnewline
R Server & 'Gwilym Jenkins' @ 72.249.127.135 \tabularnewline
\hline
\end{tabular}
%Source: https://freestatistics.org/blog/index.php?pk=4736&T=0

[TABLE]
[ROW][C]Summary of compuational transaction[/C][/ROW]
[ROW][C]Raw Input[/C][C]view raw input (R code) [/C][/ROW]
[ROW][C]Raw Output[/C][C]view raw output of R engine [/C][/ROW]
[ROW][C]Computing time[/C][C]4 seconds[/C][/ROW]
[ROW][C]R Server[/C][C]'Gwilym Jenkins' @ 72.249.127.135[/C][/ROW]
[/TABLE]
Source: https://freestatistics.org/blog/index.php?pk=4736&T=0

Globally Unique Identifier (entire table): ba.freestatistics.org/blog/index.php?pk=4736&T=0

As an alternative you can also use a QR Code:  

The GUIDs for individual cells are displayed in the table below:

Summary of compuational transaction
Raw Inputview raw input (R code)
Raw Outputview raw output of R engine
Computing time4 seconds
R Server'Gwilym Jenkins' @ 72.249.127.135


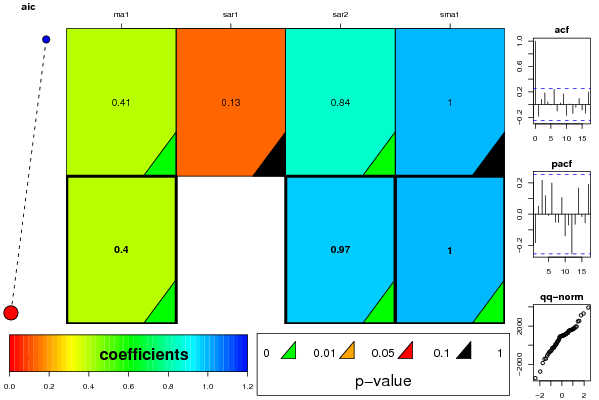
ARIMA Parameter Estimation and Backward Selection
Iterationma1sar1sar2sma1
Estimates ( 1 )0.40750.13060.8420.9998
(p-val)(0.0022 )(0.5743 )(7e-04 )(0.1025 )
Estimates ( 2 )0.396500.97311
(p-val)(0.0025 )(NA )(0 )(0 )
Estimates ( 3 )NANANANA
(p-val)(NA )(NA )(NA )(NA )
Estimates ( 4 )NANANANA
(p-val)(NA )(NA )(NA )(NA )
Estimates ( 5 )NANANANA
(p-val)(NA )(NA )(NA )(NA )
Estimates ( 6 )NANANANA
(p-val)(NA )(NA )(NA )(NA )
Estimates ( 7 )NANANANA
(p-val)(NA )(NA )(NA )(NA )

\begin{tabular}{lllllllll}
\hline
ARIMA Parameter Estimation and Backward Selection \tabularnewline
Iteration & ma1 & sar1 & sar2 & sma1 \tabularnewline
Estimates ( 1 ) & 0.4075 & 0.1306 & 0.842 & 0.9998 \tabularnewline
(p-val) & (0.0022 ) & (0.5743 ) & (7e-04 ) & (0.1025 ) \tabularnewline
Estimates ( 2 ) & 0.3965 & 0 & 0.9731 & 1 \tabularnewline
(p-val) & (0.0025 ) & (NA ) & (0 ) & (0 ) \tabularnewline
Estimates ( 3 ) & NA & NA & NA & NA \tabularnewline
(p-val) & (NA ) & (NA ) & (NA ) & (NA ) \tabularnewline
Estimates ( 4 ) & NA & NA & NA & NA \tabularnewline
(p-val) & (NA ) & (NA ) & (NA ) & (NA ) \tabularnewline
Estimates ( 5 ) & NA & NA & NA & NA \tabularnewline
(p-val) & (NA ) & (NA ) & (NA ) & (NA ) \tabularnewline
Estimates ( 6 ) & NA & NA & NA & NA \tabularnewline
(p-val) & (NA ) & (NA ) & (NA ) & (NA ) \tabularnewline
Estimates ( 7 ) & NA & NA & NA & NA \tabularnewline
(p-val) & (NA ) & (NA ) & (NA ) & (NA ) \tabularnewline
\hline
\end{tabular}
%Source: https://freestatistics.org/blog/index.php?pk=4736&T=1

[TABLE]
[ROW][C]ARIMA Parameter Estimation and Backward Selection[/C][/ROW]
[ROW][C]Iteration[/C][C]ma1[/C][C]sar1[/C][C]sar2[/C][C]sma1[/C][/ROW]
[ROW][C]Estimates ( 1 )[/C][C]0.4075[/C][C]0.1306[/C][C]0.842[/C][C]0.9998[/C][/ROW]
[ROW][C](p-val)[/C][C](0.0022 )[/C][C](0.5743 )[/C][C](7e-04 )[/C][C](0.1025 )[/C][/ROW]
[ROW][C]Estimates ( 2 )[/C][C]0.3965[/C][C]0[/C][C]0.9731[/C][C]1[/C][/ROW]
[ROW][C](p-val)[/C][C](0.0025 )[/C][C](NA )[/C][C](0 )[/C][C](0 )[/C][/ROW]
[ROW][C]Estimates ( 3 )[/C][C]NA[/C][C]NA[/C][C]NA[/C][C]NA[/C][/ROW]
[ROW][C](p-val)[/C][C](NA )[/C][C](NA )[/C][C](NA )[/C][C](NA )[/C][/ROW]
[ROW][C]Estimates ( 4 )[/C][C]NA[/C][C]NA[/C][C]NA[/C][C]NA[/C][/ROW]
[ROW][C](p-val)[/C][C](NA )[/C][C](NA )[/C][C](NA )[/C][C](NA )[/C][/ROW]
[ROW][C]Estimates ( 5 )[/C][C]NA[/C][C]NA[/C][C]NA[/C][C]NA[/C][/ROW]
[ROW][C](p-val)[/C][C](NA )[/C][C](NA )[/C][C](NA )[/C][C](NA )[/C][/ROW]
[ROW][C]Estimates ( 6 )[/C][C]NA[/C][C]NA[/C][C]NA[/C][C]NA[/C][/ROW]
[ROW][C](p-val)[/C][C](NA )[/C][C](NA )[/C][C](NA )[/C][C](NA )[/C][/ROW]
[ROW][C]Estimates ( 7 )[/C][C]NA[/C][C]NA[/C][C]NA[/C][C]NA[/C][/ROW]
[ROW][C](p-val)[/C][C](NA )[/C][C](NA )[/C][C](NA )[/C][C](NA )[/C][/ROW]
[/TABLE]
Source: https://freestatistics.org/blog/index.php?pk=4736&T=1

Globally Unique Identifier (entire table): ba.freestatistics.org/blog/index.php?pk=4736&T=1

As an alternative you can also use a QR Code:  

The GUIDs for individual cells are displayed in the table below:

ARIMA Parameter Estimation and Backward Selection
Iterationma1sar1sar2sma1
Estimates ( 1 )0.40750.13060.8420.9998
(p-val)(0.0022 )(0.5743 )(7e-04 )(0.1025 )
Estimates ( 2 )0.396500.97311
(p-val)(0.0025 )(NA )(0 )(0 )
Estimates ( 3 )NANANANA
(p-val)(NA )(NA )(NA )(NA )
Estimates ( 4 )NANANANA
(p-val)(NA )(NA )(NA )(NA )
Estimates ( 5 )NANANANA
(p-val)(NA )(NA )(NA )(NA )
Estimates ( 6 )NANANANA
(p-val)(NA )(NA )(NA )(NA )
Estimates ( 7 )NANANANA
(p-val)(NA )(NA )(NA )(NA )


Estimated ARIMA Residuals
Value
1587.35868308939
1005.60167623220
1538.06420404763
1094.79516799656
1570.98015993861
1191.48493972855
1070.55426978693
1481.73192097534
1146.80967090567
1194.33312397666
1955.51711942527
1268.72698138754
1768.25544330390
3946.01046512666
-3455.59447689106
1608.32987279842
1262.80045827554
-320.862504089506
1037.56366487935
3318.72474314227
-674.941446655684
1754.42480731815
581.614218563289
-919.768859759633
1943.53470240451
735.579463724176
1629.49163427579
-270.494417355365
49.8373590519009
943.985148799792
1296.82466653276
-1869.81394127636
-1091.90710585421
285.734042327594
-233.095015459593
-541.610639071217
488.775570223078
-2759.86322224311
1506.66782823725
974.649688573155
2540.87066921619
-1398.7968251499
2484.35886541710
420.753297996888
933.135181679337
971.313399420422
87.8899041900164
3127.38602308454
345.676897901739
876.884613326442
1058.34100447531
-94.7803110852587
-283.112566922446
999.461693383476
-748.732983082293
880.636537356546
1722.25117375377
-603.283667899341
-1433.09044739980
86.6467919470443

\begin{tabular}{lllllllll}
\hline
Estimated ARIMA Residuals \tabularnewline
Value \tabularnewline
 \tabularnewline
1587.35868308939 \tabularnewline
1005.60167623220 \tabularnewline
1538.06420404763 \tabularnewline
1094.79516799656 \tabularnewline
1570.98015993861 \tabularnewline
1191.48493972855 \tabularnewline
1070.55426978693 \tabularnewline
1481.73192097534 \tabularnewline
1146.80967090567 \tabularnewline
1194.33312397666 \tabularnewline
1955.51711942527 \tabularnewline
1268.72698138754 \tabularnewline
1768.25544330390 \tabularnewline
3946.01046512666 \tabularnewline
-3455.59447689106 \tabularnewline
1608.32987279842 \tabularnewline
1262.80045827554 \tabularnewline
-320.862504089506 \tabularnewline
1037.56366487935 \tabularnewline
3318.72474314227 \tabularnewline
-674.941446655684 \tabularnewline
1754.42480731815 \tabularnewline
581.614218563289 \tabularnewline
-919.768859759633 \tabularnewline
1943.53470240451 \tabularnewline
735.579463724176 \tabularnewline
1629.49163427579 \tabularnewline
-270.494417355365 \tabularnewline
49.8373590519009 \tabularnewline
943.985148799792 \tabularnewline
1296.82466653276 \tabularnewline
-1869.81394127636 \tabularnewline
-1091.90710585421 \tabularnewline
285.734042327594 \tabularnewline
-233.095015459593 \tabularnewline
-541.610639071217 \tabularnewline
488.775570223078 \tabularnewline
-2759.86322224311 \tabularnewline
1506.66782823725 \tabularnewline
974.649688573155 \tabularnewline
2540.87066921619 \tabularnewline
-1398.7968251499 \tabularnewline
2484.35886541710 \tabularnewline
420.753297996888 \tabularnewline
933.135181679337 \tabularnewline
971.313399420422 \tabularnewline
87.8899041900164 \tabularnewline
3127.38602308454 \tabularnewline
345.676897901739 \tabularnewline
876.884613326442 \tabularnewline
1058.34100447531 \tabularnewline
-94.7803110852587 \tabularnewline
-283.112566922446 \tabularnewline
999.461693383476 \tabularnewline
-748.732983082293 \tabularnewline
880.636537356546 \tabularnewline
1722.25117375377 \tabularnewline
-603.283667899341 \tabularnewline
-1433.09044739980 \tabularnewline
86.6467919470443 \tabularnewline
\hline
\end{tabular}
%Source: https://freestatistics.org/blog/index.php?pk=4736&T=2

[TABLE]
[ROW][C]Estimated ARIMA Residuals[/C][/ROW]
[ROW][C]Value[/C][/ROW]
[ROW][C][/C][/ROW]
[ROW][C]1587.35868308939[/C][/ROW]
[ROW][C]1005.60167623220[/C][/ROW]
[ROW][C]1538.06420404763[/C][/ROW]
[ROW][C]1094.79516799656[/C][/ROW]
[ROW][C]1570.98015993861[/C][/ROW]
[ROW][C]1191.48493972855[/C][/ROW]
[ROW][C]1070.55426978693[/C][/ROW]
[ROW][C]1481.73192097534[/C][/ROW]
[ROW][C]1146.80967090567[/C][/ROW]
[ROW][C]1194.33312397666[/C][/ROW]
[ROW][C]1955.51711942527[/C][/ROW]
[ROW][C]1268.72698138754[/C][/ROW]
[ROW][C]1768.25544330390[/C][/ROW]
[ROW][C]3946.01046512666[/C][/ROW]
[ROW][C]-3455.59447689106[/C][/ROW]
[ROW][C]1608.32987279842[/C][/ROW]
[ROW][C]1262.80045827554[/C][/ROW]
[ROW][C]-320.862504089506[/C][/ROW]
[ROW][C]1037.56366487935[/C][/ROW]
[ROW][C]3318.72474314227[/C][/ROW]
[ROW][C]-674.941446655684[/C][/ROW]
[ROW][C]1754.42480731815[/C][/ROW]
[ROW][C]581.614218563289[/C][/ROW]
[ROW][C]-919.768859759633[/C][/ROW]
[ROW][C]1943.53470240451[/C][/ROW]
[ROW][C]735.579463724176[/C][/ROW]
[ROW][C]1629.49163427579[/C][/ROW]
[ROW][C]-270.494417355365[/C][/ROW]
[ROW][C]49.8373590519009[/C][/ROW]
[ROW][C]943.985148799792[/C][/ROW]
[ROW][C]1296.82466653276[/C][/ROW]
[ROW][C]-1869.81394127636[/C][/ROW]
[ROW][C]-1091.90710585421[/C][/ROW]
[ROW][C]285.734042327594[/C][/ROW]
[ROW][C]-233.095015459593[/C][/ROW]
[ROW][C]-541.610639071217[/C][/ROW]
[ROW][C]488.775570223078[/C][/ROW]
[ROW][C]-2759.86322224311[/C][/ROW]
[ROW][C]1506.66782823725[/C][/ROW]
[ROW][C]974.649688573155[/C][/ROW]
[ROW][C]2540.87066921619[/C][/ROW]
[ROW][C]-1398.7968251499[/C][/ROW]
[ROW][C]2484.35886541710[/C][/ROW]
[ROW][C]420.753297996888[/C][/ROW]
[ROW][C]933.135181679337[/C][/ROW]
[ROW][C]971.313399420422[/C][/ROW]
[ROW][C]87.8899041900164[/C][/ROW]
[ROW][C]3127.38602308454[/C][/ROW]
[ROW][C]345.676897901739[/C][/ROW]
[ROW][C]876.884613326442[/C][/ROW]
[ROW][C]1058.34100447531[/C][/ROW]
[ROW][C]-94.7803110852587[/C][/ROW]
[ROW][C]-283.112566922446[/C][/ROW]
[ROW][C]999.461693383476[/C][/ROW]
[ROW][C]-748.732983082293[/C][/ROW]
[ROW][C]880.636537356546[/C][/ROW]
[ROW][C]1722.25117375377[/C][/ROW]
[ROW][C]-603.283667899341[/C][/ROW]
[ROW][C]-1433.09044739980[/C][/ROW]
[ROW][C]86.6467919470443[/C][/ROW]
[/TABLE]
Source: https://freestatistics.org/blog/index.php?pk=4736&T=2

Globally Unique Identifier (entire table): ba.freestatistics.org/blog/index.php?pk=4736&T=2

As an alternative you can also use a QR Code:  

The GUIDs for individual cells are displayed in the table below:

Estimated ARIMA Residuals
Value
1587.35868308939
1005.60167623220
1538.06420404763
1094.79516799656
1570.98015993861
1191.48493972855
1070.55426978693
1481.73192097534
1146.80967090567
1194.33312397666
1955.51711942527
1268.72698138754
1768.25544330390
3946.01046512666
-3455.59447689106
1608.32987279842
1262.80045827554
-320.862504089506
1037.56366487935
3318.72474314227
-674.941446655684
1754.42480731815
581.614218563289
-919.768859759633
1943.53470240451
735.579463724176
1629.49163427579
-270.494417355365
49.8373590519009
943.985148799792
1296.82466653276
-1869.81394127636
-1091.90710585421
285.734042327594
-233.095015459593
-541.610639071217
488.775570223078
-2759.86322224311
1506.66782823725
974.649688573155
2540.87066921619
-1398.7968251499
2484.35886541710
420.753297996888
933.135181679337
971.313399420422
87.8899041900164
3127.38602308454
345.676897901739
876.884613326442
1058.34100447531
-94.7803110852587
-283.112566922446
999.461693383476
-748.732983082293
880.636537356546
1722.25117375377
-603.283667899341
-1433.09044739980
86.6467919470443


Parameters (Session):
par1 = FALSE ; par2 = 2.0 ; par3 = 0 ; par4 = 0 ; par5 = 12 ; par6 = 0 ; par7 = 1 ; par8 = 2 ; par9 = 1 ;
Parameters (R input):
par1 = FALSE ; par2 = 2.0 ; par3 = 0 ; par4 = 0 ; par5 = 12 ; par6 = 0 ; par7 = 1 ; par8 = 2 ; par9 = 1 ;
R code (references can be found in the software module):
library(lattice)
if (par1 == 'TRUE') par1 <- TRUE
if (par1 == 'FALSE') par1 <- FALSE
par2 <- as.numeric(par2) #Box-Cox lambda transformation parameter
par3 <- as.numeric(par3) #degree of non-seasonal differencing
par4 <- as.numeric(par4) #degree of seasonal differencing
par5 <- as.numeric(par5) #seasonal period
par6 <- as.numeric(par6) #degree (p) of the non-seasonal AR(p) polynomial
par7 <- as.numeric(par7) #degree (q) of the non-seasonal MA(q) polynomial
par8 <- as.numeric(par8) #degree (P) of the seasonal AR(P) polynomial
par9 <- as.numeric(par9) #degree (Q) of the seasonal MA(Q) polynomial
armaGR <- function(arima.out, names, n){
try1 <- arima.out$coef
try2 <- sqrt(diag(arima.out$var.coef))
try.data.frame <- data.frame(matrix(NA,ncol=4,nrow=length(names)))
dimnames(try.data.frame) <- list(names,c('coef','std','tstat','pv'))
try.data.frame[,1] <- try1
for(i in 1:length(try2)) try.data.frame[which(rownames(try.data.frame)==names(try2)[i]),2] <- try2[i]
try.data.frame[,3] <- try.data.frame[,1] / try.data.frame[,2]
try.data.frame[,4] <- round((1-pt(abs(try.data.frame[,3]),df=n-(length(try2)+1)))*2,5)
vector <- rep(NA,length(names))
vector[is.na(try.data.frame[,4])] <- 0
maxi <- which.max(try.data.frame[,4])
continue <- max(try.data.frame[,4],na.rm=TRUE) > .05
vector[maxi] <- 0
list(summary=try.data.frame,next.vector=vector,continue=continue)
}
arimaSelect <- function(series, order=c(13,0,0), seasonal=list(order=c(2,0,0),period=12), include.mean=F){
nrc <- order[1]+order[3]+seasonal$order[1]+seasonal$order[3]
coeff <- matrix(NA, nrow=nrc*2, ncol=nrc)
pval <- matrix(NA, nrow=nrc*2, ncol=nrc)
mylist <- rep(list(NULL), nrc)
names <- NULL
if(order[1] > 0) names <- paste('ar',1:order[1],sep='')
if(order[3] > 0) names <- c( names , paste('ma',1:order[3],sep='') )
if(seasonal$order[1] > 0) names <- c(names, paste('sar',1:seasonal$order[1],sep=''))
if(seasonal$order[3] > 0) names <- c(names, paste('sma',1:seasonal$order[3],sep=''))
arima.out <- arima(series, order=order, seasonal=seasonal, include.mean=include.mean, method='ML')
mylist[[1]] <- arima.out
last.arma <- armaGR(arima.out, names, length(series))
mystop <- FALSE
i <- 1
coeff[i,] <- last.arma[[1]][,1]
pval [i,] <- last.arma[[1]][,4]
i <- 2
aic <- arima.out$aic
while(!mystop){
mylist[[i]] <- arima.out
arima.out <- arima(series, order=order, seasonal=seasonal, include.mean=include.mean, method='ML', fixed=last.arma$next.vector)
aic <- c(aic, arima.out$aic)
last.arma <- armaGR(arima.out, names, length(series))
mystop <- !last.arma$continue
coeff[i,] <- last.arma[[1]][,1]
pval [i,] <- last.arma[[1]][,4]
i <- i+1
}
list(coeff, pval, mylist, aic=aic)
}
arimaSelectplot <- function(arimaSelect.out,noms,choix){
noms <- names(arimaSelect.out[[3]][[1]]$coef)
coeff <- arimaSelect.out[[1]]
k <- min(which(is.na(coeff[,1])))-1
coeff <- coeff[1:k,]
pval <- arimaSelect.out[[2]][1:k,]
aic <- arimaSelect.out$aic[1:k]
coeff[coeff==0] <- NA
n <- ncol(coeff)
if(missing(choix)) choix <- k
layout(matrix(c(1,1,1,2,
3,3,3,2,
3,3,3,4,
5,6,7,7),nr=4),
widths=c(10,35,45,15),
heights=c(30,30,15,15))
couleurs <- rainbow(75)[1:50]#(50)
ticks <- pretty(coeff)
par(mar=c(1,1,3,1))
plot(aic,k:1-.5,type='o',pch=21,bg='blue',cex=2,axes=F,lty=2,xpd=NA)
points(aic[choix],k-choix+.5,pch=21,cex=4,bg=2,xpd=NA)
title('aic',line=2)
par(mar=c(3,0,0,0))
plot(0,axes=F,xlab='',ylab='',xlim=range(ticks),ylim=c(.1,1))
rect(xleft = min(ticks) + (0:49)/50*(max(ticks)-min(ticks)),
xright = min(ticks) + (1:50)/50*(max(ticks)-min(ticks)),
ytop = rep(1,50),
ybottom= rep(0,50),col=couleurs,border=NA)
axis(1,ticks)
rect(xleft=min(ticks),xright=max(ticks),ytop=1,ybottom=0)
text(mean(coeff,na.rm=T),.5,'coefficients',cex=2,font=2)
par(mar=c(1,1,3,1))
image(1:n,1:k,t(coeff[k:1,]),axes=F,col=couleurs,zlim=range(ticks))
for(i in 1:n) for(j in 1:k) if(!is.na(coeff[j,i])) {
if(pval[j,i]<.01) symb = 'green'
else if( (pval[j,i]<.05) & (pval[j,i]>=.01)) symb = 'orange'
else if( (pval[j,i]<.1) & (pval[j,i]>=.05)) symb = 'red'
else symb = 'black'
polygon(c(i+.5 ,i+.2 ,i+.5 ,i+.5),
c(k-j+0.5,k-j+0.5,k-j+0.8,k-j+0.5),
col=symb)
if(j==choix) {
rect(xleft=i-.5,
xright=i+.5,
ybottom=k-j+1.5,
ytop=k-j+.5,
lwd=4)
text(i,
k-j+1,
round(coeff[j,i],2),
cex=1.2,
font=2)
}
else{
rect(xleft=i-.5,xright=i+.5,ybottom=k-j+1.5,ytop=k-j+.5)
text(i,k-j+1,round(coeff[j,i],2),cex=1.2,font=1)
}
}
axis(3,1:n,noms)
par(mar=c(0.5,0,0,0.5))
plot(0,axes=F,xlab='',ylab='',type='n',xlim=c(0,8),ylim=c(-.2,.8))
cols <- c('green','orange','red','black')
niv <- c('0','0.01','0.05','0.1')
for(i in 0:3){
polygon(c(1+2*i ,1+2*i ,1+2*i-.5 ,1+2*i),
c(.4 ,.7 , .4 , .4),
col=cols[i+1])
text(2*i,0.5,niv[i+1],cex=1.5)
}
text(8,.5,1,cex=1.5)
text(4,0,'p-value',cex=2)
box()
residus <- arimaSelect.out[[3]][[choix]]$res
par(mar=c(1,2,4,1))
acf(residus,main='')
title('acf',line=.5)
par(mar=c(1,2,4,1))
pacf(residus,main='')
title('pacf',line=.5)
par(mar=c(2,2,4,1))
qqnorm(residus,main='')
title('qq-norm',line=.5)
residus
}
if (par2 == 0) x <- log(x)
if (par2 != 0) x <- x^par2
(selection <- arimaSelect(x, order=c(par6,par3,par7), seasonal=list(order=c(par8,par4,par9), period=par5)))
bitmap(file='test1.png')
resid <- arimaSelectplot(selection)
dev.off()
resid
bitmap(file='test2.png')
acf(resid,length(resid)/2, main='Residual Autocorrelation Function')
dev.off()
bitmap(file='test3.png')
pacf(resid,length(resid)/2, main='Residual Partial Autocorrelation Function')
dev.off()
bitmap(file='test4.png')
cpgram(resid, main='Residual Cumulative Periodogram')
dev.off()
bitmap(file='test5.png')
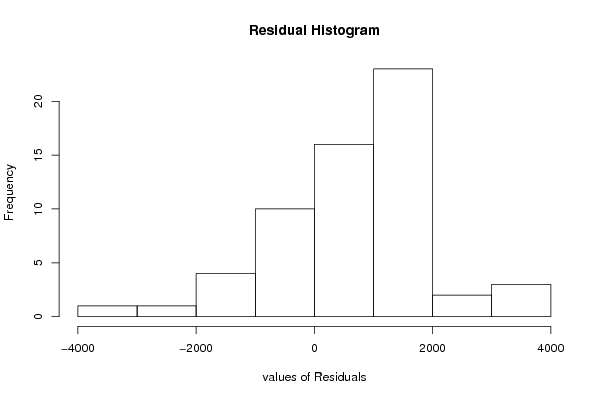
hist(resid, main='Residual Histogram', xlab='values of Residuals')
dev.off()
bitmap(file='test6.png')
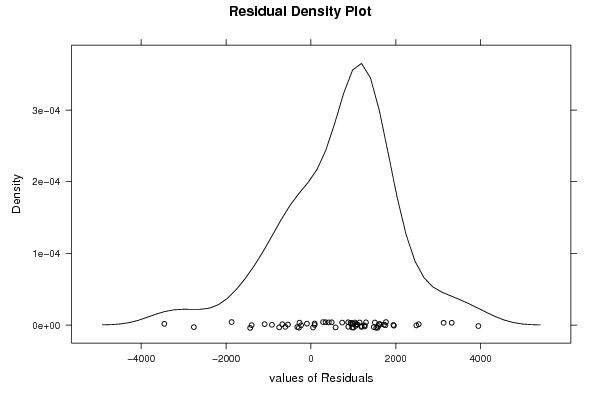
densityplot(~resid,col='black',main='Residual Density Plot', xlab='values of Residuals')
dev.off()
bitmap(file='test7.png')
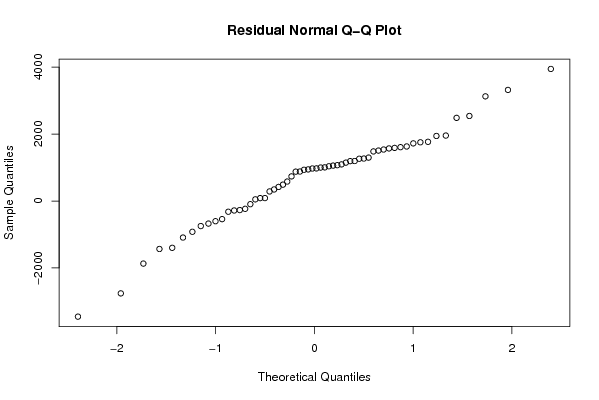
qqnorm(resid, main='Residual Normal Q-Q Plot')
dev.off()
ncols <- length(selection[[1]][1,])
nrows <- length(selection[[2]][,1])-1
load(file='createtable')
a<-table.start()
a<-table.row.start(a)
a<-table.element(a,'ARIMA Parameter Estimation and Backward Selection', ncols+1,TRUE)
a<-table.row.end(a)
a<-table.row.start(a)
a<-table.element(a,'Iteration', header=TRUE)
for (i in 1:ncols) {
a<-table.element(a,names(selection[[3]][[1]]$coef)[i],header=TRUE)
}
a<-table.row.end(a)
for (j in 1:nrows) {
a<-table.row.start(a)
mydum <- 'Estimates ('
mydum <- paste(mydum,j)
mydum <- paste(mydum,')')
a<-table.element(a,mydum, header=TRUE)
for (i in 1:ncols) {
a<-table.element(a,round(selection[[1]][j,i],4))
}
a<-table.row.end(a)
a<-table.row.start(a)
a<-table.element(a,'(p-val)', header=TRUE)
for (i in 1:ncols) {
mydum <- '('
mydum <- paste(mydum,round(selection[[2]][j,i],4),sep='')
mydum <- paste(mydum,')')
a<-table.element(a,mydum)
}
a<-table.row.end(a)
}
a<-table.end(a)
table.save(a,file='mytable.tab')
a<-table.start()
a<-table.row.start(a)
a<-table.element(a,'Estimated ARIMA Residuals', 1,TRUE)
a<-table.row.end(a)
a<-table.row.start(a)
a<-table.element(a,'Value', 1,TRUE)
a<-table.row.end(a)
for (i in (par4*par5+par3):length(resid)) {
a<-table.row.start(a)
a<-table.element(a,resid[i])
a<-table.row.end(a)
}
a<-table.end(a)
table.save(a,file='mytable1.tab')