Free Statistics

of Irreproducible Research!

Author's title

Author*Unverified author*
R Software Modulerwasp_autocorrelation.wasp
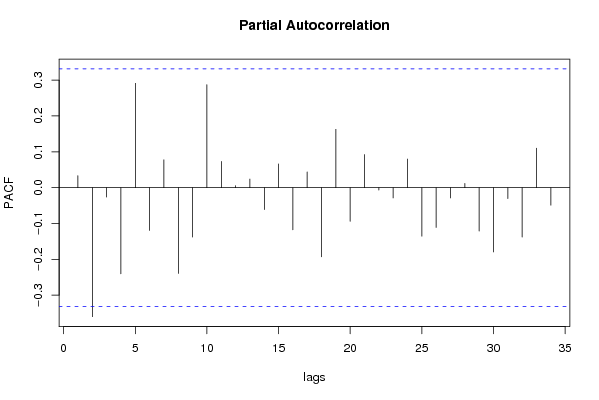
Title produced by software(Partial) Autocorrelation Function
Date of computationThu, 20 Dec 2007 08:06:29 -0700
Cite this page as followsStatistical Computations at FreeStatistics.org, Office for Research Development and Education, URL https://freestatistics.org/blog/index.php?v=date/2007/Dec/20/t1198162171d1u5x9ihbzbwkv1.htm/, Retrieved Mon, 29 Apr 2024 10:27:40 +0000
Statistical Computations at FreeStatistics.org, Office for Research Development and Education, URL https://freestatistics.org/blog/index.php?pk=4727, Retrieved Mon, 29 Apr 2024 10:27:40 +0000
QR Codes:

Original text written by user:
IsPrivate?No (this computation is public)
User-defined keywords
Estimated Impact218
Family? (F = Feedback message, R = changed R code, M = changed R Module, P = changed Parameters, D = changed Data)
-       [(Partial) Autocorrelation Function] [PACF 3] [2007-12-20 15:06:29] [d41d8cd98f00b204e9800998ecf8427e] [Current]
Feedback Forum

Post a new message
Dataseries X:
106.8
114.3
105.7
90.1
91.6
97.7
100.8
104.6
95.9
102.7
104
107.9
113.8
113.8
123.1
125.1
137.6
134
140.3
152.1
150.6
167.3
153.2
142
154.4
158.5
180.9
181.3
172.4
192
199.3
215.4
214.3
201.5
190.5
196
215.7
209.4
214.1
237.8
239
237.8
251.5
248.8
215.4
201.2
203.1
214.2


Summary of compuational transaction
Raw Inputview raw input (R code)
Raw Outputview raw output of R engine
Computing time3 seconds
R Server'Herman Ole Andreas Wold' @ 193.190.124.10:1001

\begin{tabular}{lllllllll}
\hline
Summary of compuational transaction \tabularnewline
Raw Input & view raw input (R code)  \tabularnewline
Raw Output & view raw output of R engine  \tabularnewline
Computing time & 3 seconds \tabularnewline
R Server & 'Herman Ole Andreas Wold' @ 193.190.124.10:1001 \tabularnewline
\hline
\end{tabular}
%Source: https://freestatistics.org/blog/index.php?pk=4727&T=0

[TABLE]
[ROW][C]Summary of compuational transaction[/C][/ROW]
[ROW][C]Raw Input[/C][C]view raw input (R code) [/C][/ROW]
[ROW][C]Raw Output[/C][C]view raw output of R engine [/C][/ROW]
[ROW][C]Computing time[/C][C]3 seconds[/C][/ROW]
[ROW][C]R Server[/C][C]'Herman Ole Andreas Wold' @ 193.190.124.10:1001[/C][/ROW]
[/TABLE]
Source: https://freestatistics.org/blog/index.php?pk=4727&T=0

Globally Unique Identifier (entire table): ba.freestatistics.org/blog/index.php?pk=4727&T=0

As an alternative you can also use a QR Code:  

The GUIDs for individual cells are displayed in the table below:

Summary of compuational transaction
Raw Inputview raw input (R code)
Raw Outputview raw output of R engine
Computing time3 seconds
R Server'Herman Ole Andreas Wold' @ 193.190.124.10:1001


Autocorrelation Function
Time lag kACF(k)T-STATP-value
015.91610
10.0333730.19740.422314
2-0.358607-2.12150.979485
3-0.051115-0.30240.617932
4-0.082898-0.49040.686555
50.2568241.51940.068823
60.0659440.39010.349402
7-0.16196-0.95820.827725
8-0.13584-0.80360.786486
9-0.183234-1.0840.857118
100.3586032.12150.020516
110.2686651.58940.060477
12-0.239042-1.41420.91693
13-0.07907-0.46780.67858
14-0.085625-0.50660.692182
150.1117110.66090.256504
160.1396370.82610.207171
17-0.125049-0.73980.767822
18-0.149523-0.88460.808793
19-0.063096-0.37330.644404
200.1222610.72330.237149
210.1969611.16520.125902
22-0.035033-0.20730.581495
23-0.139113-0.8230.791961
24-0.02355-0.13930.555005
250.0205320.12150.452008
26-0.012002-0.0710.528101
27-0.012815-0.07580.53
28-0.043525-0.25750.600849
29-0.149841-0.88650.809293
30-0.051806-0.30650.619476
310.0694010.41060.341942
320.0453530.26830.395018
33-0.000773-0.00460.501811
34-0.005747-0.0340.513464
35NANANA

\begin{tabular}{lllllllll}
\hline
Autocorrelation Function \tabularnewline
Time lag k & ACF(k) & T-STAT & P-value \tabularnewline
0 & 1 & 5.9161 & 0 \tabularnewline
1 & 0.033373 & 0.1974 & 0.422314 \tabularnewline
2 & -0.358607 & -2.1215 & 0.979485 \tabularnewline
3 & -0.051115 & -0.3024 & 0.617932 \tabularnewline
4 & -0.082898 & -0.4904 & 0.686555 \tabularnewline
5 & 0.256824 & 1.5194 & 0.068823 \tabularnewline
6 & 0.065944 & 0.3901 & 0.349402 \tabularnewline
7 & -0.16196 & -0.9582 & 0.827725 \tabularnewline
8 & -0.13584 & -0.8036 & 0.786486 \tabularnewline
9 & -0.183234 & -1.084 & 0.857118 \tabularnewline
10 & 0.358603 & 2.1215 & 0.020516 \tabularnewline
11 & 0.268665 & 1.5894 & 0.060477 \tabularnewline
12 & -0.239042 & -1.4142 & 0.91693 \tabularnewline
13 & -0.07907 & -0.4678 & 0.67858 \tabularnewline
14 & -0.085625 & -0.5066 & 0.692182 \tabularnewline
15 & 0.111711 & 0.6609 & 0.256504 \tabularnewline
16 & 0.139637 & 0.8261 & 0.207171 \tabularnewline
17 & -0.125049 & -0.7398 & 0.767822 \tabularnewline
18 & -0.149523 & -0.8846 & 0.808793 \tabularnewline
19 & -0.063096 & -0.3733 & 0.644404 \tabularnewline
20 & 0.122261 & 0.7233 & 0.237149 \tabularnewline
21 & 0.196961 & 1.1652 & 0.125902 \tabularnewline
22 & -0.035033 & -0.2073 & 0.581495 \tabularnewline
23 & -0.139113 & -0.823 & 0.791961 \tabularnewline
24 & -0.02355 & -0.1393 & 0.555005 \tabularnewline
25 & 0.020532 & 0.1215 & 0.452008 \tabularnewline
26 & -0.012002 & -0.071 & 0.528101 \tabularnewline
27 & -0.012815 & -0.0758 & 0.53 \tabularnewline
28 & -0.043525 & -0.2575 & 0.600849 \tabularnewline
29 & -0.149841 & -0.8865 & 0.809293 \tabularnewline
30 & -0.051806 & -0.3065 & 0.619476 \tabularnewline
31 & 0.069401 & 0.4106 & 0.341942 \tabularnewline
32 & 0.045353 & 0.2683 & 0.395018 \tabularnewline
33 & -0.000773 & -0.0046 & 0.501811 \tabularnewline
34 & -0.005747 & -0.034 & 0.513464 \tabularnewline
35 & NA & NA & NA \tabularnewline
\hline
\end{tabular}
%Source: https://freestatistics.org/blog/index.php?pk=4727&T=1

[TABLE]
[ROW][C]Autocorrelation Function[/C][/ROW]
[ROW][C]Time lag k[/C][C]ACF(k)[/C][C]T-STAT[/C][C]P-value[/C][/ROW]
[ROW][C]0[/C][C]1[/C][C]5.9161[/C][C]0[/C][/ROW]
[ROW][C]1[/C][C]0.033373[/C][C]0.1974[/C][C]0.422314[/C][/ROW]
[ROW][C]2[/C][C]-0.358607[/C][C]-2.1215[/C][C]0.979485[/C][/ROW]
[ROW][C]3[/C][C]-0.051115[/C][C]-0.3024[/C][C]0.617932[/C][/ROW]
[ROW][C]4[/C][C]-0.082898[/C][C]-0.4904[/C][C]0.686555[/C][/ROW]
[ROW][C]5[/C][C]0.256824[/C][C]1.5194[/C][C]0.068823[/C][/ROW]
[ROW][C]6[/C][C]0.065944[/C][C]0.3901[/C][C]0.349402[/C][/ROW]
[ROW][C]7[/C][C]-0.16196[/C][C]-0.9582[/C][C]0.827725[/C][/ROW]
[ROW][C]8[/C][C]-0.13584[/C][C]-0.8036[/C][C]0.786486[/C][/ROW]
[ROW][C]9[/C][C]-0.183234[/C][C]-1.084[/C][C]0.857118[/C][/ROW]
[ROW][C]10[/C][C]0.358603[/C][C]2.1215[/C][C]0.020516[/C][/ROW]
[ROW][C]11[/C][C]0.268665[/C][C]1.5894[/C][C]0.060477[/C][/ROW]
[ROW][C]12[/C][C]-0.239042[/C][C]-1.4142[/C][C]0.91693[/C][/ROW]
[ROW][C]13[/C][C]-0.07907[/C][C]-0.4678[/C][C]0.67858[/C][/ROW]
[ROW][C]14[/C][C]-0.085625[/C][C]-0.5066[/C][C]0.692182[/C][/ROW]
[ROW][C]15[/C][C]0.111711[/C][C]0.6609[/C][C]0.256504[/C][/ROW]
[ROW][C]16[/C][C]0.139637[/C][C]0.8261[/C][C]0.207171[/C][/ROW]
[ROW][C]17[/C][C]-0.125049[/C][C]-0.7398[/C][C]0.767822[/C][/ROW]
[ROW][C]18[/C][C]-0.149523[/C][C]-0.8846[/C][C]0.808793[/C][/ROW]
[ROW][C]19[/C][C]-0.063096[/C][C]-0.3733[/C][C]0.644404[/C][/ROW]
[ROW][C]20[/C][C]0.122261[/C][C]0.7233[/C][C]0.237149[/C][/ROW]
[ROW][C]21[/C][C]0.196961[/C][C]1.1652[/C][C]0.125902[/C][/ROW]
[ROW][C]22[/C][C]-0.035033[/C][C]-0.2073[/C][C]0.581495[/C][/ROW]
[ROW][C]23[/C][C]-0.139113[/C][C]-0.823[/C][C]0.791961[/C][/ROW]
[ROW][C]24[/C][C]-0.02355[/C][C]-0.1393[/C][C]0.555005[/C][/ROW]
[ROW][C]25[/C][C]0.020532[/C][C]0.1215[/C][C]0.452008[/C][/ROW]
[ROW][C]26[/C][C]-0.012002[/C][C]-0.071[/C][C]0.528101[/C][/ROW]
[ROW][C]27[/C][C]-0.012815[/C][C]-0.0758[/C][C]0.53[/C][/ROW]
[ROW][C]28[/C][C]-0.043525[/C][C]-0.2575[/C][C]0.600849[/C][/ROW]
[ROW][C]29[/C][C]-0.149841[/C][C]-0.8865[/C][C]0.809293[/C][/ROW]
[ROW][C]30[/C][C]-0.051806[/C][C]-0.3065[/C][C]0.619476[/C][/ROW]
[ROW][C]31[/C][C]0.069401[/C][C]0.4106[/C][C]0.341942[/C][/ROW]
[ROW][C]32[/C][C]0.045353[/C][C]0.2683[/C][C]0.395018[/C][/ROW]
[ROW][C]33[/C][C]-0.000773[/C][C]-0.0046[/C][C]0.501811[/C][/ROW]
[ROW][C]34[/C][C]-0.005747[/C][C]-0.034[/C][C]0.513464[/C][/ROW]
[ROW][C]35[/C][C]NA[/C][C]NA[/C][C]NA[/C][/ROW]
[/TABLE]
Source: https://freestatistics.org/blog/index.php?pk=4727&T=1

Globally Unique Identifier (entire table): ba.freestatistics.org/blog/index.php?pk=4727&T=1

As an alternative you can also use a QR Code:  

The GUIDs for individual cells are displayed in the table below:

Autocorrelation Function
Time lag kACF(k)T-STATP-value
015.91610
10.0333730.19740.422314
2-0.358607-2.12150.979485
3-0.051115-0.30240.617932
4-0.082898-0.49040.686555
50.2568241.51940.068823
60.0659440.39010.349402
7-0.16196-0.95820.827725
8-0.13584-0.80360.786486
9-0.183234-1.0840.857118
100.3586032.12150.020516
110.2686651.58940.060477
12-0.239042-1.41420.91693
13-0.07907-0.46780.67858
14-0.085625-0.50660.692182
150.1117110.66090.256504
160.1396370.82610.207171
17-0.125049-0.73980.767822
18-0.149523-0.88460.808793
19-0.063096-0.37330.644404
200.1222610.72330.237149
210.1969611.16520.125902
22-0.035033-0.20730.581495
23-0.139113-0.8230.791961
24-0.02355-0.13930.555005
250.0205320.12150.452008
26-0.012002-0.0710.528101
27-0.012815-0.07580.53
28-0.043525-0.25750.600849
29-0.149841-0.88650.809293
30-0.051806-0.30650.619476
310.0694010.41060.341942
320.0453530.26830.395018
33-0.000773-0.00460.501811
34-0.005747-0.0340.513464
35NANANA


Partial Autocorrelation Function
Time lag kPACF(k)T-STATP-value
00.0333730.19740.422314
1-0.360122-2.13050.979884
2-0.026249-0.15530.561258
3-0.240462-1.42260.918147
40.2910561.72190.046957
5-0.119381-0.70630.757652
60.0777880.46020.324111
7-0.239597-1.41750.917407
8-0.138079-0.81690.790241
90.2874091.70030.04897
100.0732440.43330.333721
110.0054910.03250.487136
120.0238890.14130.444209
13-0.06132-0.36280.640523
140.0662530.3920.348732
15-0.117806-0.6970.754782
160.0439910.26030.398097
17-0.193202-1.1430.869601
180.1627080.96260.171177
19-0.093877-0.55540.708917
200.0921880.54540.294472
21-0.006674-0.03950.515634
22-0.028611-0.16930.566719
230.0797630.47190.319969
24-0.135373-0.80090.785698
25-0.110985-0.65660.742132
26-0.028729-0.170.566992
270.0116160.06870.472801
28-0.121319-0.71770.761157
29-0.179658-1.06290.85244
30-0.030588-0.1810.571279
31-0.138128-0.81720.790322
320.1102680.65240.259216
33-0.049019-0.290.613237
34NANANA
35NANANA

\begin{tabular}{lllllllll}
\hline
Partial Autocorrelation Function \tabularnewline
Time lag k & PACF(k) & T-STAT & P-value \tabularnewline
0 & 0.033373 & 0.1974 & 0.422314 \tabularnewline
1 & -0.360122 & -2.1305 & 0.979884 \tabularnewline
2 & -0.026249 & -0.1553 & 0.561258 \tabularnewline
3 & -0.240462 & -1.4226 & 0.918147 \tabularnewline
4 & 0.291056 & 1.7219 & 0.046957 \tabularnewline
5 & -0.119381 & -0.7063 & 0.757652 \tabularnewline
6 & 0.077788 & 0.4602 & 0.324111 \tabularnewline
7 & -0.239597 & -1.4175 & 0.917407 \tabularnewline
8 & -0.138079 & -0.8169 & 0.790241 \tabularnewline
9 & 0.287409 & 1.7003 & 0.04897 \tabularnewline
10 & 0.073244 & 0.4333 & 0.333721 \tabularnewline
11 & 0.005491 & 0.0325 & 0.487136 \tabularnewline
12 & 0.023889 & 0.1413 & 0.444209 \tabularnewline
13 & -0.06132 & -0.3628 & 0.640523 \tabularnewline
14 & 0.066253 & 0.392 & 0.348732 \tabularnewline
15 & -0.117806 & -0.697 & 0.754782 \tabularnewline
16 & 0.043991 & 0.2603 & 0.398097 \tabularnewline
17 & -0.193202 & -1.143 & 0.869601 \tabularnewline
18 & 0.162708 & 0.9626 & 0.171177 \tabularnewline
19 & -0.093877 & -0.5554 & 0.708917 \tabularnewline
20 & 0.092188 & 0.5454 & 0.294472 \tabularnewline
21 & -0.006674 & -0.0395 & 0.515634 \tabularnewline
22 & -0.028611 & -0.1693 & 0.566719 \tabularnewline
23 & 0.079763 & 0.4719 & 0.319969 \tabularnewline
24 & -0.135373 & -0.8009 & 0.785698 \tabularnewline
25 & -0.110985 & -0.6566 & 0.742132 \tabularnewline
26 & -0.028729 & -0.17 & 0.566992 \tabularnewline
27 & 0.011616 & 0.0687 & 0.472801 \tabularnewline
28 & -0.121319 & -0.7177 & 0.761157 \tabularnewline
29 & -0.179658 & -1.0629 & 0.85244 \tabularnewline
30 & -0.030588 & -0.181 & 0.571279 \tabularnewline
31 & -0.138128 & -0.8172 & 0.790322 \tabularnewline
32 & 0.110268 & 0.6524 & 0.259216 \tabularnewline
33 & -0.049019 & -0.29 & 0.613237 \tabularnewline
34 & NA & NA & NA \tabularnewline
35 & NA & NA & NA \tabularnewline
\hline
\end{tabular}
%Source: https://freestatistics.org/blog/index.php?pk=4727&T=2

[TABLE]
[ROW][C]Partial Autocorrelation Function[/C][/ROW]
[ROW][C]Time lag k[/C][C]PACF(k)[/C][C]T-STAT[/C][C]P-value[/C][/ROW]
[ROW][C]0[/C][C]0.033373[/C][C]0.1974[/C][C]0.422314[/C][/ROW]
[ROW][C]1[/C][C]-0.360122[/C][C]-2.1305[/C][C]0.979884[/C][/ROW]
[ROW][C]2[/C][C]-0.026249[/C][C]-0.1553[/C][C]0.561258[/C][/ROW]
[ROW][C]3[/C][C]-0.240462[/C][C]-1.4226[/C][C]0.918147[/C][/ROW]
[ROW][C]4[/C][C]0.291056[/C][C]1.7219[/C][C]0.046957[/C][/ROW]
[ROW][C]5[/C][C]-0.119381[/C][C]-0.7063[/C][C]0.757652[/C][/ROW]
[ROW][C]6[/C][C]0.077788[/C][C]0.4602[/C][C]0.324111[/C][/ROW]
[ROW][C]7[/C][C]-0.239597[/C][C]-1.4175[/C][C]0.917407[/C][/ROW]
[ROW][C]8[/C][C]-0.138079[/C][C]-0.8169[/C][C]0.790241[/C][/ROW]
[ROW][C]9[/C][C]0.287409[/C][C]1.7003[/C][C]0.04897[/C][/ROW]
[ROW][C]10[/C][C]0.073244[/C][C]0.4333[/C][C]0.333721[/C][/ROW]
[ROW][C]11[/C][C]0.005491[/C][C]0.0325[/C][C]0.487136[/C][/ROW]
[ROW][C]12[/C][C]0.023889[/C][C]0.1413[/C][C]0.444209[/C][/ROW]
[ROW][C]13[/C][C]-0.06132[/C][C]-0.3628[/C][C]0.640523[/C][/ROW]
[ROW][C]14[/C][C]0.066253[/C][C]0.392[/C][C]0.348732[/C][/ROW]
[ROW][C]15[/C][C]-0.117806[/C][C]-0.697[/C][C]0.754782[/C][/ROW]
[ROW][C]16[/C][C]0.043991[/C][C]0.2603[/C][C]0.398097[/C][/ROW]
[ROW][C]17[/C][C]-0.193202[/C][C]-1.143[/C][C]0.869601[/C][/ROW]
[ROW][C]18[/C][C]0.162708[/C][C]0.9626[/C][C]0.171177[/C][/ROW]
[ROW][C]19[/C][C]-0.093877[/C][C]-0.5554[/C][C]0.708917[/C][/ROW]
[ROW][C]20[/C][C]0.092188[/C][C]0.5454[/C][C]0.294472[/C][/ROW]
[ROW][C]21[/C][C]-0.006674[/C][C]-0.0395[/C][C]0.515634[/C][/ROW]
[ROW][C]22[/C][C]-0.028611[/C][C]-0.1693[/C][C]0.566719[/C][/ROW]
[ROW][C]23[/C][C]0.079763[/C][C]0.4719[/C][C]0.319969[/C][/ROW]
[ROW][C]24[/C][C]-0.135373[/C][C]-0.8009[/C][C]0.785698[/C][/ROW]
[ROW][C]25[/C][C]-0.110985[/C][C]-0.6566[/C][C]0.742132[/C][/ROW]
[ROW][C]26[/C][C]-0.028729[/C][C]-0.17[/C][C]0.566992[/C][/ROW]
[ROW][C]27[/C][C]0.011616[/C][C]0.0687[/C][C]0.472801[/C][/ROW]
[ROW][C]28[/C][C]-0.121319[/C][C]-0.7177[/C][C]0.761157[/C][/ROW]
[ROW][C]29[/C][C]-0.179658[/C][C]-1.0629[/C][C]0.85244[/C][/ROW]
[ROW][C]30[/C][C]-0.030588[/C][C]-0.181[/C][C]0.571279[/C][/ROW]
[ROW][C]31[/C][C]-0.138128[/C][C]-0.8172[/C][C]0.790322[/C][/ROW]
[ROW][C]32[/C][C]0.110268[/C][C]0.6524[/C][C]0.259216[/C][/ROW]
[ROW][C]33[/C][C]-0.049019[/C][C]-0.29[/C][C]0.613237[/C][/ROW]
[ROW][C]34[/C][C]NA[/C][C]NA[/C][C]NA[/C][/ROW]
[ROW][C]35[/C][C]NA[/C][C]NA[/C][C]NA[/C][/ROW]
[/TABLE]
Source: https://freestatistics.org/blog/index.php?pk=4727&T=2

Globally Unique Identifier (entire table): ba.freestatistics.org/blog/index.php?pk=4727&T=2

As an alternative you can also use a QR Code:  

The GUIDs for individual cells are displayed in the table below:

Partial Autocorrelation Function
Time lag kPACF(k)T-STATP-value
00.0333730.19740.422314
1-0.360122-2.13050.979884
2-0.026249-0.15530.561258
3-0.240462-1.42260.918147
40.2910561.72190.046957
5-0.119381-0.70630.757652
60.0777880.46020.324111
7-0.239597-1.41750.917407
8-0.138079-0.81690.790241
90.2874091.70030.04897
100.0732440.43330.333721
110.0054910.03250.487136
120.0238890.14130.444209
13-0.06132-0.36280.640523
140.0662530.3920.348732
15-0.117806-0.6970.754782
160.0439910.26030.398097
17-0.193202-1.1430.869601
180.1627080.96260.171177
19-0.093877-0.55540.708917
200.0921880.54540.294472
21-0.006674-0.03950.515634
22-0.028611-0.16930.566719
230.0797630.47190.319969
24-0.135373-0.80090.785698
25-0.110985-0.65660.742132
26-0.028729-0.170.566992
270.0116160.06870.472801
28-0.121319-0.71770.761157
29-0.179658-1.06290.85244
30-0.030588-0.1810.571279
31-0.138128-0.81720.790322
320.1102680.65240.259216
33-0.049019-0.290.613237
34NANANA
35NANANA


Parameters (Session):
par1 = 12 ;
Parameters (R input):
par1 = 36 ; par2 = 1 ; par3 = 1 ; par4 = 1 ; par5 = 12 ;
R code (references can be found in the software module):
if (par1 == 'Default') {
par1 = 10*log10(length(x))
} else {
par1 <- as.numeric(par1)
}
par2 <- as.numeric(par2)
par3 <- as.numeric(par3)
par4 <- as.numeric(par4)
par5 <- as.numeric(par5)
if (par2 == 0) {
x <- log(x)
} else {
x <- (x ^ par2 - 1) / par2
}
if (par3 > 0) x <- diff(x,lag=1,difference=par3)
if (par4 > 0) x <- diff(x,lag=par5,difference=par4)
bitmap(file='pic1.png')
racf <- acf(x,par1,main='Autocorrelation',xlab='lags',ylab='ACF')
dev.off()
bitmap(file='pic2.png')
rpacf <- pacf(x,par1,main='Partial Autocorrelation',xlab='lags',ylab='PACF')
dev.off()
(myacf <- c(racf$acf))
(mypacf <- c(rpacf$acf))
lengthx <- length(x)
sqrtn <- sqrt(lengthx)
load(file='createtable')
a<-table.start()
a<-table.row.start(a)
a<-table.element(a,'Autocorrelation Function',4,TRUE)
a<-table.row.end(a)
a<-table.row.start(a)
a<-table.element(a,'Time lag k',header=TRUE)
a<-table.element(a,hyperlink('basics.htm','ACF(k)','click here for more information about the Autocorrelation Function'),header=TRUE)
a<-table.element(a,'T-STAT',header=TRUE)
a<-table.element(a,'P-value',header=TRUE)
a<-table.row.end(a)
for (i in 1:par1) {
a<-table.row.start(a)
a<-table.element(a,i-1,header=TRUE)
a<-table.element(a,round(myacf[i],6))
mytstat <- myacf[i]*sqrtn
a<-table.element(a,round(mytstat,4))
a<-table.element(a,round(1-pt(mytstat,lengthx),6))
a<-table.row.end(a)
}
a<-table.end(a)
table.save(a,file='mytable.tab')
a<-table.start()
a<-table.row.start(a)
a<-table.element(a,'Partial Autocorrelation Function',4,TRUE)
a<-table.row.end(a)
a<-table.row.start(a)
a<-table.element(a,'Time lag k',header=TRUE)
a<-table.element(a,hyperlink('basics.htm','PACF(k)','click here for more information about the Partial Autocorrelation Function'),header=TRUE)
a<-table.element(a,'T-STAT',header=TRUE)
a<-table.element(a,'P-value',header=TRUE)
a<-table.row.end(a)
for (i in 1:par1) {
a<-table.row.start(a)
a<-table.element(a,i-1,header=TRUE)
a<-table.element(a,round(mypacf[i],6))
mytstat <- mypacf[i]*sqrtn
a<-table.element(a,round(mytstat,4))
a<-table.element(a,round(1-pt(mytstat,lengthx),6))
a<-table.row.end(a)
}
a<-table.end(a)
table.save(a,file='mytable1.tab')