Free Statistics

of Irreproducible Research!

Author's title

Author*Unverified author*
R Software Modulerwasp_autocorrelation.wasp
Title produced by software(Partial) Autocorrelation Function
Date of computationThu, 20 Dec 2007 07:56:51 -0700
Cite this page as followsStatistical Computations at FreeStatistics.org, Office for Research Development and Education, URL https://freestatistics.org/blog/index.php?v=date/2007/Dec/20/t1198161638gvqoykzejzg4ge3.htm/, Retrieved Mon, 29 Apr 2024 08:57:11 +0000
Statistical Computations at FreeStatistics.org, Office for Research Development and Education, URL https://freestatistics.org/blog/index.php?pk=4726, Retrieved Mon, 29 Apr 2024 08:57:11 +0000
QR Codes:

Original text written by user:
IsPrivate?No (this computation is public)
User-defined keywords
Estimated Impact216
Family? (F = Feedback message, R = changed R code, M = changed R Module, P = changed Parameters, D = changed Data)
-       [(Partial) Autocorrelation Function] [(P)ACF Energie 2] [2007-12-20 14:56:51] [d41d8cd98f00b204e9800998ecf8427e] [Current]
Feedback Forum

Post a new message
Dataseries X:
106.8
114.3
105.7
90.1
91.6
97.7
100.8
104.6
95.9
102.7
104
107.9
113.8
113.8
123.1
125.1
137.6
134
140.3
152.1
150.6
167.3
153.2
142
154.4
158.5
180.9
181.3
172.4
192
199.3
215.4
214.3
201.5
190.5
196
215.7
209.4
214.1
237.8
239
237.8
251.5
248.8
215.4
201.2
203.1
214.2


Summary of compuational transaction
Raw Inputview raw input (R code)
Raw Outputview raw output of R engine
Computing time3 seconds
R Server'Herman Ole Andreas Wold' @ 193.190.124.10:1001

\begin{tabular}{lllllllll}
\hline
Summary of compuational transaction \tabularnewline
Raw Input & view raw input (R code)  \tabularnewline
Raw Output & view raw output of R engine  \tabularnewline
Computing time & 3 seconds \tabularnewline
R Server & 'Herman Ole Andreas Wold' @ 193.190.124.10:1001 \tabularnewline
\hline
\end{tabular}
%Source: https://freestatistics.org/blog/index.php?pk=4726&T=0

[TABLE]
[ROW][C]Summary of compuational transaction[/C][/ROW]
[ROW][C]Raw Input[/C][C]view raw input (R code) [/C][/ROW]
[ROW][C]Raw Output[/C][C]view raw output of R engine [/C][/ROW]
[ROW][C]Computing time[/C][C]3 seconds[/C][/ROW]
[ROW][C]R Server[/C][C]'Herman Ole Andreas Wold' @ 193.190.124.10:1001[/C][/ROW]
[/TABLE]
Source: https://freestatistics.org/blog/index.php?pk=4726&T=0

Globally Unique Identifier (entire table): ba.freestatistics.org/blog/index.php?pk=4726&T=0

As an alternative you can also use a QR Code:  

The GUIDs for individual cells are displayed in the table below:

Summary of compuational transaction
Raw Inputview raw input (R code)
Raw Outputview raw output of R engine
Computing time3 seconds
R Server'Herman Ole Andreas Wold' @ 193.190.124.10:1001


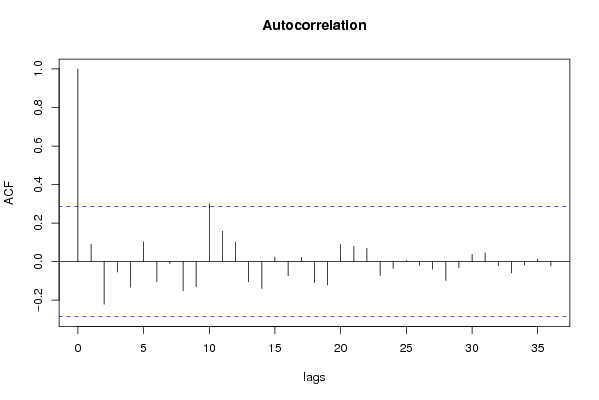
Autocorrelation Function
Time lag kACF(k)T-STATP-value
016.85570
10.0897170.61510.270737
2-0.221101-1.51580.931866
3-0.054195-0.37150.644049
4-0.132042-0.90520.815021
50.1027410.70440.242344
6-0.105213-0.72130.762852
7-0.010519-0.07210.528592
8-0.151173-1.03640.847339
9-0.130076-0.89180.811466
100.3002172.05820.02257
110.157171.07750.143377
120.1022950.70130.243288
13-0.104851-0.71880.762095
14-0.139735-0.9580.828512
150.0236660.16220.435903
16-0.073144-0.50140.690802
170.0218610.14990.440754
18-0.110409-0.75690.773564
19-0.120963-0.82930.79443
200.0882830.60520.273966
210.0803590.55090.292151
220.0689690.47280.319262
23-0.07212-0.49440.688348
24-0.034742-0.23820.593611
250.005470.03750.485121
26-0.02019-0.13840.554749
27-0.039287-0.26930.605576
28-0.097765-0.67020.74701
29-0.03181-0.21810.585844
300.0376470.25810.39873
310.0453870.31120.378529
32-0.021145-0.1450.557321
33-0.058989-0.40440.656127
34-0.018279-0.12530.549596
350.0129910.08910.464705

\begin{tabular}{lllllllll}
\hline
Autocorrelation Function \tabularnewline
Time lag k & ACF(k) & T-STAT & P-value \tabularnewline
0 & 1 & 6.8557 & 0 \tabularnewline
1 & 0.089717 & 0.6151 & 0.270737 \tabularnewline
2 & -0.221101 & -1.5158 & 0.931866 \tabularnewline
3 & -0.054195 & -0.3715 & 0.644049 \tabularnewline
4 & -0.132042 & -0.9052 & 0.815021 \tabularnewline
5 & 0.102741 & 0.7044 & 0.242344 \tabularnewline
6 & -0.105213 & -0.7213 & 0.762852 \tabularnewline
7 & -0.010519 & -0.0721 & 0.528592 \tabularnewline
8 & -0.151173 & -1.0364 & 0.847339 \tabularnewline
9 & -0.130076 & -0.8918 & 0.811466 \tabularnewline
10 & 0.300217 & 2.0582 & 0.02257 \tabularnewline
11 & 0.15717 & 1.0775 & 0.143377 \tabularnewline
12 & 0.102295 & 0.7013 & 0.243288 \tabularnewline
13 & -0.104851 & -0.7188 & 0.762095 \tabularnewline
14 & -0.139735 & -0.958 & 0.828512 \tabularnewline
15 & 0.023666 & 0.1622 & 0.435903 \tabularnewline
16 & -0.073144 & -0.5014 & 0.690802 \tabularnewline
17 & 0.021861 & 0.1499 & 0.440754 \tabularnewline
18 & -0.110409 & -0.7569 & 0.773564 \tabularnewline
19 & -0.120963 & -0.8293 & 0.79443 \tabularnewline
20 & 0.088283 & 0.6052 & 0.273966 \tabularnewline
21 & 0.080359 & 0.5509 & 0.292151 \tabularnewline
22 & 0.068969 & 0.4728 & 0.319262 \tabularnewline
23 & -0.07212 & -0.4944 & 0.688348 \tabularnewline
24 & -0.034742 & -0.2382 & 0.593611 \tabularnewline
25 & 0.00547 & 0.0375 & 0.485121 \tabularnewline
26 & -0.02019 & -0.1384 & 0.554749 \tabularnewline
27 & -0.039287 & -0.2693 & 0.605576 \tabularnewline
28 & -0.097765 & -0.6702 & 0.74701 \tabularnewline
29 & -0.03181 & -0.2181 & 0.585844 \tabularnewline
30 & 0.037647 & 0.2581 & 0.39873 \tabularnewline
31 & 0.045387 & 0.3112 & 0.378529 \tabularnewline
32 & -0.021145 & -0.145 & 0.557321 \tabularnewline
33 & -0.058989 & -0.4044 & 0.656127 \tabularnewline
34 & -0.018279 & -0.1253 & 0.549596 \tabularnewline
35 & 0.012991 & 0.0891 & 0.464705 \tabularnewline
\hline
\end{tabular}
%Source: https://freestatistics.org/blog/index.php?pk=4726&T=1

[TABLE]
[ROW][C]Autocorrelation Function[/C][/ROW]
[ROW][C]Time lag k[/C][C]ACF(k)[/C][C]T-STAT[/C][C]P-value[/C][/ROW]
[ROW][C]0[/C][C]1[/C][C]6.8557[/C][C]0[/C][/ROW]
[ROW][C]1[/C][C]0.089717[/C][C]0.6151[/C][C]0.270737[/C][/ROW]
[ROW][C]2[/C][C]-0.221101[/C][C]-1.5158[/C][C]0.931866[/C][/ROW]
[ROW][C]3[/C][C]-0.054195[/C][C]-0.3715[/C][C]0.644049[/C][/ROW]
[ROW][C]4[/C][C]-0.132042[/C][C]-0.9052[/C][C]0.815021[/C][/ROW]
[ROW][C]5[/C][C]0.102741[/C][C]0.7044[/C][C]0.242344[/C][/ROW]
[ROW][C]6[/C][C]-0.105213[/C][C]-0.7213[/C][C]0.762852[/C][/ROW]
[ROW][C]7[/C][C]-0.010519[/C][C]-0.0721[/C][C]0.528592[/C][/ROW]
[ROW][C]8[/C][C]-0.151173[/C][C]-1.0364[/C][C]0.847339[/C][/ROW]
[ROW][C]9[/C][C]-0.130076[/C][C]-0.8918[/C][C]0.811466[/C][/ROW]
[ROW][C]10[/C][C]0.300217[/C][C]2.0582[/C][C]0.02257[/C][/ROW]
[ROW][C]11[/C][C]0.15717[/C][C]1.0775[/C][C]0.143377[/C][/ROW]
[ROW][C]12[/C][C]0.102295[/C][C]0.7013[/C][C]0.243288[/C][/ROW]
[ROW][C]13[/C][C]-0.104851[/C][C]-0.7188[/C][C]0.762095[/C][/ROW]
[ROW][C]14[/C][C]-0.139735[/C][C]-0.958[/C][C]0.828512[/C][/ROW]
[ROW][C]15[/C][C]0.023666[/C][C]0.1622[/C][C]0.435903[/C][/ROW]
[ROW][C]16[/C][C]-0.073144[/C][C]-0.5014[/C][C]0.690802[/C][/ROW]
[ROW][C]17[/C][C]0.021861[/C][C]0.1499[/C][C]0.440754[/C][/ROW]
[ROW][C]18[/C][C]-0.110409[/C][C]-0.7569[/C][C]0.773564[/C][/ROW]
[ROW][C]19[/C][C]-0.120963[/C][C]-0.8293[/C][C]0.79443[/C][/ROW]
[ROW][C]20[/C][C]0.088283[/C][C]0.6052[/C][C]0.273966[/C][/ROW]
[ROW][C]21[/C][C]0.080359[/C][C]0.5509[/C][C]0.292151[/C][/ROW]
[ROW][C]22[/C][C]0.068969[/C][C]0.4728[/C][C]0.319262[/C][/ROW]
[ROW][C]23[/C][C]-0.07212[/C][C]-0.4944[/C][C]0.688348[/C][/ROW]
[ROW][C]24[/C][C]-0.034742[/C][C]-0.2382[/C][C]0.593611[/C][/ROW]
[ROW][C]25[/C][C]0.00547[/C][C]0.0375[/C][C]0.485121[/C][/ROW]
[ROW][C]26[/C][C]-0.02019[/C][C]-0.1384[/C][C]0.554749[/C][/ROW]
[ROW][C]27[/C][C]-0.039287[/C][C]-0.2693[/C][C]0.605576[/C][/ROW]
[ROW][C]28[/C][C]-0.097765[/C][C]-0.6702[/C][C]0.74701[/C][/ROW]
[ROW][C]29[/C][C]-0.03181[/C][C]-0.2181[/C][C]0.585844[/C][/ROW]
[ROW][C]30[/C][C]0.037647[/C][C]0.2581[/C][C]0.39873[/C][/ROW]
[ROW][C]31[/C][C]0.045387[/C][C]0.3112[/C][C]0.378529[/C][/ROW]
[ROW][C]32[/C][C]-0.021145[/C][C]-0.145[/C][C]0.557321[/C][/ROW]
[ROW][C]33[/C][C]-0.058989[/C][C]-0.4044[/C][C]0.656127[/C][/ROW]
[ROW][C]34[/C][C]-0.018279[/C][C]-0.1253[/C][C]0.549596[/C][/ROW]
[ROW][C]35[/C][C]0.012991[/C][C]0.0891[/C][C]0.464705[/C][/ROW]
[/TABLE]
Source: https://freestatistics.org/blog/index.php?pk=4726&T=1

Globally Unique Identifier (entire table): ba.freestatistics.org/blog/index.php?pk=4726&T=1

As an alternative you can also use a QR Code:  

The GUIDs for individual cells are displayed in the table below:

Autocorrelation Function
Time lag kACF(k)T-STATP-value
016.85570
10.0897170.61510.270737
2-0.221101-1.51580.931866
3-0.054195-0.37150.644049
4-0.132042-0.90520.815021
50.1027410.70440.242344
6-0.105213-0.72130.762852
7-0.010519-0.07210.528592
8-0.151173-1.03640.847339
9-0.130076-0.89180.811466
100.3002172.05820.02257
110.157171.07750.143377
120.1022950.70130.243288
13-0.104851-0.71880.762095
14-0.139735-0.9580.828512
150.0236660.16220.435903
16-0.073144-0.50140.690802
170.0218610.14990.440754
18-0.110409-0.75690.773564
19-0.120963-0.82930.79443
200.0882830.60520.273966
210.0803590.55090.292151
220.0689690.47280.319262
23-0.07212-0.49440.688348
24-0.034742-0.23820.593611
250.005470.03750.485121
26-0.02019-0.13840.554749
27-0.039287-0.26930.605576
28-0.097765-0.67020.74701
29-0.03181-0.21810.585844
300.0376470.25810.39873
310.0453870.31120.378529
32-0.021145-0.1450.557321
33-0.058989-0.40440.656127
34-0.018279-0.12530.549596
350.0129910.08910.464705


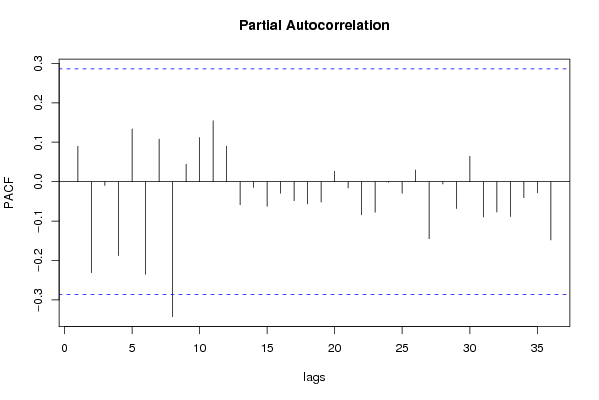
Partial Autocorrelation Function
Time lag kPACF(k)T-STATP-value
00.0897170.61510.270737
1-0.23101-1.58370.940019
2-0.009638-0.06610.526202
3-0.187612-1.28620.897664
40.1337720.91710.181888
5-0.234968-1.61090.943047
60.1076090.73770.232172
7-0.342484-2.3480.988431
80.0442240.30320.381544
90.1117210.76590.223776
100.1544781.05910.147495
110.0899110.61640.270303
12-0.058925-0.4040.655966
13-0.014631-0.10030.539736
14-0.062471-0.42830.664799
15-0.029247-0.20050.579027
16-0.048361-0.33150.629146
17-0.056545-0.38770.649988
18-0.051852-0.35550.63809
190.0263430.18060.428729
20-0.015973-0.10950.543367
21-0.084081-0.57640.716463
22-0.077926-0.53420.702152
23-0.001577-0.01080.50429
24-0.029156-0.19990.578782
250.0295030.20230.420293
26-0.144775-0.99250.836989
27-0.005924-0.04060.516113
28-0.068441-0.46920.679455
290.0644140.44160.330403
30-0.089649-0.61460.729108
31-0.077196-0.52920.700431
32-0.088585-0.60730.726716
33-0.040831-0.27990.609618
34-0.028437-0.1950.576867
35-0.147916-1.01410.842127

\begin{tabular}{lllllllll}
\hline
Partial Autocorrelation Function \tabularnewline
Time lag k & PACF(k) & T-STAT & P-value \tabularnewline
0 & 0.089717 & 0.6151 & 0.270737 \tabularnewline
1 & -0.23101 & -1.5837 & 0.940019 \tabularnewline
2 & -0.009638 & -0.0661 & 0.526202 \tabularnewline
3 & -0.187612 & -1.2862 & 0.897664 \tabularnewline
4 & 0.133772 & 0.9171 & 0.181888 \tabularnewline
5 & -0.234968 & -1.6109 & 0.943047 \tabularnewline
6 & 0.107609 & 0.7377 & 0.232172 \tabularnewline
7 & -0.342484 & -2.348 & 0.988431 \tabularnewline
8 & 0.044224 & 0.3032 & 0.381544 \tabularnewline
9 & 0.111721 & 0.7659 & 0.223776 \tabularnewline
10 & 0.154478 & 1.0591 & 0.147495 \tabularnewline
11 & 0.089911 & 0.6164 & 0.270303 \tabularnewline
12 & -0.058925 & -0.404 & 0.655966 \tabularnewline
13 & -0.014631 & -0.1003 & 0.539736 \tabularnewline
14 & -0.062471 & -0.4283 & 0.664799 \tabularnewline
15 & -0.029247 & -0.2005 & 0.579027 \tabularnewline
16 & -0.048361 & -0.3315 & 0.629146 \tabularnewline
17 & -0.056545 & -0.3877 & 0.649988 \tabularnewline
18 & -0.051852 & -0.3555 & 0.63809 \tabularnewline
19 & 0.026343 & 0.1806 & 0.428729 \tabularnewline
20 & -0.015973 & -0.1095 & 0.543367 \tabularnewline
21 & -0.084081 & -0.5764 & 0.716463 \tabularnewline
22 & -0.077926 & -0.5342 & 0.702152 \tabularnewline
23 & -0.001577 & -0.0108 & 0.50429 \tabularnewline
24 & -0.029156 & -0.1999 & 0.578782 \tabularnewline
25 & 0.029503 & 0.2023 & 0.420293 \tabularnewline
26 & -0.144775 & -0.9925 & 0.836989 \tabularnewline
27 & -0.005924 & -0.0406 & 0.516113 \tabularnewline
28 & -0.068441 & -0.4692 & 0.679455 \tabularnewline
29 & 0.064414 & 0.4416 & 0.330403 \tabularnewline
30 & -0.089649 & -0.6146 & 0.729108 \tabularnewline
31 & -0.077196 & -0.5292 & 0.700431 \tabularnewline
32 & -0.088585 & -0.6073 & 0.726716 \tabularnewline
33 & -0.040831 & -0.2799 & 0.609618 \tabularnewline
34 & -0.028437 & -0.195 & 0.576867 \tabularnewline
35 & -0.147916 & -1.0141 & 0.842127 \tabularnewline
\hline
\end{tabular}
%Source: https://freestatistics.org/blog/index.php?pk=4726&T=2

[TABLE]
[ROW][C]Partial Autocorrelation Function[/C][/ROW]
[ROW][C]Time lag k[/C][C]PACF(k)[/C][C]T-STAT[/C][C]P-value[/C][/ROW]
[ROW][C]0[/C][C]0.089717[/C][C]0.6151[/C][C]0.270737[/C][/ROW]
[ROW][C]1[/C][C]-0.23101[/C][C]-1.5837[/C][C]0.940019[/C][/ROW]
[ROW][C]2[/C][C]-0.009638[/C][C]-0.0661[/C][C]0.526202[/C][/ROW]
[ROW][C]3[/C][C]-0.187612[/C][C]-1.2862[/C][C]0.897664[/C][/ROW]
[ROW][C]4[/C][C]0.133772[/C][C]0.9171[/C][C]0.181888[/C][/ROW]
[ROW][C]5[/C][C]-0.234968[/C][C]-1.6109[/C][C]0.943047[/C][/ROW]
[ROW][C]6[/C][C]0.107609[/C][C]0.7377[/C][C]0.232172[/C][/ROW]
[ROW][C]7[/C][C]-0.342484[/C][C]-2.348[/C][C]0.988431[/C][/ROW]
[ROW][C]8[/C][C]0.044224[/C][C]0.3032[/C][C]0.381544[/C][/ROW]
[ROW][C]9[/C][C]0.111721[/C][C]0.7659[/C][C]0.223776[/C][/ROW]
[ROW][C]10[/C][C]0.154478[/C][C]1.0591[/C][C]0.147495[/C][/ROW]
[ROW][C]11[/C][C]0.089911[/C][C]0.6164[/C][C]0.270303[/C][/ROW]
[ROW][C]12[/C][C]-0.058925[/C][C]-0.404[/C][C]0.655966[/C][/ROW]
[ROW][C]13[/C][C]-0.014631[/C][C]-0.1003[/C][C]0.539736[/C][/ROW]
[ROW][C]14[/C][C]-0.062471[/C][C]-0.4283[/C][C]0.664799[/C][/ROW]
[ROW][C]15[/C][C]-0.029247[/C][C]-0.2005[/C][C]0.579027[/C][/ROW]
[ROW][C]16[/C][C]-0.048361[/C][C]-0.3315[/C][C]0.629146[/C][/ROW]
[ROW][C]17[/C][C]-0.056545[/C][C]-0.3877[/C][C]0.649988[/C][/ROW]
[ROW][C]18[/C][C]-0.051852[/C][C]-0.3555[/C][C]0.63809[/C][/ROW]
[ROW][C]19[/C][C]0.026343[/C][C]0.1806[/C][C]0.428729[/C][/ROW]
[ROW][C]20[/C][C]-0.015973[/C][C]-0.1095[/C][C]0.543367[/C][/ROW]
[ROW][C]21[/C][C]-0.084081[/C][C]-0.5764[/C][C]0.716463[/C][/ROW]
[ROW][C]22[/C][C]-0.077926[/C][C]-0.5342[/C][C]0.702152[/C][/ROW]
[ROW][C]23[/C][C]-0.001577[/C][C]-0.0108[/C][C]0.50429[/C][/ROW]
[ROW][C]24[/C][C]-0.029156[/C][C]-0.1999[/C][C]0.578782[/C][/ROW]
[ROW][C]25[/C][C]0.029503[/C][C]0.2023[/C][C]0.420293[/C][/ROW]
[ROW][C]26[/C][C]-0.144775[/C][C]-0.9925[/C][C]0.836989[/C][/ROW]
[ROW][C]27[/C][C]-0.005924[/C][C]-0.0406[/C][C]0.516113[/C][/ROW]
[ROW][C]28[/C][C]-0.068441[/C][C]-0.4692[/C][C]0.679455[/C][/ROW]
[ROW][C]29[/C][C]0.064414[/C][C]0.4416[/C][C]0.330403[/C][/ROW]
[ROW][C]30[/C][C]-0.089649[/C][C]-0.6146[/C][C]0.729108[/C][/ROW]
[ROW][C]31[/C][C]-0.077196[/C][C]-0.5292[/C][C]0.700431[/C][/ROW]
[ROW][C]32[/C][C]-0.088585[/C][C]-0.6073[/C][C]0.726716[/C][/ROW]
[ROW][C]33[/C][C]-0.040831[/C][C]-0.2799[/C][C]0.609618[/C][/ROW]
[ROW][C]34[/C][C]-0.028437[/C][C]-0.195[/C][C]0.576867[/C][/ROW]
[ROW][C]35[/C][C]-0.147916[/C][C]-1.0141[/C][C]0.842127[/C][/ROW]
[/TABLE]
Source: https://freestatistics.org/blog/index.php?pk=4726&T=2

Globally Unique Identifier (entire table): ba.freestatistics.org/blog/index.php?pk=4726&T=2

As an alternative you can also use a QR Code:  

The GUIDs for individual cells are displayed in the table below:

Partial Autocorrelation Function
Time lag kPACF(k)T-STATP-value
00.0897170.61510.270737
1-0.23101-1.58370.940019
2-0.009638-0.06610.526202
3-0.187612-1.28620.897664
40.1337720.91710.181888
5-0.234968-1.61090.943047
60.1076090.73770.232172
7-0.342484-2.3480.988431
80.0442240.30320.381544
90.1117210.76590.223776
100.1544781.05910.147495
110.0899110.61640.270303
12-0.058925-0.4040.655966
13-0.014631-0.10030.539736
14-0.062471-0.42830.664799
15-0.029247-0.20050.579027
16-0.048361-0.33150.629146
17-0.056545-0.38770.649988
18-0.051852-0.35550.63809
190.0263430.18060.428729
20-0.015973-0.10950.543367
21-0.084081-0.57640.716463
22-0.077926-0.53420.702152
23-0.001577-0.01080.50429
24-0.029156-0.19990.578782
250.0295030.20230.420293
26-0.144775-0.99250.836989
27-0.005924-0.04060.516113
28-0.068441-0.46920.679455
290.0644140.44160.330403
30-0.089649-0.61460.729108
31-0.077196-0.52920.700431
32-0.088585-0.60730.726716
33-0.040831-0.27990.609618
34-0.028437-0.1950.576867
35-0.147916-1.01410.842127


Parameters (Session):
par1 = 12 ;
Parameters (R input):
par1 = 36 ; par2 = 1 ; par3 = 1 ; par4 = 0 ; par5 = 12 ;
R code (references can be found in the software module):
if (par1 == 'Default') {
par1 = 10*log10(length(x))
} else {
par1 <- as.numeric(par1)
}
par2 <- as.numeric(par2)
par3 <- as.numeric(par3)
par4 <- as.numeric(par4)
par5 <- as.numeric(par5)
if (par2 == 0) {
x <- log(x)
} else {
x <- (x ^ par2 - 1) / par2
}
if (par3 > 0) x <- diff(x,lag=1,difference=par3)
if (par4 > 0) x <- diff(x,lag=par5,difference=par4)
bitmap(file='pic1.png')
racf <- acf(x,par1,main='Autocorrelation',xlab='lags',ylab='ACF')
dev.off()
bitmap(file='pic2.png')
rpacf <- pacf(x,par1,main='Partial Autocorrelation',xlab='lags',ylab='PACF')
dev.off()
(myacf <- c(racf$acf))
(mypacf <- c(rpacf$acf))
lengthx <- length(x)
sqrtn <- sqrt(lengthx)
load(file='createtable')
a<-table.start()
a<-table.row.start(a)
a<-table.element(a,'Autocorrelation Function',4,TRUE)
a<-table.row.end(a)
a<-table.row.start(a)
a<-table.element(a,'Time lag k',header=TRUE)
a<-table.element(a,hyperlink('basics.htm','ACF(k)','click here for more information about the Autocorrelation Function'),header=TRUE)
a<-table.element(a,'T-STAT',header=TRUE)
a<-table.element(a,'P-value',header=TRUE)
a<-table.row.end(a)
for (i in 1:par1) {
a<-table.row.start(a)
a<-table.element(a,i-1,header=TRUE)
a<-table.element(a,round(myacf[i],6))
mytstat <- myacf[i]*sqrtn
a<-table.element(a,round(mytstat,4))
a<-table.element(a,round(1-pt(mytstat,lengthx),6))
a<-table.row.end(a)
}
a<-table.end(a)
table.save(a,file='mytable.tab')
a<-table.start()
a<-table.row.start(a)
a<-table.element(a,'Partial Autocorrelation Function',4,TRUE)
a<-table.row.end(a)
a<-table.row.start(a)
a<-table.element(a,'Time lag k',header=TRUE)
a<-table.element(a,hyperlink('basics.htm','PACF(k)','click here for more information about the Partial Autocorrelation Function'),header=TRUE)
a<-table.element(a,'T-STAT',header=TRUE)
a<-table.element(a,'P-value',header=TRUE)
a<-table.row.end(a)
for (i in 1:par1) {
a<-table.row.start(a)
a<-table.element(a,i-1,header=TRUE)
a<-table.element(a,round(mypacf[i],6))
mytstat <- mypacf[i]*sqrtn
a<-table.element(a,round(mytstat,4))
a<-table.element(a,round(1-pt(mytstat,lengthx),6))
a<-table.row.end(a)
}
a<-table.end(a)
table.save(a,file='mytable1.tab')