Free Statistics

of Irreproducible Research!

Author's title

Author*Unverified author*
R Software Modulerwasp_autocorrelation.wasp
Title produced by software(Partial) Autocorrelation Function
Date of computationThu, 20 Dec 2007 07:52:34 -0700
Cite this page as followsStatistical Computations at FreeStatistics.org, Office for Research Development and Education, URL https://freestatistics.org/blog/index.php?v=date/2007/Dec/20/t11981613437fskd42lm2cckk6.htm/, Retrieved Mon, 29 Apr 2024 10:59:21 +0000
Statistical Computations at FreeStatistics.org, Office for Research Development and Education, URL https://freestatistics.org/blog/index.php?pk=4725, Retrieved Mon, 29 Apr 2024 10:59:21 +0000
QR Codes:

Original text written by user:
IsPrivate?No (this computation is public)
User-defined keywords
Estimated Impact220
Family? (F = Feedback message, R = changed R code, M = changed R Module, P = changed Parameters, D = changed Data)
-       [(Partial) Autocorrelation Function] [(P)ACF Energie] [2007-12-20 14:52:34] [d41d8cd98f00b204e9800998ecf8427e] [Current]
Feedback Forum

Post a new message
Dataseries X:
106.8
114.3
105.7
90.1
91.6
97.7
100.8
104.6
95.9
102.7
104
107.9
113.8
113.8
123.1
125.1
137.6
134
140.3
152.1
150.6
167.3
153.2
142
154.4
158.5
180.9
181.3
172.4
192
199.3
215.4
214.3
201.5
190.5
196
215.7
209.4
214.1
237.8
239
237.8
251.5
248.8
215.4
201.2
203.1
214.2


Summary of compuational transaction
Raw Inputview raw input (R code)
Raw Outputview raw output of R engine
Computing time2 seconds
R Server'Gwilym Jenkins' @ 72.249.127.135

\begin{tabular}{lllllllll}
\hline
Summary of compuational transaction \tabularnewline
Raw Input & view raw input (R code)  \tabularnewline
Raw Output & view raw output of R engine  \tabularnewline
Computing time & 2 seconds \tabularnewline
R Server & 'Gwilym Jenkins' @ 72.249.127.135 \tabularnewline
\hline
\end{tabular}
%Source: https://freestatistics.org/blog/index.php?pk=4725&T=0

[TABLE]
[ROW][C]Summary of compuational transaction[/C][/ROW]
[ROW][C]Raw Input[/C][C]view raw input (R code) [/C][/ROW]
[ROW][C]Raw Output[/C][C]view raw output of R engine [/C][/ROW]
[ROW][C]Computing time[/C][C]2 seconds[/C][/ROW]
[ROW][C]R Server[/C][C]'Gwilym Jenkins' @ 72.249.127.135[/C][/ROW]
[/TABLE]
Source: https://freestatistics.org/blog/index.php?pk=4725&T=0

Globally Unique Identifier (entire table): ba.freestatistics.org/blog/index.php?pk=4725&T=0

As an alternative you can also use a QR Code:  

The GUIDs for individual cells are displayed in the table below:

Summary of compuational transaction
Raw Inputview raw input (R code)
Raw Outputview raw output of R engine
Computing time2 seconds
R Server'Gwilym Jenkins' @ 72.249.127.135


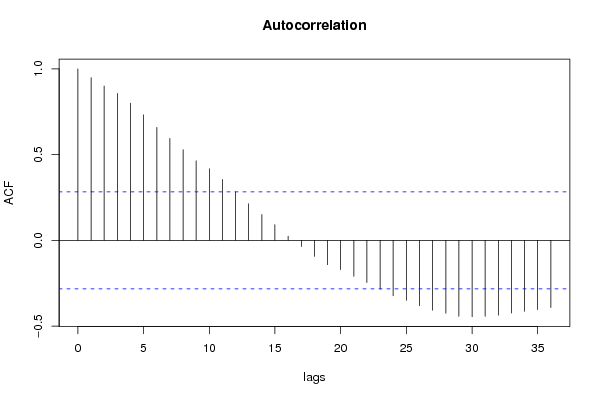
Autocorrelation Function
Time lag kACF(k)T-STATP-value
016.92820
10.9488976.57420
20.900036.23560
30.8569815.93730
40.8002235.54411e-06
50.7327745.07683e-06
60.6586634.56331.8e-05
70.5944294.11837.5e-05
80.5290683.66550.000308
90.4644693.21790.001158
100.417582.89310.00286
110.3557842.46490.008666
120.2825711.95770.028046
130.2136261.480.072698
140.1502851.04120.151498
150.0914260.63340.264734
160.0242490.1680.433642
17-0.035943-0.2490.597797
18-0.093907-0.65060.740799
19-0.141875-0.98290.834716
20-0.17064-1.18220.878531
21-0.21001-1.4550.92391
22-0.246375-1.70690.952852
23-0.284214-1.96910.972635
24-0.323315-2.240.985121
25-0.350022-2.4250.99044
26-0.380995-2.63960.994419
27-0.407255-2.82150.996534
28-0.424572-2.94150.997493
29-0.442806-3.06780.998231
30-0.445025-3.08320.998305
31-0.442882-3.06840.998233
32-0.436685-3.02540.998009
33-0.424112-2.93830.997471
34-0.413824-2.86710.996932
35-0.403845-2.79790.996309

\begin{tabular}{lllllllll}
\hline
Autocorrelation Function \tabularnewline
Time lag k & ACF(k) & T-STAT & P-value \tabularnewline
0 & 1 & 6.9282 & 0 \tabularnewline
1 & 0.948897 & 6.5742 & 0 \tabularnewline
2 & 0.90003 & 6.2356 & 0 \tabularnewline
3 & 0.856981 & 5.9373 & 0 \tabularnewline
4 & 0.800223 & 5.5441 & 1e-06 \tabularnewline
5 & 0.732774 & 5.0768 & 3e-06 \tabularnewline
6 & 0.658663 & 4.5633 & 1.8e-05 \tabularnewline
7 & 0.594429 & 4.1183 & 7.5e-05 \tabularnewline
8 & 0.529068 & 3.6655 & 0.000308 \tabularnewline
9 & 0.464469 & 3.2179 & 0.001158 \tabularnewline
10 & 0.41758 & 2.8931 & 0.00286 \tabularnewline
11 & 0.355784 & 2.4649 & 0.008666 \tabularnewline
12 & 0.282571 & 1.9577 & 0.028046 \tabularnewline
13 & 0.213626 & 1.48 & 0.072698 \tabularnewline
14 & 0.150285 & 1.0412 & 0.151498 \tabularnewline
15 & 0.091426 & 0.6334 & 0.264734 \tabularnewline
16 & 0.024249 & 0.168 & 0.433642 \tabularnewline
17 & -0.035943 & -0.249 & 0.597797 \tabularnewline
18 & -0.093907 & -0.6506 & 0.740799 \tabularnewline
19 & -0.141875 & -0.9829 & 0.834716 \tabularnewline
20 & -0.17064 & -1.1822 & 0.878531 \tabularnewline
21 & -0.21001 & -1.455 & 0.92391 \tabularnewline
22 & -0.246375 & -1.7069 & 0.952852 \tabularnewline
23 & -0.284214 & -1.9691 & 0.972635 \tabularnewline
24 & -0.323315 & -2.24 & 0.985121 \tabularnewline
25 & -0.350022 & -2.425 & 0.99044 \tabularnewline
26 & -0.380995 & -2.6396 & 0.994419 \tabularnewline
27 & -0.407255 & -2.8215 & 0.996534 \tabularnewline
28 & -0.424572 & -2.9415 & 0.997493 \tabularnewline
29 & -0.442806 & -3.0678 & 0.998231 \tabularnewline
30 & -0.445025 & -3.0832 & 0.998305 \tabularnewline
31 & -0.442882 & -3.0684 & 0.998233 \tabularnewline
32 & -0.436685 & -3.0254 & 0.998009 \tabularnewline
33 & -0.424112 & -2.9383 & 0.997471 \tabularnewline
34 & -0.413824 & -2.8671 & 0.996932 \tabularnewline
35 & -0.403845 & -2.7979 & 0.996309 \tabularnewline
\hline
\end{tabular}
%Source: https://freestatistics.org/blog/index.php?pk=4725&T=1

[TABLE]
[ROW][C]Autocorrelation Function[/C][/ROW]
[ROW][C]Time lag k[/C][C]ACF(k)[/C][C]T-STAT[/C][C]P-value[/C][/ROW]
[ROW][C]0[/C][C]1[/C][C]6.9282[/C][C]0[/C][/ROW]
[ROW][C]1[/C][C]0.948897[/C][C]6.5742[/C][C]0[/C][/ROW]
[ROW][C]2[/C][C]0.90003[/C][C]6.2356[/C][C]0[/C][/ROW]
[ROW][C]3[/C][C]0.856981[/C][C]5.9373[/C][C]0[/C][/ROW]
[ROW][C]4[/C][C]0.800223[/C][C]5.5441[/C][C]1e-06[/C][/ROW]
[ROW][C]5[/C][C]0.732774[/C][C]5.0768[/C][C]3e-06[/C][/ROW]
[ROW][C]6[/C][C]0.658663[/C][C]4.5633[/C][C]1.8e-05[/C][/ROW]
[ROW][C]7[/C][C]0.594429[/C][C]4.1183[/C][C]7.5e-05[/C][/ROW]
[ROW][C]8[/C][C]0.529068[/C][C]3.6655[/C][C]0.000308[/C][/ROW]
[ROW][C]9[/C][C]0.464469[/C][C]3.2179[/C][C]0.001158[/C][/ROW]
[ROW][C]10[/C][C]0.41758[/C][C]2.8931[/C][C]0.00286[/C][/ROW]
[ROW][C]11[/C][C]0.355784[/C][C]2.4649[/C][C]0.008666[/C][/ROW]
[ROW][C]12[/C][C]0.282571[/C][C]1.9577[/C][C]0.028046[/C][/ROW]
[ROW][C]13[/C][C]0.213626[/C][C]1.48[/C][C]0.072698[/C][/ROW]
[ROW][C]14[/C][C]0.150285[/C][C]1.0412[/C][C]0.151498[/C][/ROW]
[ROW][C]15[/C][C]0.091426[/C][C]0.6334[/C][C]0.264734[/C][/ROW]
[ROW][C]16[/C][C]0.024249[/C][C]0.168[/C][C]0.433642[/C][/ROW]
[ROW][C]17[/C][C]-0.035943[/C][C]-0.249[/C][C]0.597797[/C][/ROW]
[ROW][C]18[/C][C]-0.093907[/C][C]-0.6506[/C][C]0.740799[/C][/ROW]
[ROW][C]19[/C][C]-0.141875[/C][C]-0.9829[/C][C]0.834716[/C][/ROW]
[ROW][C]20[/C][C]-0.17064[/C][C]-1.1822[/C][C]0.878531[/C][/ROW]
[ROW][C]21[/C][C]-0.21001[/C][C]-1.455[/C][C]0.92391[/C][/ROW]
[ROW][C]22[/C][C]-0.246375[/C][C]-1.7069[/C][C]0.952852[/C][/ROW]
[ROW][C]23[/C][C]-0.284214[/C][C]-1.9691[/C][C]0.972635[/C][/ROW]
[ROW][C]24[/C][C]-0.323315[/C][C]-2.24[/C][C]0.985121[/C][/ROW]
[ROW][C]25[/C][C]-0.350022[/C][C]-2.425[/C][C]0.99044[/C][/ROW]
[ROW][C]26[/C][C]-0.380995[/C][C]-2.6396[/C][C]0.994419[/C][/ROW]
[ROW][C]27[/C][C]-0.407255[/C][C]-2.8215[/C][C]0.996534[/C][/ROW]
[ROW][C]28[/C][C]-0.424572[/C][C]-2.9415[/C][C]0.997493[/C][/ROW]
[ROW][C]29[/C][C]-0.442806[/C][C]-3.0678[/C][C]0.998231[/C][/ROW]
[ROW][C]30[/C][C]-0.445025[/C][C]-3.0832[/C][C]0.998305[/C][/ROW]
[ROW][C]31[/C][C]-0.442882[/C][C]-3.0684[/C][C]0.998233[/C][/ROW]
[ROW][C]32[/C][C]-0.436685[/C][C]-3.0254[/C][C]0.998009[/C][/ROW]
[ROW][C]33[/C][C]-0.424112[/C][C]-2.9383[/C][C]0.997471[/C][/ROW]
[ROW][C]34[/C][C]-0.413824[/C][C]-2.8671[/C][C]0.996932[/C][/ROW]
[ROW][C]35[/C][C]-0.403845[/C][C]-2.7979[/C][C]0.996309[/C][/ROW]
[/TABLE]
Source: https://freestatistics.org/blog/index.php?pk=4725&T=1

Globally Unique Identifier (entire table): ba.freestatistics.org/blog/index.php?pk=4725&T=1

As an alternative you can also use a QR Code:  

The GUIDs for individual cells are displayed in the table below:

Autocorrelation Function
Time lag kACF(k)T-STATP-value
016.92820
10.9488976.57420
20.900036.23560
30.8569815.93730
40.8002235.54411e-06
50.7327745.07683e-06
60.6586634.56331.8e-05
70.5944294.11837.5e-05
80.5290683.66550.000308
90.4644693.21790.001158
100.417582.89310.00286
110.3557842.46490.008666
120.2825711.95770.028046
130.2136261.480.072698
140.1502851.04120.151498
150.0914260.63340.264734
160.0242490.1680.433642
17-0.035943-0.2490.597797
18-0.093907-0.65060.740799
19-0.141875-0.98290.834716
20-0.17064-1.18220.878531
21-0.21001-1.4550.92391
22-0.246375-1.70690.952852
23-0.284214-1.96910.972635
24-0.323315-2.240.985121
25-0.350022-2.4250.99044
26-0.380995-2.63960.994419
27-0.407255-2.82150.996534
28-0.424572-2.94150.997493
29-0.442806-3.06780.998231
30-0.445025-3.08320.998305
31-0.442882-3.06840.998233
32-0.436685-3.02540.998009
33-0.424112-2.93830.997471
34-0.413824-2.86710.996932
35-0.403845-2.79790.996309


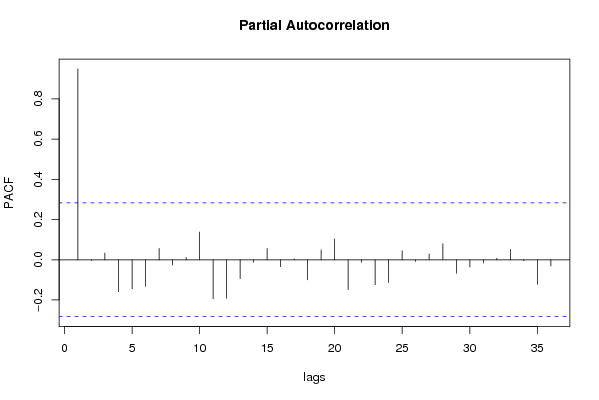
Partial Autocorrelation Function
Time lag kPACF(k)T-STATP-value
00.9488976.57420
1-0.003778-0.02620.510387
20.033170.22980.40961
3-0.158655-1.09920.861417
4-0.143818-0.99640.837974
5-0.132189-0.91580.817834
60.0560730.38850.349687
7-0.025774-0.17860.570485
80.0113220.07840.468901
90.1376880.95390.17245
10-0.19436-1.34660.907778
11-0.190785-1.32180.90375
12-0.093207-0.64580.739243
13-0.012767-0.08840.535056
140.0564930.39140.348618
15-0.034271-0.23740.593337
160.0047890.03320.486835
17-0.099803-0.69150.753696
180.0487420.33770.368532
190.1035880.71770.238217
20-0.147958-1.02510.844769
21-0.012677-0.08780.53481
22-0.123784-0.85760.802312
23-0.113418-0.78580.782073
240.0447560.31010.378922
25-0.008488-0.05880.523325
260.028130.19490.423151
270.0792230.54890.292817
28-0.06678-0.46270.677152
29-0.035717-0.24750.597194
30-0.016578-0.11490.545481
310.0077920.0540.478586
320.0516750.3580.360952
33-0.004697-0.03250.512913
34-0.122743-0.85040.800335
35-0.031184-0.21610.585069

\begin{tabular}{lllllllll}
\hline
Partial Autocorrelation Function \tabularnewline
Time lag k & PACF(k) & T-STAT & P-value \tabularnewline
0 & 0.948897 & 6.5742 & 0 \tabularnewline
1 & -0.003778 & -0.0262 & 0.510387 \tabularnewline
2 & 0.03317 & 0.2298 & 0.40961 \tabularnewline
3 & -0.158655 & -1.0992 & 0.861417 \tabularnewline
4 & -0.143818 & -0.9964 & 0.837974 \tabularnewline
5 & -0.132189 & -0.9158 & 0.817834 \tabularnewline
6 & 0.056073 & 0.3885 & 0.349687 \tabularnewline
7 & -0.025774 & -0.1786 & 0.570485 \tabularnewline
8 & 0.011322 & 0.0784 & 0.468901 \tabularnewline
9 & 0.137688 & 0.9539 & 0.17245 \tabularnewline
10 & -0.19436 & -1.3466 & 0.907778 \tabularnewline
11 & -0.190785 & -1.3218 & 0.90375 \tabularnewline
12 & -0.093207 & -0.6458 & 0.739243 \tabularnewline
13 & -0.012767 & -0.0884 & 0.535056 \tabularnewline
14 & 0.056493 & 0.3914 & 0.348618 \tabularnewline
15 & -0.034271 & -0.2374 & 0.593337 \tabularnewline
16 & 0.004789 & 0.0332 & 0.486835 \tabularnewline
17 & -0.099803 & -0.6915 & 0.753696 \tabularnewline
18 & 0.048742 & 0.3377 & 0.368532 \tabularnewline
19 & 0.103588 & 0.7177 & 0.238217 \tabularnewline
20 & -0.147958 & -1.0251 & 0.844769 \tabularnewline
21 & -0.012677 & -0.0878 & 0.53481 \tabularnewline
22 & -0.123784 & -0.8576 & 0.802312 \tabularnewline
23 & -0.113418 & -0.7858 & 0.782073 \tabularnewline
24 & 0.044756 & 0.3101 & 0.378922 \tabularnewline
25 & -0.008488 & -0.0588 & 0.523325 \tabularnewline
26 & 0.02813 & 0.1949 & 0.423151 \tabularnewline
27 & 0.079223 & 0.5489 & 0.292817 \tabularnewline
28 & -0.06678 & -0.4627 & 0.677152 \tabularnewline
29 & -0.035717 & -0.2475 & 0.597194 \tabularnewline
30 & -0.016578 & -0.1149 & 0.545481 \tabularnewline
31 & 0.007792 & 0.054 & 0.478586 \tabularnewline
32 & 0.051675 & 0.358 & 0.360952 \tabularnewline
33 & -0.004697 & -0.0325 & 0.512913 \tabularnewline
34 & -0.122743 & -0.8504 & 0.800335 \tabularnewline
35 & -0.031184 & -0.2161 & 0.585069 \tabularnewline
\hline
\end{tabular}
%Source: https://freestatistics.org/blog/index.php?pk=4725&T=2

[TABLE]
[ROW][C]Partial Autocorrelation Function[/C][/ROW]
[ROW][C]Time lag k[/C][C]PACF(k)[/C][C]T-STAT[/C][C]P-value[/C][/ROW]
[ROW][C]0[/C][C]0.948897[/C][C]6.5742[/C][C]0[/C][/ROW]
[ROW][C]1[/C][C]-0.003778[/C][C]-0.0262[/C][C]0.510387[/C][/ROW]
[ROW][C]2[/C][C]0.03317[/C][C]0.2298[/C][C]0.40961[/C][/ROW]
[ROW][C]3[/C][C]-0.158655[/C][C]-1.0992[/C][C]0.861417[/C][/ROW]
[ROW][C]4[/C][C]-0.143818[/C][C]-0.9964[/C][C]0.837974[/C][/ROW]
[ROW][C]5[/C][C]-0.132189[/C][C]-0.9158[/C][C]0.817834[/C][/ROW]
[ROW][C]6[/C][C]0.056073[/C][C]0.3885[/C][C]0.349687[/C][/ROW]
[ROW][C]7[/C][C]-0.025774[/C][C]-0.1786[/C][C]0.570485[/C][/ROW]
[ROW][C]8[/C][C]0.011322[/C][C]0.0784[/C][C]0.468901[/C][/ROW]
[ROW][C]9[/C][C]0.137688[/C][C]0.9539[/C][C]0.17245[/C][/ROW]
[ROW][C]10[/C][C]-0.19436[/C][C]-1.3466[/C][C]0.907778[/C][/ROW]
[ROW][C]11[/C][C]-0.190785[/C][C]-1.3218[/C][C]0.90375[/C][/ROW]
[ROW][C]12[/C][C]-0.093207[/C][C]-0.6458[/C][C]0.739243[/C][/ROW]
[ROW][C]13[/C][C]-0.012767[/C][C]-0.0884[/C][C]0.535056[/C][/ROW]
[ROW][C]14[/C][C]0.056493[/C][C]0.3914[/C][C]0.348618[/C][/ROW]
[ROW][C]15[/C][C]-0.034271[/C][C]-0.2374[/C][C]0.593337[/C][/ROW]
[ROW][C]16[/C][C]0.004789[/C][C]0.0332[/C][C]0.486835[/C][/ROW]
[ROW][C]17[/C][C]-0.099803[/C][C]-0.6915[/C][C]0.753696[/C][/ROW]
[ROW][C]18[/C][C]0.048742[/C][C]0.3377[/C][C]0.368532[/C][/ROW]
[ROW][C]19[/C][C]0.103588[/C][C]0.7177[/C][C]0.238217[/C][/ROW]
[ROW][C]20[/C][C]-0.147958[/C][C]-1.0251[/C][C]0.844769[/C][/ROW]
[ROW][C]21[/C][C]-0.012677[/C][C]-0.0878[/C][C]0.53481[/C][/ROW]
[ROW][C]22[/C][C]-0.123784[/C][C]-0.8576[/C][C]0.802312[/C][/ROW]
[ROW][C]23[/C][C]-0.113418[/C][C]-0.7858[/C][C]0.782073[/C][/ROW]
[ROW][C]24[/C][C]0.044756[/C][C]0.3101[/C][C]0.378922[/C][/ROW]
[ROW][C]25[/C][C]-0.008488[/C][C]-0.0588[/C][C]0.523325[/C][/ROW]
[ROW][C]26[/C][C]0.02813[/C][C]0.1949[/C][C]0.423151[/C][/ROW]
[ROW][C]27[/C][C]0.079223[/C][C]0.5489[/C][C]0.292817[/C][/ROW]
[ROW][C]28[/C][C]-0.06678[/C][C]-0.4627[/C][C]0.677152[/C][/ROW]
[ROW][C]29[/C][C]-0.035717[/C][C]-0.2475[/C][C]0.597194[/C][/ROW]
[ROW][C]30[/C][C]-0.016578[/C][C]-0.1149[/C][C]0.545481[/C][/ROW]
[ROW][C]31[/C][C]0.007792[/C][C]0.054[/C][C]0.478586[/C][/ROW]
[ROW][C]32[/C][C]0.051675[/C][C]0.358[/C][C]0.360952[/C][/ROW]
[ROW][C]33[/C][C]-0.004697[/C][C]-0.0325[/C][C]0.512913[/C][/ROW]
[ROW][C]34[/C][C]-0.122743[/C][C]-0.8504[/C][C]0.800335[/C][/ROW]
[ROW][C]35[/C][C]-0.031184[/C][C]-0.2161[/C][C]0.585069[/C][/ROW]
[/TABLE]
Source: https://freestatistics.org/blog/index.php?pk=4725&T=2

Globally Unique Identifier (entire table): ba.freestatistics.org/blog/index.php?pk=4725&T=2

As an alternative you can also use a QR Code:  

The GUIDs for individual cells are displayed in the table below:

Partial Autocorrelation Function
Time lag kPACF(k)T-STATP-value
00.9488976.57420
1-0.003778-0.02620.510387
20.033170.22980.40961
3-0.158655-1.09920.861417
4-0.143818-0.99640.837974
5-0.132189-0.91580.817834
60.0560730.38850.349687
7-0.025774-0.17860.570485
80.0113220.07840.468901
90.1376880.95390.17245
10-0.19436-1.34660.907778
11-0.190785-1.32180.90375
12-0.093207-0.64580.739243
13-0.012767-0.08840.535056
140.0564930.39140.348618
15-0.034271-0.23740.593337
160.0047890.03320.486835
17-0.099803-0.69150.753696
180.0487420.33770.368532
190.1035880.71770.238217
20-0.147958-1.02510.844769
21-0.012677-0.08780.53481
22-0.123784-0.85760.802312
23-0.113418-0.78580.782073
240.0447560.31010.378922
25-0.008488-0.05880.523325
260.028130.19490.423151
270.0792230.54890.292817
28-0.06678-0.46270.677152
29-0.035717-0.24750.597194
30-0.016578-0.11490.545481
310.0077920.0540.478586
320.0516750.3580.360952
33-0.004697-0.03250.512913
34-0.122743-0.85040.800335
35-0.031184-0.21610.585069


Parameters (Session):
par1 = 12 ;
Parameters (R input):
par1 = 36 ; par2 = 1 ; par3 = 0 ; par4 = 0 ; par5 = 12 ;
R code (references can be found in the software module):
if (par1 == 'Default') {
par1 = 10*log10(length(x))
} else {
par1 <- as.numeric(par1)
}
par2 <- as.numeric(par2)
par3 <- as.numeric(par3)
par4 <- as.numeric(par4)
par5 <- as.numeric(par5)
if (par2 == 0) {
x <- log(x)
} else {
x <- (x ^ par2 - 1) / par2
}
if (par3 > 0) x <- diff(x,lag=1,difference=par3)
if (par4 > 0) x <- diff(x,lag=par5,difference=par4)
bitmap(file='pic1.png')
racf <- acf(x,par1,main='Autocorrelation',xlab='lags',ylab='ACF')
dev.off()
bitmap(file='pic2.png')
rpacf <- pacf(x,par1,main='Partial Autocorrelation',xlab='lags',ylab='PACF')
dev.off()
(myacf <- c(racf$acf))
(mypacf <- c(rpacf$acf))
lengthx <- length(x)
sqrtn <- sqrt(lengthx)
load(file='createtable')
a<-table.start()
a<-table.row.start(a)
a<-table.element(a,'Autocorrelation Function',4,TRUE)
a<-table.row.end(a)
a<-table.row.start(a)
a<-table.element(a,'Time lag k',header=TRUE)
a<-table.element(a,hyperlink('basics.htm','ACF(k)','click here for more information about the Autocorrelation Function'),header=TRUE)
a<-table.element(a,'T-STAT',header=TRUE)
a<-table.element(a,'P-value',header=TRUE)
a<-table.row.end(a)
for (i in 1:par1) {
a<-table.row.start(a)
a<-table.element(a,i-1,header=TRUE)
a<-table.element(a,round(myacf[i],6))
mytstat <- myacf[i]*sqrtn
a<-table.element(a,round(mytstat,4))
a<-table.element(a,round(1-pt(mytstat,lengthx),6))
a<-table.row.end(a)
}
a<-table.end(a)
table.save(a,file='mytable.tab')
a<-table.start()
a<-table.row.start(a)
a<-table.element(a,'Partial Autocorrelation Function',4,TRUE)
a<-table.row.end(a)
a<-table.row.start(a)
a<-table.element(a,'Time lag k',header=TRUE)
a<-table.element(a,hyperlink('basics.htm','PACF(k)','click here for more information about the Partial Autocorrelation Function'),header=TRUE)
a<-table.element(a,'T-STAT',header=TRUE)
a<-table.element(a,'P-value',header=TRUE)
a<-table.row.end(a)
for (i in 1:par1) {
a<-table.row.start(a)
a<-table.element(a,i-1,header=TRUE)
a<-table.element(a,round(mypacf[i],6))
mytstat <- mypacf[i]*sqrtn
a<-table.element(a,round(mytstat,4))
a<-table.element(a,round(1-pt(mytstat,lengthx),6))
a<-table.row.end(a)
}
a<-table.end(a)
table.save(a,file='mytable1.tab')