Free Statistics

of Irreproducible Research!

Author's title

Author*Unverified author*
R Software Modulerwasp_notchedbox1.wasp
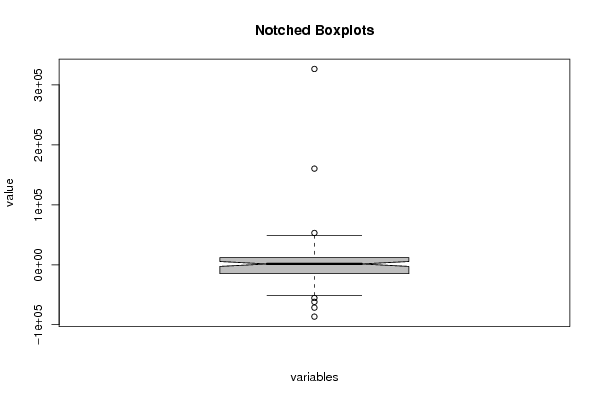
Title produced by softwareNotched Boxplots
Date of computationThu, 20 Dec 2007 06:00:16 -0700
Cite this page as followsStatistical Computations at FreeStatistics.org, Office for Research Development and Education, URL https://freestatistics.org/blog/index.php?v=date/2007/Dec/20/t1198154577oi5a6cix5qnls03.htm/, Retrieved Mon, 29 Apr 2024 09:23:12 +0000
Statistical Computations at FreeStatistics.org, Office for Research Development and Education, URL https://freestatistics.org/blog/index.php?pk=4709, Retrieved Mon, 29 Apr 2024 09:23:12 +0000
QR Codes:

Original text written by user:
IsPrivate?No (this computation is public)
User-defined keywordsLise Swinnen
Estimated Impact222
Family? (F = Feedback message, R = changed R code, M = changed R Module, P = changed Parameters, D = changed Data)
-       [Notched Boxplots] [output PW arima r...] [2007-12-20 13:00:16] [a526d213baffe7453818dd375c9a7100] [Current]
Feedback Forum

Post a new message
Dataseries X:
150.790688775846 
-6258.83534189665 
1179.70002837875 
12383.4735350986 
6452.27270900916 
17925.4944763725 
9257.68433920925 
-11723.3498644816
9730.29130029668 
1936.54617702668 
-13491.8770530529 
-13575.4890229713 
16045.3501201983 
31348.045275449 
7731.3341195073 
22856.4486960203 
9073.2631337878 
9741.59405237557 
1332.23572230402 
-4628.33356110052 
-4607.73974806942 
10468.3136697059 
3481.88214736408 
25028.6738442344 
43679.0460797915 
3133.96300715266 
49119.3221578365 
-29338.6167794636 
-34798.4849473318 
-18302.9667882799 
-11186.9532031470 
-30966.7969435158 
7455.0861209843 
8399.08769635226 
-7128.66714707987 
-710.3526687469
38360.0693181986 
-86558.4287678845 
-14187.9571747546 
3452.42288668084 
-5961.29547826464 
10305.4208935305 
17920.5309412364 
1516.14971428292 
160300.016991544 
12283.5231099274 
-7608.94694452296 
-8111.9760189687 
-51104.480478478 
14051.3976851153 
-26934.501973342 
8297.05855141608 
7997.75560146061 
-11323.2347058055 
-29104.6052892639 
-8804.79506817229 
-36655.7461215054
-21480.2013942902 
22717.8851070332 
-49675.4810209872 
-43007.5042557363 
17078.2355867197 
-31075.4428611256 
20753.5566469650 
-866.61457864198 
12546.4353825002 
53033.941150139 
11101.0470118611 
-27479.2194387895 
-22585.9201086563 
17607.2507747408 
326551.315645887 
-14702.2973393577 
29501.4682467813 
30906.0918468706 
-11697.8693797096 
19443.5659647436 
9599.18339880255 
3414.58835532525 
24385.1665443376 
-55436.4896111982 
24357.0626776376 
9597.46988149706 
-71563.4063280716 
6914.44503835373 
12057.6240025949 
-8581.25723332376 
-23608.2928407493 
-30894.6657060471 
-6201.06970316944 
-18465.4746948189 
-18944.3321613762
16396.3058775606 
-545.771753456022 
-34797.1597979204 
-61904.9006746859 
-20410.1549297337 
9854.80042974788 
1357.59845540812 
-22560.9540910830 
-12724.6492980212 
1756.58704714364 
-7765.37726810927 
-10338.4454327962 
-19622.9718791054


Summary of compuational transaction
Raw Inputview raw input (R code)
Raw Outputview raw output of R engine
Computing time2 seconds
R Server'Herman Ole Andreas Wold' @ 193.190.124.10:1001

\begin{tabular}{lllllllll}
\hline
Summary of compuational transaction \tabularnewline
Raw Input & view raw input (R code)  \tabularnewline
Raw Output & view raw output of R engine  \tabularnewline
Computing time & 2 seconds \tabularnewline
R Server & 'Herman Ole Andreas Wold' @ 193.190.124.10:1001 \tabularnewline
\hline
\end{tabular}
%Source: https://freestatistics.org/blog/index.php?pk=4709&T=0

[TABLE]
[ROW][C]Summary of compuational transaction[/C][/ROW]
[ROW][C]Raw Input[/C][C]view raw input (R code) [/C][/ROW]
[ROW][C]Raw Output[/C][C]view raw output of R engine [/C][/ROW]
[ROW][C]Computing time[/C][C]2 seconds[/C][/ROW]
[ROW][C]R Server[/C][C]'Herman Ole Andreas Wold' @ 193.190.124.10:1001[/C][/ROW]
[/TABLE]
Source: https://freestatistics.org/blog/index.php?pk=4709&T=0

Globally Unique Identifier (entire table): ba.freestatistics.org/blog/index.php?pk=4709&T=0

As an alternative you can also use a QR Code:  

The GUIDs for individual cells are displayed in the table below:

Summary of compuational transaction
Raw Inputview raw input (R code)
Raw Outputview raw output of R engine
Computing time2 seconds
R Server'Herman Ole Andreas Wold' @ 193.190.124.10:1001


Boxplot statistics
Variablelower whiskerlower hingemedianupper hingeupper whisker
residuals-51104.480478478-14702.29733935771332.2357223040212057.624002594949119.3221578365

\begin{tabular}{lllllllll}
\hline
Boxplot statistics \tabularnewline
Variable & lower whisker & lower hinge & median & upper hinge & upper whisker \tabularnewline
residuals & -51104.480478478 & -14702.2973393577 & 1332.23572230402 & 12057.6240025949 & 49119.3221578365 \tabularnewline
\hline
\end{tabular}
%Source: https://freestatistics.org/blog/index.php?pk=4709&T=1

[TABLE]
[ROW][C]Boxplot statistics[/C][/ROW]
[ROW][C]Variable[/C][C]lower whisker[/C][C]lower hinge[/C][C]median[/C][C]upper hinge[/C][C]upper whisker[/C][/ROW]
[ROW][C]residuals[/C][C]-51104.480478478[/C][C]-14702.2973393577[/C][C]1332.23572230402[/C][C]12057.6240025949[/C][C]49119.3221578365[/C][/ROW]
[/TABLE]
Source: https://freestatistics.org/blog/index.php?pk=4709&T=1

Globally Unique Identifier (entire table): ba.freestatistics.org/blog/index.php?pk=4709&T=1

As an alternative you can also use a QR Code:  

The GUIDs for individual cells are displayed in the table below:

Boxplot statistics
Variablelower whiskerlower hingemedianupper hingeupper whisker
residuals-51104.480478478-14702.29733935771332.2357223040212057.624002594949119.3221578365


Boxplot Notches
Variablelower boundmedianupper bound
residuals-2793.935729669931332.235722304025458.40717427797

\begin{tabular}{lllllllll}
\hline
Boxplot Notches \tabularnewline
Variable & lower bound & median & upper bound \tabularnewline
residuals & -2793.93572966993 & 1332.23572230402 & 5458.40717427797 \tabularnewline
\hline
\end{tabular}
%Source: https://freestatistics.org/blog/index.php?pk=4709&T=2

[TABLE]
[ROW][C]Boxplot Notches[/C][/ROW]
[ROW][C]Variable[/C][C]lower bound[/C][C]median[/C][C]upper bound[/C][/ROW]
[ROW][C]residuals[/C][C]-2793.93572966993[/C][C]1332.23572230402[/C][C]5458.40717427797[/C][/ROW]
[/TABLE]
Source: https://freestatistics.org/blog/index.php?pk=4709&T=2

Globally Unique Identifier (entire table): ba.freestatistics.org/blog/index.php?pk=4709&T=2

As an alternative you can also use a QR Code:  

The GUIDs for individual cells are displayed in the table below:

Boxplot Notches
Variablelower boundmedianupper bound
residuals-2793.935729669931332.235722304025458.40717427797


Parameters (Session):
par1 = grey ;
Parameters (R input):
par1 = grey ;
R code (references can be found in the software module):
z <- as.data.frame(t(y))
bitmap(file='test1.png')
(r<-boxplot(z ,xlab=xlab,ylab=ylab,main=main,notch=TRUE,col=par1))
dev.off()
load(file='createtable')
a<-table.start()
a<-table.row.start(a)
a<-table.element(a,hyperlink('overview.htm','Boxplot statistics','Boxplot overview'),6,TRUE)
a<-table.row.end(a)
a<-table.row.start(a)
a<-table.element(a,'Variable',1,TRUE)
a<-table.element(a,hyperlink('lower_whisker.htm','lower whisker','definition of lower whisker'),1,TRUE)
a<-table.element(a,hyperlink('lower_hinge.htm','lower hinge','definition of lower hinge'),1,TRUE)
a<-table.element(a,hyperlink('central_tendency.htm','median','definitions about measures of central tendency'),1,TRUE)
a<-table.element(a,hyperlink('upper_hinge.htm','upper hinge','definition of upper hinge'),1,TRUE)
a<-table.element(a,hyperlink('upper_whisker.htm','upper whisker','definition of upper whisker'),1,TRUE)
a<-table.row.end(a)
for (i in 1:length(y[,1]))
{
a<-table.row.start(a)
a<-table.element(a,dimnames(t(x))[[2]][i],1,TRUE)
for (j in 1:5)
{
a<-table.element(a,r$stats[j,i])
}
a<-table.row.end(a)
}
a<-table.end(a)
table.save(a,file='mytable.tab')
a<-table.start()
a<-table.row.start(a)
a<-table.element(a,'Boxplot Notches',4,TRUE)
a<-table.row.end(a)
a<-table.row.start(a)
a<-table.element(a,'Variable',1,TRUE)
a<-table.element(a,'lower bound',1,TRUE)
a<-table.element(a,'median',1,TRUE)
a<-table.element(a,'upper bound',1,TRUE)
a<-table.row.end(a)
for (i in 1:length(y[,1]))
{
a<-table.row.start(a)
a<-table.element(a,dimnames(t(x))[[2]][i],1,TRUE)
a<-table.element(a,r$conf[1,i])
a<-table.element(a,r$stats[3,i])
a<-table.element(a,r$conf[2,i])
a<-table.row.end(a)
}
a<-table.end(a)
table.save(a,file='mytable1.tab')