Free Statistics

of Irreproducible Research!

Author's title

Author*Unverified author*
R Software Modulerwasp_autocorrelation.wasp
Title produced by software(Partial) Autocorrelation Function
Date of computationThu, 20 Dec 2007 05:48:10 -0700
Cite this page as followsStatistical Computations at FreeStatistics.org, Office for Research Development and Education, URL https://freestatistics.org/blog/index.php?v=date/2007/Dec/20/t1198154468soxigianqd8rhsu.htm/, Retrieved Mon, 29 Apr 2024 12:25:38 +0000
Statistical Computations at FreeStatistics.org, Office for Research Development and Education, URL https://freestatistics.org/blog/index.php?pk=4708, Retrieved Mon, 29 Apr 2024 12:25:38 +0000
QR Codes:

Original text written by user:
IsPrivate?No (this computation is public)
User-defined keywords
Estimated Impact220
Family? (F = Feedback message, R = changed R code, M = changed R Module, P = changed Parameters, D = changed Data)
-       [(Partial) Autocorrelation Function] [(P)ACF Omzet] [2007-12-20 12:48:10] [d41d8cd98f00b204e9800998ecf8427e] [Current]
Feedback Forum

Post a new message
Dataseries X:
104.2
103.2
112.7
106.4
102.6
110.6
95.2
89
112.5
116.8
107.2
113.6
101.8
102.6
122.7
110.3
110.5
121.6
100.3
100.7
123.4
127.1
124.1
131.2
111.6
114.2
130.1
125.9
119
133.8
107.5
113.5
134.4
126.8
135.6
139.9
129.8
131
153.1
134.1
144.1
155.9
123.3
128.1
144.3
153
149.9
150.9


Summary of compuational transaction
Raw Inputview raw input (R code)
Raw Outputview raw output of R engine
Computing time1 seconds
R Server'Gwilym Jenkins' @ 72.249.127.135

\begin{tabular}{lllllllll}
\hline
Summary of compuational transaction \tabularnewline
Raw Input & view raw input (R code)  \tabularnewline
Raw Output & view raw output of R engine  \tabularnewline
Computing time & 1 seconds \tabularnewline
R Server & 'Gwilym Jenkins' @ 72.249.127.135 \tabularnewline
\hline
\end{tabular}
%Source: https://freestatistics.org/blog/index.php?pk=4708&T=0

[TABLE]
[ROW][C]Summary of compuational transaction[/C][/ROW]
[ROW][C]Raw Input[/C][C]view raw input (R code) [/C][/ROW]
[ROW][C]Raw Output[/C][C]view raw output of R engine [/C][/ROW]
[ROW][C]Computing time[/C][C]1 seconds[/C][/ROW]
[ROW][C]R Server[/C][C]'Gwilym Jenkins' @ 72.249.127.135[/C][/ROW]
[/TABLE]
Source: https://freestatistics.org/blog/index.php?pk=4708&T=0

Globally Unique Identifier (entire table): ba.freestatistics.org/blog/index.php?pk=4708&T=0

As an alternative you can also use a QR Code:  

The GUIDs for individual cells are displayed in the table below:

Summary of compuational transaction
Raw Inputview raw input (R code)
Raw Outputview raw output of R engine
Computing time1 seconds
R Server'Gwilym Jenkins' @ 72.249.127.135


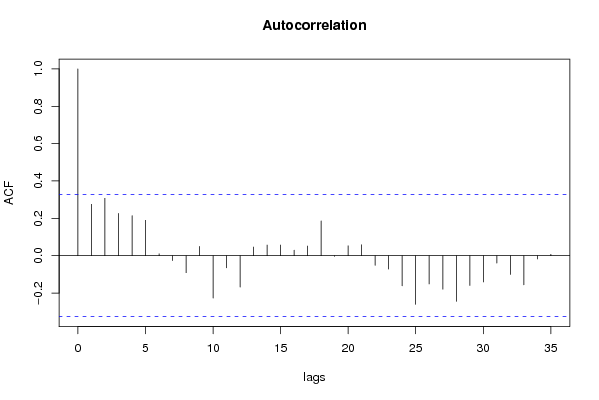
Autocorrelation Function
Time lag kACF(k)T-STATP-value
0160
10.2752371.65140.053676
20.3071131.84270.036812
30.2263261.3580.091465
40.2141651.2850.103502
50.1893781.13630.131676
60.010110.06070.475984
7-0.026013-0.15610.561579
8-0.091189-0.54710.706168
90.0492770.29570.384594
10-0.227197-1.36320.909355
11-0.065029-0.39020.650646
12-0.168287-1.00970.840317
130.0462680.27760.39145
140.056850.34110.367505
150.056780.34070.367662
160.0294640.17680.430334
170.0512660.30760.380081
180.1858631.11520.136082
19-0.003379-0.02030.508032
200.0526870.31610.376869
210.0580820.34850.36475
22-0.05154-0.30920.620538
23-0.072104-0.43260.666065
24-0.161644-0.96990.830707
25-0.260273-1.56160.936439
26-0.151352-0.90810.81507
27-0.179588-1.07750.855794
28-0.244311-1.46590.924317
29-0.159377-0.95630.827341
30-0.141-0.8460.79843
31-0.039686-0.23810.59343
32-0.100281-0.60170.724424
33-0.156184-0.93710.822526
34-0.017636-0.10580.541841
350.0072070.04320.482874

\begin{tabular}{lllllllll}
\hline
Autocorrelation Function \tabularnewline
Time lag k & ACF(k) & T-STAT & P-value \tabularnewline
0 & 1 & 6 & 0 \tabularnewline
1 & 0.275237 & 1.6514 & 0.053676 \tabularnewline
2 & 0.307113 & 1.8427 & 0.036812 \tabularnewline
3 & 0.226326 & 1.358 & 0.091465 \tabularnewline
4 & 0.214165 & 1.285 & 0.103502 \tabularnewline
5 & 0.189378 & 1.1363 & 0.131676 \tabularnewline
6 & 0.01011 & 0.0607 & 0.475984 \tabularnewline
7 & -0.026013 & -0.1561 & 0.561579 \tabularnewline
8 & -0.091189 & -0.5471 & 0.706168 \tabularnewline
9 & 0.049277 & 0.2957 & 0.384594 \tabularnewline
10 & -0.227197 & -1.3632 & 0.909355 \tabularnewline
11 & -0.065029 & -0.3902 & 0.650646 \tabularnewline
12 & -0.168287 & -1.0097 & 0.840317 \tabularnewline
13 & 0.046268 & 0.2776 & 0.39145 \tabularnewline
14 & 0.05685 & 0.3411 & 0.367505 \tabularnewline
15 & 0.05678 & 0.3407 & 0.367662 \tabularnewline
16 & 0.029464 & 0.1768 & 0.430334 \tabularnewline
17 & 0.051266 & 0.3076 & 0.380081 \tabularnewline
18 & 0.185863 & 1.1152 & 0.136082 \tabularnewline
19 & -0.003379 & -0.0203 & 0.508032 \tabularnewline
20 & 0.052687 & 0.3161 & 0.376869 \tabularnewline
21 & 0.058082 & 0.3485 & 0.36475 \tabularnewline
22 & -0.05154 & -0.3092 & 0.620538 \tabularnewline
23 & -0.072104 & -0.4326 & 0.666065 \tabularnewline
24 & -0.161644 & -0.9699 & 0.830707 \tabularnewline
25 & -0.260273 & -1.5616 & 0.936439 \tabularnewline
26 & -0.151352 & -0.9081 & 0.81507 \tabularnewline
27 & -0.179588 & -1.0775 & 0.855794 \tabularnewline
28 & -0.244311 & -1.4659 & 0.924317 \tabularnewline
29 & -0.159377 & -0.9563 & 0.827341 \tabularnewline
30 & -0.141 & -0.846 & 0.79843 \tabularnewline
31 & -0.039686 & -0.2381 & 0.59343 \tabularnewline
32 & -0.100281 & -0.6017 & 0.724424 \tabularnewline
33 & -0.156184 & -0.9371 & 0.822526 \tabularnewline
34 & -0.017636 & -0.1058 & 0.541841 \tabularnewline
35 & 0.007207 & 0.0432 & 0.482874 \tabularnewline
\hline
\end{tabular}
%Source: https://freestatistics.org/blog/index.php?pk=4708&T=1

[TABLE]
[ROW][C]Autocorrelation Function[/C][/ROW]
[ROW][C]Time lag k[/C][C]ACF(k)[/C][C]T-STAT[/C][C]P-value[/C][/ROW]
[ROW][C]0[/C][C]1[/C][C]6[/C][C]0[/C][/ROW]
[ROW][C]1[/C][C]0.275237[/C][C]1.6514[/C][C]0.053676[/C][/ROW]
[ROW][C]2[/C][C]0.307113[/C][C]1.8427[/C][C]0.036812[/C][/ROW]
[ROW][C]3[/C][C]0.226326[/C][C]1.358[/C][C]0.091465[/C][/ROW]
[ROW][C]4[/C][C]0.214165[/C][C]1.285[/C][C]0.103502[/C][/ROW]
[ROW][C]5[/C][C]0.189378[/C][C]1.1363[/C][C]0.131676[/C][/ROW]
[ROW][C]6[/C][C]0.01011[/C][C]0.0607[/C][C]0.475984[/C][/ROW]
[ROW][C]7[/C][C]-0.026013[/C][C]-0.1561[/C][C]0.561579[/C][/ROW]
[ROW][C]8[/C][C]-0.091189[/C][C]-0.5471[/C][C]0.706168[/C][/ROW]
[ROW][C]9[/C][C]0.049277[/C][C]0.2957[/C][C]0.384594[/C][/ROW]
[ROW][C]10[/C][C]-0.227197[/C][C]-1.3632[/C][C]0.909355[/C][/ROW]
[ROW][C]11[/C][C]-0.065029[/C][C]-0.3902[/C][C]0.650646[/C][/ROW]
[ROW][C]12[/C][C]-0.168287[/C][C]-1.0097[/C][C]0.840317[/C][/ROW]
[ROW][C]13[/C][C]0.046268[/C][C]0.2776[/C][C]0.39145[/C][/ROW]
[ROW][C]14[/C][C]0.05685[/C][C]0.3411[/C][C]0.367505[/C][/ROW]
[ROW][C]15[/C][C]0.05678[/C][C]0.3407[/C][C]0.367662[/C][/ROW]
[ROW][C]16[/C][C]0.029464[/C][C]0.1768[/C][C]0.430334[/C][/ROW]
[ROW][C]17[/C][C]0.051266[/C][C]0.3076[/C][C]0.380081[/C][/ROW]
[ROW][C]18[/C][C]0.185863[/C][C]1.1152[/C][C]0.136082[/C][/ROW]
[ROW][C]19[/C][C]-0.003379[/C][C]-0.0203[/C][C]0.508032[/C][/ROW]
[ROW][C]20[/C][C]0.052687[/C][C]0.3161[/C][C]0.376869[/C][/ROW]
[ROW][C]21[/C][C]0.058082[/C][C]0.3485[/C][C]0.36475[/C][/ROW]
[ROW][C]22[/C][C]-0.05154[/C][C]-0.3092[/C][C]0.620538[/C][/ROW]
[ROW][C]23[/C][C]-0.072104[/C][C]-0.4326[/C][C]0.666065[/C][/ROW]
[ROW][C]24[/C][C]-0.161644[/C][C]-0.9699[/C][C]0.830707[/C][/ROW]
[ROW][C]25[/C][C]-0.260273[/C][C]-1.5616[/C][C]0.936439[/C][/ROW]
[ROW][C]26[/C][C]-0.151352[/C][C]-0.9081[/C][C]0.81507[/C][/ROW]
[ROW][C]27[/C][C]-0.179588[/C][C]-1.0775[/C][C]0.855794[/C][/ROW]
[ROW][C]28[/C][C]-0.244311[/C][C]-1.4659[/C][C]0.924317[/C][/ROW]
[ROW][C]29[/C][C]-0.159377[/C][C]-0.9563[/C][C]0.827341[/C][/ROW]
[ROW][C]30[/C][C]-0.141[/C][C]-0.846[/C][C]0.79843[/C][/ROW]
[ROW][C]31[/C][C]-0.039686[/C][C]-0.2381[/C][C]0.59343[/C][/ROW]
[ROW][C]32[/C][C]-0.100281[/C][C]-0.6017[/C][C]0.724424[/C][/ROW]
[ROW][C]33[/C][C]-0.156184[/C][C]-0.9371[/C][C]0.822526[/C][/ROW]
[ROW][C]34[/C][C]-0.017636[/C][C]-0.1058[/C][C]0.541841[/C][/ROW]
[ROW][C]35[/C][C]0.007207[/C][C]0.0432[/C][C]0.482874[/C][/ROW]
[/TABLE]
Source: https://freestatistics.org/blog/index.php?pk=4708&T=1

Globally Unique Identifier (entire table): ba.freestatistics.org/blog/index.php?pk=4708&T=1

As an alternative you can also use a QR Code:  

The GUIDs for individual cells are displayed in the table below:

Autocorrelation Function
Time lag kACF(k)T-STATP-value
0160
10.2752371.65140.053676
20.3071131.84270.036812
30.2263261.3580.091465
40.2141651.2850.103502
50.1893781.13630.131676
60.010110.06070.475984
7-0.026013-0.15610.561579
8-0.091189-0.54710.706168
90.0492770.29570.384594
10-0.227197-1.36320.909355
11-0.065029-0.39020.650646
12-0.168287-1.00970.840317
130.0462680.27760.39145
140.056850.34110.367505
150.056780.34070.367662
160.0294640.17680.430334
170.0512660.30760.380081
180.1858631.11520.136082
19-0.003379-0.02030.508032
200.0526870.31610.376869
210.0580820.34850.36475
22-0.05154-0.30920.620538
23-0.072104-0.43260.666065
24-0.161644-0.96990.830707
25-0.260273-1.56160.936439
26-0.151352-0.90810.81507
27-0.179588-1.07750.855794
28-0.244311-1.46590.924317
29-0.159377-0.95630.827341
30-0.141-0.8460.79843
31-0.039686-0.23810.59343
32-0.100281-0.60170.724424
33-0.156184-0.93710.822526
34-0.017636-0.10580.541841
350.0072070.04320.482874


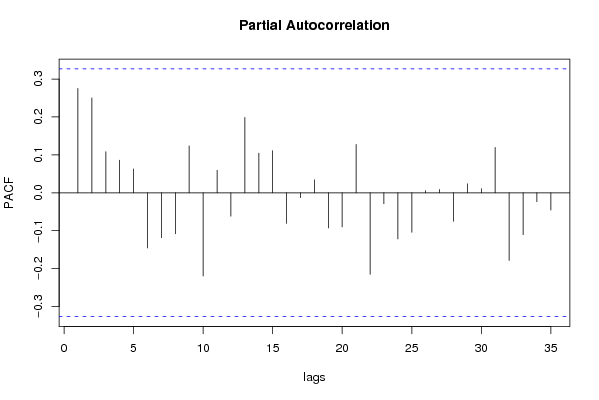
Partial Autocorrelation Function
Time lag kPACF(k)T-STATP-value
00.2752371.65140.053676
10.2503211.50190.070919
20.1085710.65140.259454
30.0861290.51680.304238
40.0630290.37820.353762
5-0.145314-0.87190.805474
6-0.118558-0.71130.759274
7-0.108129-0.64880.7397
80.1234580.74070.231826
9-0.219666-1.3180.902085
100.0594580.35670.361682
11-0.061648-0.36990.643183
120.1988681.19320.120296
130.1043350.6260.267628
140.1110740.66640.254689
15-0.080939-0.48560.684916
16-0.01279-0.07670.530371
170.0341730.2050.419349
18-0.092523-0.55510.708882
19-0.090102-0.54060.703948
200.1275370.76520.224564
21-0.214926-1.28960.897286
22-0.028686-0.17210.567845
23-0.121616-0.72970.764851
24-0.104231-0.62540.732169
250.0058090.03490.486195
260.0088310.0530.479018
27-0.075175-0.45110.672671
280.0237250.14230.443799
290.0108880.06530.474137
300.1195460.71730.238916
31-0.178246-1.06950.854013
32-0.110648-0.66390.744504
33-0.023479-0.14090.555623
34-0.045576-0.27350.606966
35NANANA

\begin{tabular}{lllllllll}
\hline
Partial Autocorrelation Function \tabularnewline
Time lag k & PACF(k) & T-STAT & P-value \tabularnewline
0 & 0.275237 & 1.6514 & 0.053676 \tabularnewline
1 & 0.250321 & 1.5019 & 0.070919 \tabularnewline
2 & 0.108571 & 0.6514 & 0.259454 \tabularnewline
3 & 0.086129 & 0.5168 & 0.304238 \tabularnewline
4 & 0.063029 & 0.3782 & 0.353762 \tabularnewline
5 & -0.145314 & -0.8719 & 0.805474 \tabularnewline
6 & -0.118558 & -0.7113 & 0.759274 \tabularnewline
7 & -0.108129 & -0.6488 & 0.7397 \tabularnewline
8 & 0.123458 & 0.7407 & 0.231826 \tabularnewline
9 & -0.219666 & -1.318 & 0.902085 \tabularnewline
10 & 0.059458 & 0.3567 & 0.361682 \tabularnewline
11 & -0.061648 & -0.3699 & 0.643183 \tabularnewline
12 & 0.198868 & 1.1932 & 0.120296 \tabularnewline
13 & 0.104335 & 0.626 & 0.267628 \tabularnewline
14 & 0.111074 & 0.6664 & 0.254689 \tabularnewline
15 & -0.080939 & -0.4856 & 0.684916 \tabularnewline
16 & -0.01279 & -0.0767 & 0.530371 \tabularnewline
17 & 0.034173 & 0.205 & 0.419349 \tabularnewline
18 & -0.092523 & -0.5551 & 0.708882 \tabularnewline
19 & -0.090102 & -0.5406 & 0.703948 \tabularnewline
20 & 0.127537 & 0.7652 & 0.224564 \tabularnewline
21 & -0.214926 & -1.2896 & 0.897286 \tabularnewline
22 & -0.028686 & -0.1721 & 0.567845 \tabularnewline
23 & -0.121616 & -0.7297 & 0.764851 \tabularnewline
24 & -0.104231 & -0.6254 & 0.732169 \tabularnewline
25 & 0.005809 & 0.0349 & 0.486195 \tabularnewline
26 & 0.008831 & 0.053 & 0.479018 \tabularnewline
27 & -0.075175 & -0.4511 & 0.672671 \tabularnewline
28 & 0.023725 & 0.1423 & 0.443799 \tabularnewline
29 & 0.010888 & 0.0653 & 0.474137 \tabularnewline
30 & 0.119546 & 0.7173 & 0.238916 \tabularnewline
31 & -0.178246 & -1.0695 & 0.854013 \tabularnewline
32 & -0.110648 & -0.6639 & 0.744504 \tabularnewline
33 & -0.023479 & -0.1409 & 0.555623 \tabularnewline
34 & -0.045576 & -0.2735 & 0.606966 \tabularnewline
35 & NA & NA & NA \tabularnewline
\hline
\end{tabular}
%Source: https://freestatistics.org/blog/index.php?pk=4708&T=2

[TABLE]
[ROW][C]Partial Autocorrelation Function[/C][/ROW]
[ROW][C]Time lag k[/C][C]PACF(k)[/C][C]T-STAT[/C][C]P-value[/C][/ROW]
[ROW][C]0[/C][C]0.275237[/C][C]1.6514[/C][C]0.053676[/C][/ROW]
[ROW][C]1[/C][C]0.250321[/C][C]1.5019[/C][C]0.070919[/C][/ROW]
[ROW][C]2[/C][C]0.108571[/C][C]0.6514[/C][C]0.259454[/C][/ROW]
[ROW][C]3[/C][C]0.086129[/C][C]0.5168[/C][C]0.304238[/C][/ROW]
[ROW][C]4[/C][C]0.063029[/C][C]0.3782[/C][C]0.353762[/C][/ROW]
[ROW][C]5[/C][C]-0.145314[/C][C]-0.8719[/C][C]0.805474[/C][/ROW]
[ROW][C]6[/C][C]-0.118558[/C][C]-0.7113[/C][C]0.759274[/C][/ROW]
[ROW][C]7[/C][C]-0.108129[/C][C]-0.6488[/C][C]0.7397[/C][/ROW]
[ROW][C]8[/C][C]0.123458[/C][C]0.7407[/C][C]0.231826[/C][/ROW]
[ROW][C]9[/C][C]-0.219666[/C][C]-1.318[/C][C]0.902085[/C][/ROW]
[ROW][C]10[/C][C]0.059458[/C][C]0.3567[/C][C]0.361682[/C][/ROW]
[ROW][C]11[/C][C]-0.061648[/C][C]-0.3699[/C][C]0.643183[/C][/ROW]
[ROW][C]12[/C][C]0.198868[/C][C]1.1932[/C][C]0.120296[/C][/ROW]
[ROW][C]13[/C][C]0.104335[/C][C]0.626[/C][C]0.267628[/C][/ROW]
[ROW][C]14[/C][C]0.111074[/C][C]0.6664[/C][C]0.254689[/C][/ROW]
[ROW][C]15[/C][C]-0.080939[/C][C]-0.4856[/C][C]0.684916[/C][/ROW]
[ROW][C]16[/C][C]-0.01279[/C][C]-0.0767[/C][C]0.530371[/C][/ROW]
[ROW][C]17[/C][C]0.034173[/C][C]0.205[/C][C]0.419349[/C][/ROW]
[ROW][C]18[/C][C]-0.092523[/C][C]-0.5551[/C][C]0.708882[/C][/ROW]
[ROW][C]19[/C][C]-0.090102[/C][C]-0.5406[/C][C]0.703948[/C][/ROW]
[ROW][C]20[/C][C]0.127537[/C][C]0.7652[/C][C]0.224564[/C][/ROW]
[ROW][C]21[/C][C]-0.214926[/C][C]-1.2896[/C][C]0.897286[/C][/ROW]
[ROW][C]22[/C][C]-0.028686[/C][C]-0.1721[/C][C]0.567845[/C][/ROW]
[ROW][C]23[/C][C]-0.121616[/C][C]-0.7297[/C][C]0.764851[/C][/ROW]
[ROW][C]24[/C][C]-0.104231[/C][C]-0.6254[/C][C]0.732169[/C][/ROW]
[ROW][C]25[/C][C]0.005809[/C][C]0.0349[/C][C]0.486195[/C][/ROW]
[ROW][C]26[/C][C]0.008831[/C][C]0.053[/C][C]0.479018[/C][/ROW]
[ROW][C]27[/C][C]-0.075175[/C][C]-0.4511[/C][C]0.672671[/C][/ROW]
[ROW][C]28[/C][C]0.023725[/C][C]0.1423[/C][C]0.443799[/C][/ROW]
[ROW][C]29[/C][C]0.010888[/C][C]0.0653[/C][C]0.474137[/C][/ROW]
[ROW][C]30[/C][C]0.119546[/C][C]0.7173[/C][C]0.238916[/C][/ROW]
[ROW][C]31[/C][C]-0.178246[/C][C]-1.0695[/C][C]0.854013[/C][/ROW]
[ROW][C]32[/C][C]-0.110648[/C][C]-0.6639[/C][C]0.744504[/C][/ROW]
[ROW][C]33[/C][C]-0.023479[/C][C]-0.1409[/C][C]0.555623[/C][/ROW]
[ROW][C]34[/C][C]-0.045576[/C][C]-0.2735[/C][C]0.606966[/C][/ROW]
[ROW][C]35[/C][C]NA[/C][C]NA[/C][C]NA[/C][/ROW]
[/TABLE]
Source: https://freestatistics.org/blog/index.php?pk=4708&T=2

Globally Unique Identifier (entire table): ba.freestatistics.org/blog/index.php?pk=4708&T=2

As an alternative you can also use a QR Code:  

The GUIDs for individual cells are displayed in the table below:

Partial Autocorrelation Function
Time lag kPACF(k)T-STATP-value
00.2752371.65140.053676
10.2503211.50190.070919
20.1085710.65140.259454
30.0861290.51680.304238
40.0630290.37820.353762
5-0.145314-0.87190.805474
6-0.118558-0.71130.759274
7-0.108129-0.64880.7397
80.1234580.74070.231826
9-0.219666-1.3180.902085
100.0594580.35670.361682
11-0.061648-0.36990.643183
120.1988681.19320.120296
130.1043350.6260.267628
140.1110740.66640.254689
15-0.080939-0.48560.684916
16-0.01279-0.07670.530371
170.0341730.2050.419349
18-0.092523-0.55510.708882
19-0.090102-0.54060.703948
200.1275370.76520.224564
21-0.214926-1.28960.897286
22-0.028686-0.17210.567845
23-0.121616-0.72970.764851
24-0.104231-0.62540.732169
250.0058090.03490.486195
260.0088310.0530.479018
27-0.075175-0.45110.672671
280.0237250.14230.443799
290.0108880.06530.474137
300.1195460.71730.238916
31-0.178246-1.06950.854013
32-0.110648-0.66390.744504
33-0.023479-0.14090.555623
34-0.045576-0.27350.606966
35NANANA


Parameters (Session):
par1 = 36 ; par2 = 1 ; par3 = 0 ; par4 = 1 ; par5 = 12 ;
Parameters (R input):
par1 = 36 ; par2 = 1 ; par3 = 0 ; par4 = 1 ; par5 = 12 ;
R code (references can be found in the software module):
if (par1 == 'Default') {
par1 = 10*log10(length(x))
} else {
par1 <- as.numeric(par1)
}
par2 <- as.numeric(par2)
par3 <- as.numeric(par3)
par4 <- as.numeric(par4)
par5 <- as.numeric(par5)
if (par2 == 0) {
x <- log(x)
} else {
x <- (x ^ par2 - 1) / par2
}
if (par3 > 0) x <- diff(x,lag=1,difference=par3)
if (par4 > 0) x <- diff(x,lag=par5,difference=par4)
bitmap(file='pic1.png')
racf <- acf(x,par1,main='Autocorrelation',xlab='lags',ylab='ACF')
dev.off()
bitmap(file='pic2.png')
rpacf <- pacf(x,par1,main='Partial Autocorrelation',xlab='lags',ylab='PACF')
dev.off()
(myacf <- c(racf$acf))
(mypacf <- c(rpacf$acf))
lengthx <- length(x)
sqrtn <- sqrt(lengthx)
load(file='createtable')
a<-table.start()
a<-table.row.start(a)
a<-table.element(a,'Autocorrelation Function',4,TRUE)
a<-table.row.end(a)
a<-table.row.start(a)
a<-table.element(a,'Time lag k',header=TRUE)
a<-table.element(a,hyperlink('basics.htm','ACF(k)','click here for more information about the Autocorrelation Function'),header=TRUE)
a<-table.element(a,'T-STAT',header=TRUE)
a<-table.element(a,'P-value',header=TRUE)
a<-table.row.end(a)
for (i in 1:par1) {
a<-table.row.start(a)
a<-table.element(a,i-1,header=TRUE)
a<-table.element(a,round(myacf[i],6))
mytstat <- myacf[i]*sqrtn
a<-table.element(a,round(mytstat,4))
a<-table.element(a,round(1-pt(mytstat,lengthx),6))
a<-table.row.end(a)
}
a<-table.end(a)
table.save(a,file='mytable.tab')
a<-table.start()
a<-table.row.start(a)
a<-table.element(a,'Partial Autocorrelation Function',4,TRUE)
a<-table.row.end(a)
a<-table.row.start(a)
a<-table.element(a,'Time lag k',header=TRUE)
a<-table.element(a,hyperlink('basics.htm','PACF(k)','click here for more information about the Partial Autocorrelation Function'),header=TRUE)
a<-table.element(a,'T-STAT',header=TRUE)
a<-table.element(a,'P-value',header=TRUE)
a<-table.row.end(a)
for (i in 1:par1) {
a<-table.row.start(a)
a<-table.element(a,i-1,header=TRUE)
a<-table.element(a,round(mypacf[i],6))
mytstat <- mypacf[i]*sqrtn
a<-table.element(a,round(mytstat,4))
a<-table.element(a,round(1-pt(mytstat,lengthx),6))
a<-table.row.end(a)
}
a<-table.end(a)
table.save(a,file='mytable1.tab')