Free Statistics

of Irreproducible Research!

Author's title

Author*Unverified author*
R Software Modulerwasp_multipleregression.wasp
Title produced by softwareMultiple Regression
Date of computationThu, 20 Dec 2007 04:45:11 -0700
Cite this page as followsStatistical Computations at FreeStatistics.org, Office for Research Development and Education, URL https://freestatistics.org/blog/index.php?v=date/2007/Dec/20/t1198150072qtz6fy3eas9bgsw.htm/, Retrieved Mon, 29 Apr 2024 09:38:48 +0000
Statistical Computations at FreeStatistics.org, Office for Research Development and Education, URL https://freestatistics.org/blog/index.php?pk=4707, Retrieved Mon, 29 Apr 2024 09:38:48 +0000
QR Codes:

Original text written by user:Zonder dummies/linear trend
IsPrivate?No (this computation is public)
User-defined keywords
Estimated Impact273
Family? (F = Feedback message, R = changed R code, M = changed R Module, P = changed Parameters, D = changed Data)
-       [Multiple Regression] [Multiple regression] [2007-12-20 11:45:11] [d41d8cd98f00b204e9800998ecf8427e] [Current]
- R  D    [Multiple Regression] [invoer - werkloos...] [2008-12-07 14:04:00] [5e74953d94072114d25d7276793b561e]
- R  D    [Multiple Regression] [invoer - werkloos...] [2008-12-07 14:17:08] [5e74953d94072114d25d7276793b561e]
- R PD    [Multiple Regression] [invoer - werkloos...] [2008-12-07 14:22:03] [5e74953d94072114d25d7276793b561e]
- R PD    [Multiple Regression] [invoer - werkloos...] [2008-12-07 14:27:22] [5e74953d94072114d25d7276793b561e]
Feedback Forum

Post a new message
Dataseries X:
104.2		106.8
103.2		114.3
112.7		105.7
106.4		90.1
102.6		91.6
110.6		97.7
95.2		100.8
89		104.6
112.5		95.9
116.8		102.7
107.2		104
113.6		107.9
101.8		113.8
102.6		113.8
122.7		123.1
110.3		125.1
110.5		137.6
121.6		134
100.3		140.3
100.7		152.1
123.4		150.6
127.1		167.3
124.1		153.2
131.2		142
111.6		154.4
114.2		158.5
130.1		180.9
125.9		181.3
119		172.4
133.8		192
107.5		199.3
113.5		215.4
134.4		214.3
126.8		201.5
135.6		190.5
139.9		196
129.8		215.7
131		209.4
153.1		214.1
134.1		237.8
144.1		239
155.9		237.8
123.3		251.5
128.1		248.8
144.3		215.4
153		201.2
149.9		203.1
150.9		214.2


Summary of compuational transaction
Raw Inputview raw input (R code)
Raw Outputview raw output of R engine
Computing time3 seconds
R Server'Gwilym Jenkins' @ 72.249.127.135

\begin{tabular}{lllllllll}
\hline
Summary of compuational transaction \tabularnewline
Raw Input & view raw input (R code)  \tabularnewline
Raw Output & view raw output of R engine  \tabularnewline
Computing time & 3 seconds \tabularnewline
R Server & 'Gwilym Jenkins' @ 72.249.127.135 \tabularnewline
\hline
\end{tabular}
%Source: https://freestatistics.org/blog/index.php?pk=4707&T=0

[TABLE]
[ROW][C]Summary of compuational transaction[/C][/ROW]
[ROW][C]Raw Input[/C][C]view raw input (R code) [/C][/ROW]
[ROW][C]Raw Output[/C][C]view raw output of R engine [/C][/ROW]
[ROW][C]Computing time[/C][C]3 seconds[/C][/ROW]
[ROW][C]R Server[/C][C]'Gwilym Jenkins' @ 72.249.127.135[/C][/ROW]
[/TABLE]
Source: https://freestatistics.org/blog/index.php?pk=4707&T=0

Globally Unique Identifier (entire table): ba.freestatistics.org/blog/index.php?pk=4707&T=0

As an alternative you can also use a QR Code:  

The GUIDs for individual cells are displayed in the table below:

Summary of compuational transaction
Raw Inputview raw input (R code)
Raw Outputview raw output of R engine
Computing time3 seconds
R Server'Gwilym Jenkins' @ 72.249.127.135


Multiple Linear Regression - Estimated Regression Equation
Omzet[t] = + 80.4015680238379 + 0.253318592602568Energie[t] + e[t]

\begin{tabular}{lllllllll}
\hline
Multiple Linear Regression - Estimated Regression Equation \tabularnewline
Omzet[t] =  +  80.4015680238379 +  0.253318592602568Energie[t]  + e[t] \tabularnewline
\hline
\end{tabular}
%Source: https://freestatistics.org/blog/index.php?pk=4707&T=1

[TABLE]
[ROW][C]Multiple Linear Regression - Estimated Regression Equation[/C][/ROW]
[ROW][C]Omzet[t] =  +  80.4015680238379 +  0.253318592602568Energie[t]  + e[t][/C][/ROW]
[/TABLE]
Source: https://freestatistics.org/blog/index.php?pk=4707&T=1

Globally Unique Identifier (entire table): ba.freestatistics.org/blog/index.php?pk=4707&T=1

As an alternative you can also use a QR Code:  

The GUIDs for individual cells are displayed in the table below:

Multiple Linear Regression - Estimated Regression Equation
Omzet[t] = + 80.4015680238379 + 0.253318592602568Energie[t] + e[t]


Multiple Linear Regression - Ordinary Least Squares
VariableParameterS.D.T-STATH0: parameter = 02-tail p-value1-tail p-value
(Intercept)80.40156802383795.58012614.408600
Energie0.2533185926025680.0327937.724700

\begin{tabular}{lllllllll}
\hline
Multiple Linear Regression - Ordinary Least Squares \tabularnewline
Variable & Parameter & S.D. & T-STATH0: parameter = 0 & 2-tail p-value & 1-tail p-value \tabularnewline
(Intercept) & 80.4015680238379 & 5.580126 & 14.4086 & 0 & 0 \tabularnewline
Energie & 0.253318592602568 & 0.032793 & 7.7247 & 0 & 0 \tabularnewline
\hline
\end{tabular}
%Source: https://freestatistics.org/blog/index.php?pk=4707&T=2

[TABLE]
[ROW][C]Multiple Linear Regression - Ordinary Least Squares[/C][/ROW]
[ROW][C]Variable[/C][C]Parameter[/C][C]S.D.[/C][C]T-STATH0: parameter = 0[/C][C]2-tail p-value[/C][C]1-tail p-value[/C][/ROW]
[ROW][C](Intercept)[/C][C]80.4015680238379[/C][C]5.580126[/C][C]14.4086[/C][C]0[/C][C]0[/C][/ROW]
[ROW][C]Energie[/C][C]0.253318592602568[/C][C]0.032793[/C][C]7.7247[/C][C]0[/C][C]0[/C][/ROW]
[/TABLE]
Source: https://freestatistics.org/blog/index.php?pk=4707&T=2

Globally Unique Identifier (entire table): ba.freestatistics.org/blog/index.php?pk=4707&T=2

As an alternative you can also use a QR Code:  

The GUIDs for individual cells are displayed in the table below:

Multiple Linear Regression - Ordinary Least Squares
VariableParameterS.D.T-STATH0: parameter = 02-tail p-value1-tail p-value
(Intercept)80.40156802383795.58012614.408600
Energie0.2533185926025680.0327937.724700


Multiple Linear Regression - Regression Statistics
Multiple R0.751454809580822
R-squared0.564684330842149
Adjusted R-squared0.555220946730022
F-TEST (value)59.6704439079582
F-TEST (DF numerator)1
F-TEST (DF denominator)46
p-value7.55215889824967e-10
Multiple Linear Regression - Residual Statistics
Residual Standard Deviation11.1671776047100
Sum Squared Residuals5736.46936013626

\begin{tabular}{lllllllll}
\hline
Multiple Linear Regression - Regression Statistics \tabularnewline
Multiple R & 0.751454809580822 \tabularnewline
R-squared & 0.564684330842149 \tabularnewline
Adjusted R-squared & 0.555220946730022 \tabularnewline
F-TEST (value) & 59.6704439079582 \tabularnewline
F-TEST (DF numerator) & 1 \tabularnewline
F-TEST (DF denominator) & 46 \tabularnewline
p-value & 7.55215889824967e-10 \tabularnewline
Multiple Linear Regression - Residual Statistics \tabularnewline
Residual Standard Deviation & 11.1671776047100 \tabularnewline
Sum Squared Residuals & 5736.46936013626 \tabularnewline
\hline
\end{tabular}
%Source: https://freestatistics.org/blog/index.php?pk=4707&T=3

[TABLE]
[ROW][C]Multiple Linear Regression - Regression Statistics[/C][/ROW]
[ROW][C]Multiple R[/C][C]0.751454809580822[/C][/ROW]
[ROW][C]R-squared[/C][C]0.564684330842149[/C][/ROW]
[ROW][C]Adjusted R-squared[/C][C]0.555220946730022[/C][/ROW]
[ROW][C]F-TEST (value)[/C][C]59.6704439079582[/C][/ROW]
[ROW][C]F-TEST (DF numerator)[/C][C]1[/C][/ROW]
[ROW][C]F-TEST (DF denominator)[/C][C]46[/C][/ROW]
[ROW][C]p-value[/C][C]7.55215889824967e-10[/C][/ROW]
[ROW][C]Multiple Linear Regression - Residual Statistics[/C][/ROW]
[ROW][C]Residual Standard Deviation[/C][C]11.1671776047100[/C][/ROW]
[ROW][C]Sum Squared Residuals[/C][C]5736.46936013626[/C][/ROW]
[/TABLE]
Source: https://freestatistics.org/blog/index.php?pk=4707&T=3

Globally Unique Identifier (entire table): ba.freestatistics.org/blog/index.php?pk=4707&T=3

As an alternative you can also use a QR Code:  

The GUIDs for individual cells are displayed in the table below:

Multiple Linear Regression - Regression Statistics
Multiple R0.751454809580822
R-squared0.564684330842149
Adjusted R-squared0.555220946730022
F-TEST (value)59.6704439079582
F-TEST (DF numerator)1
F-TEST (DF denominator)46
p-value7.55215889824967e-10
Multiple Linear Regression - Residual Statistics
Residual Standard Deviation11.1671776047100
Sum Squared Residuals5736.46936013626


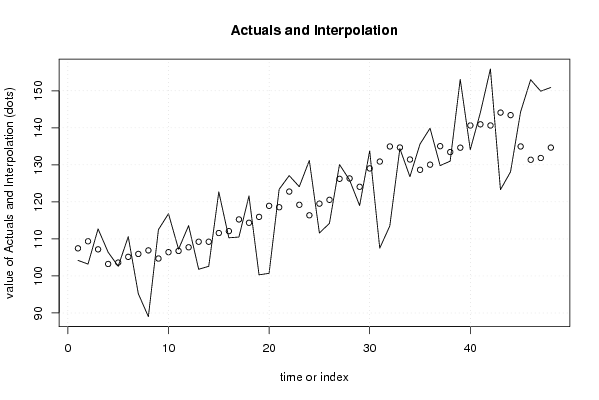
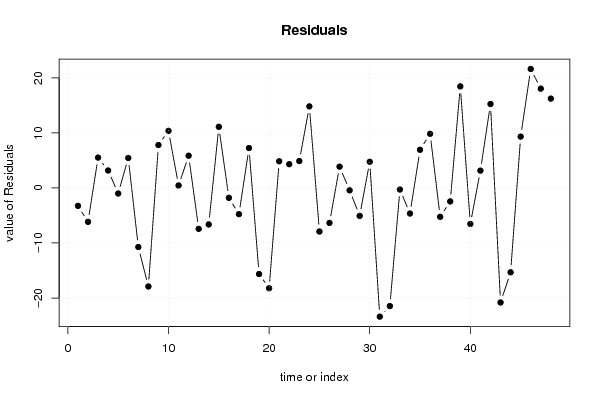
Multiple Linear Regression - Actuals, Interpolation, and Residuals
Time or IndexActualsInterpolationForecastResidualsPrediction Error
1104.2107.455993713792-3.2559937137919
2103.2109.355883158311-6.15588315831137
3112.7107.1773432619295.52265673807067
4106.4103.2255732173293.17442678267074
5102.6103.605551106233-1.00555110623313
6110.6105.1507945211095.4492054788912
795.2105.936082158177-10.7360821581767
889106.898692810067-17.8986928100665
9112.5104.6948210544247.80517894557583
10116.8106.41738748412210.3826125158784
11107.2106.7467016545050.453298345495033
12113.6107.7346441656555.86535583434501
13101.8109.229223862010-7.42922386201014
14102.6109.229223862010-6.62922386201014
15122.7111.58508677321411.1149132267860
16110.3112.091723958419-1.79172395841916
17110.5115.258206365951-4.75820636595126
18121.6114.3462594325827.25374056741798
19100.3115.942166565978-15.6421665659782
20100.7118.931325958689-18.2313259586885
21123.4118.5513480697854.84865193021536
22127.1122.7817685662484.31823143375245
23124.1119.2099764105514.89002358944867
24131.2116.37280817340314.8271918265974
25111.6119.513958721674-7.91395872167442
26114.2120.552564951345-6.35256495134494
27130.1126.2269014256423.87309857435752
28125.9126.328228862684-0.428228862683494
29119124.073693388521-5.07369338852064
30133.8129.0387378035314.76126219646904
31107.5130.887963529530-23.3879635295297
32113.5134.966392870431-21.4663928704311
33134.4134.687742418568-0.287742418568245
34126.8131.445264433255-4.64526443325538
35135.6128.6587599146276.94124008537287
36139.9130.0520121739419.84798782605876
37129.8135.042388448212-5.24238844821183
38131133.446481314816-2.44648131481567
39153.1134.63707870004818.4629212999523
40134.1140.640729344729-6.54072934472861
41144.1140.9447116558523.15528834414831
42155.9140.64072934472915.2592706552714
43123.3144.111194063384-20.8111940633838
44128.1143.427233863357-15.3272338633569
45144.3134.9663928704319.33360712956894
46153131.36926885547521.6307311445254
47149.9131.85057418141918.0494258185805
48150.9134.66241055930816.2375894406920

\begin{tabular}{lllllllll}
\hline
Multiple Linear Regression - Actuals, Interpolation, and Residuals \tabularnewline
Time or Index & Actuals & InterpolationForecast & ResidualsPrediction Error \tabularnewline
1 & 104.2 & 107.455993713792 & -3.2559937137919 \tabularnewline
2 & 103.2 & 109.355883158311 & -6.15588315831137 \tabularnewline
3 & 112.7 & 107.177343261929 & 5.52265673807067 \tabularnewline
4 & 106.4 & 103.225573217329 & 3.17442678267074 \tabularnewline
5 & 102.6 & 103.605551106233 & -1.00555110623313 \tabularnewline
6 & 110.6 & 105.150794521109 & 5.4492054788912 \tabularnewline
7 & 95.2 & 105.936082158177 & -10.7360821581767 \tabularnewline
8 & 89 & 106.898692810067 & -17.8986928100665 \tabularnewline
9 & 112.5 & 104.694821054424 & 7.80517894557583 \tabularnewline
10 & 116.8 & 106.417387484122 & 10.3826125158784 \tabularnewline
11 & 107.2 & 106.746701654505 & 0.453298345495033 \tabularnewline
12 & 113.6 & 107.734644165655 & 5.86535583434501 \tabularnewline
13 & 101.8 & 109.229223862010 & -7.42922386201014 \tabularnewline
14 & 102.6 & 109.229223862010 & -6.62922386201014 \tabularnewline
15 & 122.7 & 111.585086773214 & 11.1149132267860 \tabularnewline
16 & 110.3 & 112.091723958419 & -1.79172395841916 \tabularnewline
17 & 110.5 & 115.258206365951 & -4.75820636595126 \tabularnewline
18 & 121.6 & 114.346259432582 & 7.25374056741798 \tabularnewline
19 & 100.3 & 115.942166565978 & -15.6421665659782 \tabularnewline
20 & 100.7 & 118.931325958689 & -18.2313259586885 \tabularnewline
21 & 123.4 & 118.551348069785 & 4.84865193021536 \tabularnewline
22 & 127.1 & 122.781768566248 & 4.31823143375245 \tabularnewline
23 & 124.1 & 119.209976410551 & 4.89002358944867 \tabularnewline
24 & 131.2 & 116.372808173403 & 14.8271918265974 \tabularnewline
25 & 111.6 & 119.513958721674 & -7.91395872167442 \tabularnewline
26 & 114.2 & 120.552564951345 & -6.35256495134494 \tabularnewline
27 & 130.1 & 126.226901425642 & 3.87309857435752 \tabularnewline
28 & 125.9 & 126.328228862684 & -0.428228862683494 \tabularnewline
29 & 119 & 124.073693388521 & -5.07369338852064 \tabularnewline
30 & 133.8 & 129.038737803531 & 4.76126219646904 \tabularnewline
31 & 107.5 & 130.887963529530 & -23.3879635295297 \tabularnewline
32 & 113.5 & 134.966392870431 & -21.4663928704311 \tabularnewline
33 & 134.4 & 134.687742418568 & -0.287742418568245 \tabularnewline
34 & 126.8 & 131.445264433255 & -4.64526443325538 \tabularnewline
35 & 135.6 & 128.658759914627 & 6.94124008537287 \tabularnewline
36 & 139.9 & 130.052012173941 & 9.84798782605876 \tabularnewline
37 & 129.8 & 135.042388448212 & -5.24238844821183 \tabularnewline
38 & 131 & 133.446481314816 & -2.44648131481567 \tabularnewline
39 & 153.1 & 134.637078700048 & 18.4629212999523 \tabularnewline
40 & 134.1 & 140.640729344729 & -6.54072934472861 \tabularnewline
41 & 144.1 & 140.944711655852 & 3.15528834414831 \tabularnewline
42 & 155.9 & 140.640729344729 & 15.2592706552714 \tabularnewline
43 & 123.3 & 144.111194063384 & -20.8111940633838 \tabularnewline
44 & 128.1 & 143.427233863357 & -15.3272338633569 \tabularnewline
45 & 144.3 & 134.966392870431 & 9.33360712956894 \tabularnewline
46 & 153 & 131.369268855475 & 21.6307311445254 \tabularnewline
47 & 149.9 & 131.850574181419 & 18.0494258185805 \tabularnewline
48 & 150.9 & 134.662410559308 & 16.2375894406920 \tabularnewline
\hline
\end{tabular}
%Source: https://freestatistics.org/blog/index.php?pk=4707&T=4

[TABLE]
[ROW][C]Multiple Linear Regression - Actuals, Interpolation, and Residuals[/C][/ROW]
[ROW][C]Time or Index[/C][C]Actuals[/C][C]InterpolationForecast[/C][C]ResidualsPrediction Error[/C][/ROW]
[ROW][C]1[/C][C]104.2[/C][C]107.455993713792[/C][C]-3.2559937137919[/C][/ROW]
[ROW][C]2[/C][C]103.2[/C][C]109.355883158311[/C][C]-6.15588315831137[/C][/ROW]
[ROW][C]3[/C][C]112.7[/C][C]107.177343261929[/C][C]5.52265673807067[/C][/ROW]
[ROW][C]4[/C][C]106.4[/C][C]103.225573217329[/C][C]3.17442678267074[/C][/ROW]
[ROW][C]5[/C][C]102.6[/C][C]103.605551106233[/C][C]-1.00555110623313[/C][/ROW]
[ROW][C]6[/C][C]110.6[/C][C]105.150794521109[/C][C]5.4492054788912[/C][/ROW]
[ROW][C]7[/C][C]95.2[/C][C]105.936082158177[/C][C]-10.7360821581767[/C][/ROW]
[ROW][C]8[/C][C]89[/C][C]106.898692810067[/C][C]-17.8986928100665[/C][/ROW]
[ROW][C]9[/C][C]112.5[/C][C]104.694821054424[/C][C]7.80517894557583[/C][/ROW]
[ROW][C]10[/C][C]116.8[/C][C]106.417387484122[/C][C]10.3826125158784[/C][/ROW]
[ROW][C]11[/C][C]107.2[/C][C]106.746701654505[/C][C]0.453298345495033[/C][/ROW]
[ROW][C]12[/C][C]113.6[/C][C]107.734644165655[/C][C]5.86535583434501[/C][/ROW]
[ROW][C]13[/C][C]101.8[/C][C]109.229223862010[/C][C]-7.42922386201014[/C][/ROW]
[ROW][C]14[/C][C]102.6[/C][C]109.229223862010[/C][C]-6.62922386201014[/C][/ROW]
[ROW][C]15[/C][C]122.7[/C][C]111.585086773214[/C][C]11.1149132267860[/C][/ROW]
[ROW][C]16[/C][C]110.3[/C][C]112.091723958419[/C][C]-1.79172395841916[/C][/ROW]
[ROW][C]17[/C][C]110.5[/C][C]115.258206365951[/C][C]-4.75820636595126[/C][/ROW]
[ROW][C]18[/C][C]121.6[/C][C]114.346259432582[/C][C]7.25374056741798[/C][/ROW]
[ROW][C]19[/C][C]100.3[/C][C]115.942166565978[/C][C]-15.6421665659782[/C][/ROW]
[ROW][C]20[/C][C]100.7[/C][C]118.931325958689[/C][C]-18.2313259586885[/C][/ROW]
[ROW][C]21[/C][C]123.4[/C][C]118.551348069785[/C][C]4.84865193021536[/C][/ROW]
[ROW][C]22[/C][C]127.1[/C][C]122.781768566248[/C][C]4.31823143375245[/C][/ROW]
[ROW][C]23[/C][C]124.1[/C][C]119.209976410551[/C][C]4.89002358944867[/C][/ROW]
[ROW][C]24[/C][C]131.2[/C][C]116.372808173403[/C][C]14.8271918265974[/C][/ROW]
[ROW][C]25[/C][C]111.6[/C][C]119.513958721674[/C][C]-7.91395872167442[/C][/ROW]
[ROW][C]26[/C][C]114.2[/C][C]120.552564951345[/C][C]-6.35256495134494[/C][/ROW]
[ROW][C]27[/C][C]130.1[/C][C]126.226901425642[/C][C]3.87309857435752[/C][/ROW]
[ROW][C]28[/C][C]125.9[/C][C]126.328228862684[/C][C]-0.428228862683494[/C][/ROW]
[ROW][C]29[/C][C]119[/C][C]124.073693388521[/C][C]-5.07369338852064[/C][/ROW]
[ROW][C]30[/C][C]133.8[/C][C]129.038737803531[/C][C]4.76126219646904[/C][/ROW]
[ROW][C]31[/C][C]107.5[/C][C]130.887963529530[/C][C]-23.3879635295297[/C][/ROW]
[ROW][C]32[/C][C]113.5[/C][C]134.966392870431[/C][C]-21.4663928704311[/C][/ROW]
[ROW][C]33[/C][C]134.4[/C][C]134.687742418568[/C][C]-0.287742418568245[/C][/ROW]
[ROW][C]34[/C][C]126.8[/C][C]131.445264433255[/C][C]-4.64526443325538[/C][/ROW]
[ROW][C]35[/C][C]135.6[/C][C]128.658759914627[/C][C]6.94124008537287[/C][/ROW]
[ROW][C]36[/C][C]139.9[/C][C]130.052012173941[/C][C]9.84798782605876[/C][/ROW]
[ROW][C]37[/C][C]129.8[/C][C]135.042388448212[/C][C]-5.24238844821183[/C][/ROW]
[ROW][C]38[/C][C]131[/C][C]133.446481314816[/C][C]-2.44648131481567[/C][/ROW]
[ROW][C]39[/C][C]153.1[/C][C]134.637078700048[/C][C]18.4629212999523[/C][/ROW]
[ROW][C]40[/C][C]134.1[/C][C]140.640729344729[/C][C]-6.54072934472861[/C][/ROW]
[ROW][C]41[/C][C]144.1[/C][C]140.944711655852[/C][C]3.15528834414831[/C][/ROW]
[ROW][C]42[/C][C]155.9[/C][C]140.640729344729[/C][C]15.2592706552714[/C][/ROW]
[ROW][C]43[/C][C]123.3[/C][C]144.111194063384[/C][C]-20.8111940633838[/C][/ROW]
[ROW][C]44[/C][C]128.1[/C][C]143.427233863357[/C][C]-15.3272338633569[/C][/ROW]
[ROW][C]45[/C][C]144.3[/C][C]134.966392870431[/C][C]9.33360712956894[/C][/ROW]
[ROW][C]46[/C][C]153[/C][C]131.369268855475[/C][C]21.6307311445254[/C][/ROW]
[ROW][C]47[/C][C]149.9[/C][C]131.850574181419[/C][C]18.0494258185805[/C][/ROW]
[ROW][C]48[/C][C]150.9[/C][C]134.662410559308[/C][C]16.2375894406920[/C][/ROW]
[/TABLE]
Source: https://freestatistics.org/blog/index.php?pk=4707&T=4

Globally Unique Identifier (entire table): ba.freestatistics.org/blog/index.php?pk=4707&T=4

As an alternative you can also use a QR Code:  

The GUIDs for individual cells are displayed in the table below:

Multiple Linear Regression - Actuals, Interpolation, and Residuals
Time or IndexActualsInterpolationForecastResidualsPrediction Error
1104.2107.455993713792-3.2559937137919
2103.2109.355883158311-6.15588315831137
3112.7107.1773432619295.52265673807067
4106.4103.2255732173293.17442678267074
5102.6103.605551106233-1.00555110623313
6110.6105.1507945211095.4492054788912
795.2105.936082158177-10.7360821581767
889106.898692810067-17.8986928100665
9112.5104.6948210544247.80517894557583
10116.8106.41738748412210.3826125158784
11107.2106.7467016545050.453298345495033
12113.6107.7346441656555.86535583434501
13101.8109.229223862010-7.42922386201014
14102.6109.229223862010-6.62922386201014
15122.7111.58508677321411.1149132267860
16110.3112.091723958419-1.79172395841916
17110.5115.258206365951-4.75820636595126
18121.6114.3462594325827.25374056741798
19100.3115.942166565978-15.6421665659782
20100.7118.931325958689-18.2313259586885
21123.4118.5513480697854.84865193021536
22127.1122.7817685662484.31823143375245
23124.1119.2099764105514.89002358944867
24131.2116.37280817340314.8271918265974
25111.6119.513958721674-7.91395872167442
26114.2120.552564951345-6.35256495134494
27130.1126.2269014256423.87309857435752
28125.9126.328228862684-0.428228862683494
29119124.073693388521-5.07369338852064
30133.8129.0387378035314.76126219646904
31107.5130.887963529530-23.3879635295297
32113.5134.966392870431-21.4663928704311
33134.4134.687742418568-0.287742418568245
34126.8131.445264433255-4.64526443325538
35135.6128.6587599146276.94124008537287
36139.9130.0520121739419.84798782605876
37129.8135.042388448212-5.24238844821183
38131133.446481314816-2.44648131481567
39153.1134.63707870004818.4629212999523
40134.1140.640729344729-6.54072934472861
41144.1140.9447116558523.15528834414831
42155.9140.64072934472915.2592706552714
43123.3144.111194063384-20.8111940633838
44128.1143.427233863357-15.3272338633569
45144.3134.9663928704319.33360712956894
46153131.36926885547521.6307311445254
47149.9131.85057418141918.0494258185805
48150.9134.66241055930816.2375894406920


Parameters (Session):
par1 = 1 ; par2 = Do not include Seasonal Dummies ; par3 = No Linear Trend ;
Parameters (R input):
par1 = 1 ; par2 = Do not include Seasonal Dummies ; par3 = No Linear Trend ;
R code (references can be found in the software module):
library(lattice)
par1 <- as.numeric(par1)
x <- t(y)
k <- length(x[1,])
n <- length(x[,1])
x1 <- cbind(x[,par1], x[,1:k!=par1])
mycolnames <- c(colnames(x)[par1], colnames(x)[1:k!=par1])
colnames(x1) <- mycolnames #colnames(x)[par1]
x <- x1
if (par3 == 'First Differences'){
x2 <- array(0, dim=c(n-1,k), dimnames=list(1:(n-1), paste('(1-B)',colnames(x),sep='')))
for (i in 1:n-1) {
for (j in 1:k) {
x2[i,j] <- x[i+1,j] - x[i,j]
}
}
x <- x2
}
if (par2 == 'Include Monthly Dummies'){
x2 <- array(0, dim=c(n,11), dimnames=list(1:n, paste('M', seq(1:11), sep ='')))
for (i in 1:11){
x2[seq(i,n,12),i] <- 1
}
x <- cbind(x, x2)
}
if (par2 == 'Include Quarterly Dummies'){
x2 <- array(0, dim=c(n,3), dimnames=list(1:n, paste('Q', seq(1:3), sep ='')))
for (i in 1:3){
x2[seq(i,n,4),i] <- 1
}
x <- cbind(x, x2)
}
k <- length(x[1,])
if (par3 == 'Linear Trend'){
x <- cbind(x, c(1:n))
colnames(x)[k+1] <- 't'
}
x
k <- length(x[1,])
df <- as.data.frame(x)
(mylm <- lm(df))
(mysum <- summary(mylm))
bitmap(file='test0.png')
plot(x[,1], type='l', main='Actuals and Interpolation', ylab='value of Actuals and Interpolation (dots)', xlab='time or index')
points(x[,1]-mysum$resid)
grid()
dev.off()
bitmap(file='test1.png')
plot(mysum$resid, type='b', pch=19, main='Residuals', ylab='value of Residuals', xlab='time or index')
grid()
dev.off()
bitmap(file='test2.png')
hist(mysum$resid, main='Residual Histogram', xlab='values of Residuals')
grid()
dev.off()
bitmap(file='test3.png')
densityplot(~mysum$resid,col='black',main='Residual Density Plot', xlab='values of Residuals')
dev.off()
bitmap(file='test4.png')
qqnorm(mysum$resid, main='Residual Normal Q-Q Plot')
grid()
dev.off()
(myerror <- as.ts(mysum$resid))
bitmap(file='test5.png')
dum <- cbind(lag(myerror,k=1),myerror)
dum
dum1 <- dum[2:length(myerror),]
dum1
z <- as.data.frame(dum1)
z
plot(z,main=paste('Residual Lag plot, lowess, and regression line'), ylab='values of Residuals', xlab='lagged values of Residuals')
lines(lowess(z))
abline(lm(z))
grid()
dev.off()
bitmap(file='test6.png')
acf(mysum$resid, lag.max=length(mysum$resid)/2, main='Residual Autocorrelation Function')
grid()
dev.off()
bitmap(file='test7.png')
pacf(mysum$resid, lag.max=length(mysum$resid)/2, main='Residual Partial Autocorrelation Function')
grid()
dev.off()
bitmap(file='test8.png')
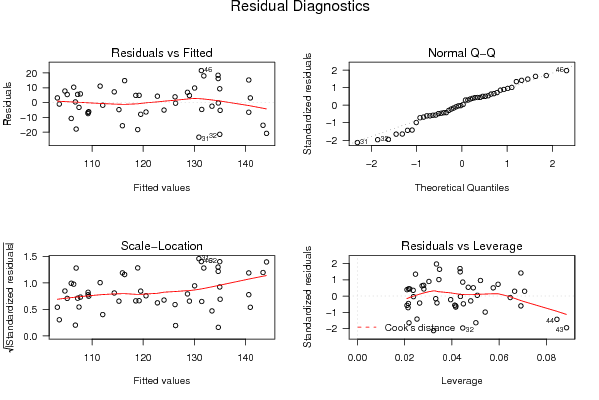
opar <- par(mfrow = c(2,2), oma = c(0, 0, 1.1, 0))
plot(mylm, las = 1, sub='Residual Diagnostics')
par(opar)
dev.off()
load(file='createtable')
a<-table.start()
a<-table.row.start(a)
a<-table.element(a, 'Multiple Linear Regression - Estimated Regression Equation', 1, TRUE)
a<-table.row.end(a)
myeq <- colnames(x)[1]
myeq <- paste(myeq, '[t] = ', sep='')
for (i in 1:k){
if (mysum$coefficients[i,1] > 0) myeq <- paste(myeq, '+', '')
myeq <- paste(myeq, mysum$coefficients[i,1], sep=' ')
if (rownames(mysum$coefficients)[i] != '(Intercept)') {
myeq <- paste(myeq, rownames(mysum$coefficients)[i], sep='')
if (rownames(mysum$coefficients)[i] != 't') myeq <- paste(myeq, '[t]', sep='')
}
}
myeq <- paste(myeq, ' + e[t]')
a<-table.row.start(a)
a<-table.element(a, myeq)
a<-table.row.end(a)
a<-table.end(a)
table.save(a,file='mytable1.tab')
a<-table.start()
a<-table.row.start(a)
a<-table.element(a,hyperlink('ols1.htm','Multiple Linear Regression - Ordinary Least Squares',''), 6, TRUE)
a<-table.row.end(a)
a<-table.row.start(a)
a<-table.element(a,'Variable',header=TRUE)
a<-table.element(a,'Parameter',header=TRUE)
a<-table.element(a,'S.D.',header=TRUE)
a<-table.element(a,'T-STAT
H0: parameter = 0',header=TRUE)
a<-table.element(a,'2-tail p-value',header=TRUE)
a<-table.element(a,'1-tail p-value',header=TRUE)
a<-table.row.end(a)
for (i in 1:k){
a<-table.row.start(a)
a<-table.element(a,rownames(mysum$coefficients)[i],header=TRUE)
a<-table.element(a,mysum$coefficients[i,1])
a<-table.element(a, round(mysum$coefficients[i,2],6))
a<-table.element(a, round(mysum$coefficients[i,3],4))
a<-table.element(a, round(mysum$coefficients[i,4],6))
a<-table.element(a, round(mysum$coefficients[i,4]/2,6))
a<-table.row.end(a)
}
a<-table.end(a)
table.save(a,file='mytable2.tab')
a<-table.start()
a<-table.row.start(a)
a<-table.element(a, 'Multiple Linear Regression - Regression Statistics', 2, TRUE)
a<-table.row.end(a)
a<-table.row.start(a)
a<-table.element(a, 'Multiple R',1,TRUE)
a<-table.element(a, sqrt(mysum$r.squared))
a<-table.row.end(a)
a<-table.row.start(a)
a<-table.element(a, 'R-squared',1,TRUE)
a<-table.element(a, mysum$r.squared)
a<-table.row.end(a)
a<-table.row.start(a)
a<-table.element(a, 'Adjusted R-squared',1,TRUE)
a<-table.element(a, mysum$adj.r.squared)
a<-table.row.end(a)
a<-table.row.start(a)
a<-table.element(a, 'F-TEST (value)',1,TRUE)
a<-table.element(a, mysum$fstatistic[1])
a<-table.row.end(a)
a<-table.row.start(a)
a<-table.element(a, 'F-TEST (DF numerator)',1,TRUE)
a<-table.element(a, mysum$fstatistic[2])
a<-table.row.end(a)
a<-table.row.start(a)
a<-table.element(a, 'F-TEST (DF denominator)',1,TRUE)
a<-table.element(a, mysum$fstatistic[3])
a<-table.row.end(a)
a<-table.row.start(a)
a<-table.element(a, 'p-value',1,TRUE)
a<-table.element(a, 1-pf(mysum$fstatistic[1],mysum$fstatistic[2],mysum$fstatistic[3]))
a<-table.row.end(a)
a<-table.row.start(a)
a<-table.element(a, 'Multiple Linear Regression - Residual Statistics', 2, TRUE)
a<-table.row.end(a)
a<-table.row.start(a)
a<-table.element(a, 'Residual Standard Deviation',1,TRUE)
a<-table.element(a, mysum$sigma)
a<-table.row.end(a)
a<-table.row.start(a)
a<-table.element(a, 'Sum Squared Residuals',1,TRUE)
a<-table.element(a, sum(myerror*myerror))
a<-table.row.end(a)
a<-table.end(a)
table.save(a,file='mytable3.tab')
a<-table.start()
a<-table.row.start(a)
a<-table.element(a, 'Multiple Linear Regression - Actuals, Interpolation, and Residuals', 4, TRUE)
a<-table.row.end(a)
a<-table.row.start(a)
a<-table.element(a, 'Time or Index', 1, TRUE)
a<-table.element(a, 'Actuals', 1, TRUE)
a<-table.element(a, 'Interpolation
Forecast', 1, TRUE)
a<-table.element(a, 'Residuals
Prediction Error', 1, TRUE)
a<-table.row.end(a)
for (i in 1:n) {
a<-table.row.start(a)
a<-table.element(a,i, 1, TRUE)
a<-table.element(a,x[i])
a<-table.element(a,x[i]-mysum$resid[i])
a<-table.element(a,mysum$resid[i])
a<-table.row.end(a)
}
a<-table.end(a)
table.save(a,file='mytable4.tab')