Free Statistics

of Irreproducible Research!

Author's title

Author*Unverified author*
R Software Modulerwasp_edauni.wasp
Title produced by softwareUnivariate Explorative Data Analysis
Date of computationWed, 19 Dec 2007 10:44:49 -0700
Cite this page as followsStatistical Computations at FreeStatistics.org, Office for Research Development and Education, URL https://freestatistics.org/blog/index.php?v=date/2007/Dec/19/t1198085248jqwi45187qxrkdy.htm/, Retrieved Tue, 07 May 2024 00:52:24 +0000
Statistical Computations at FreeStatistics.org, Office for Research Development and Education, URL https://freestatistics.org/blog/index.php?pk=4692, Retrieved Tue, 07 May 2024 00:52:24 +0000
QR Codes:

Original text written by user:
IsPrivate?No (this computation is public)
User-defined keywords
Estimated Impact221
Family? (F = Feedback message, R = changed R code, M = changed R Module, P = changed Parameters, D = changed Data)
-       [Univariate Explorative Data Analysis] [paper run sequenc...] [2007-12-19 17:44:49] [d41d8cd98f00b204e9800998ecf8427e] [Current]
Feedback Forum

Post a new message
Dataseries X:
0.0941985320320626

0.653503812757776

-1.53391896500750

-3.36057793208943

10.5123096036122

-1.01581457573704

-2.67820603570839

-9.74826523524703

3.63711950635251

9.50223910169676

-0.328071065750664

-0.99090283824161

3.15955488055449

4.274504946209

-2.96994671532128

-7.49489553709745

0.326324458907605

-2.56567975939718

4.06810804201443

5.30985531157956

-8.08565126748348

5.28645116189662

7.37889520393211

-6.11905687839581

-3.37762220941437

-8.60601896334157

2.58282247115929

10.0203248408892

7.07928930610679

-2.75364586230294

3.41775084223743

-1.59740992982799

0.64919709507294

2.86097471341661

-3.51941245730982

5.64985077275929

4.3083362367212

-4.39107605256271

-5.85155663863847

-5.47131236424465

-2.29984941727564

-0.144024631394743

8.08067861936608

-7.42975884662829

0.0227113802409349

-2.47026516439664

-2.11466659014063

7.8747637202872

4.65851639094002

3.60426918741376

-3.64324288209951

7.25784133565925

-7.62087973892363

13.8299693619635

1.28408834041515

-0.320572241143239

-2.89707141277690

4.92335970737777

11.9868131228538

10.0627280987577

-2.21884745321978

3.97445806945834

0.560126237823582

3.34160376915877

-2.85636766640084

4.38042429228536

1.43160354600064

-0.489188992828318

-1.23442104165709


Summary of compuational transaction
Raw Inputview raw input (R code)
Raw Outputview raw output of R engine
Computing time3 seconds
R Server'Herman Ole Andreas Wold' @ 193.190.124.10:1001

\begin{tabular}{lllllllll}
\hline
Summary of compuational transaction \tabularnewline
Raw Input & view raw input (R code)  \tabularnewline
Raw Output & view raw output of R engine  \tabularnewline
Computing time & 3 seconds \tabularnewline
R Server & 'Herman Ole Andreas Wold' @ 193.190.124.10:1001 \tabularnewline
\hline
\end{tabular}
%Source: https://freestatistics.org/blog/index.php?pk=4692&T=0

[TABLE]
[ROW][C]Summary of compuational transaction[/C][/ROW]
[ROW][C]Raw Input[/C][C]view raw input (R code) [/C][/ROW]
[ROW][C]Raw Output[/C][C]view raw output of R engine [/C][/ROW]
[ROW][C]Computing time[/C][C]3 seconds[/C][/ROW]
[ROW][C]R Server[/C][C]'Herman Ole Andreas Wold' @ 193.190.124.10:1001[/C][/ROW]
[/TABLE]
Source: https://freestatistics.org/blog/index.php?pk=4692&T=0

Globally Unique Identifier (entire table): ba.freestatistics.org/blog/index.php?pk=4692&T=0

As an alternative you can also use a QR Code:  

The GUIDs for individual cells are displayed in the table below:

Summary of compuational transaction
Raw Inputview raw input (R code)
Raw Outputview raw output of R engine
Computing time3 seconds
R Server'Herman Ole Andreas Wold' @ 193.190.124.10:1001


Descriptive Statistics
# observations69
minimum-9.74826523524703
Q1-2.75364586230294
median0.0941985320320626
mean0.867353168955146
Q34.3083362367212
maximum13.8299693619635

\begin{tabular}{lllllllll}
\hline
Descriptive Statistics \tabularnewline
# observations & 69 \tabularnewline
minimum & -9.74826523524703 \tabularnewline
Q1 & -2.75364586230294 \tabularnewline
median & 0.0941985320320626 \tabularnewline
mean & 0.867353168955146 \tabularnewline
Q3 & 4.3083362367212 \tabularnewline
maximum & 13.8299693619635 \tabularnewline
\hline
\end{tabular}
%Source: https://freestatistics.org/blog/index.php?pk=4692&T=1

[TABLE]
[ROW][C]Descriptive Statistics[/C][/ROW]
[ROW][C]# observations[/C][C]69[/C][/ROW]
[ROW][C]minimum[/C][C]-9.74826523524703[/C][/ROW]
[ROW][C]Q1[/C][C]-2.75364586230294[/C][/ROW]
[ROW][C]median[/C][C]0.0941985320320626[/C][/ROW]
[ROW][C]mean[/C][C]0.867353168955146[/C][/ROW]
[ROW][C]Q3[/C][C]4.3083362367212[/C][/ROW]
[ROW][C]maximum[/C][C]13.8299693619635[/C][/ROW]
[/TABLE]
Source: https://freestatistics.org/blog/index.php?pk=4692&T=1

Globally Unique Identifier (entire table): ba.freestatistics.org/blog/index.php?pk=4692&T=1

As an alternative you can also use a QR Code:  

The GUIDs for individual cells are displayed in the table below:

Descriptive Statistics
# observations69
minimum-9.74826523524703
Q1-2.75364586230294
median0.0941985320320626
mean0.867353168955146
Q34.3083362367212
maximum13.8299693619635


Parameters (Session):
par1 = 0 ; par2 = 0 ;
Parameters (R input):
par1 = 0 ; par2 = 0 ;
R code (references can be found in the software module):
par1 <- as.numeric(par1)
par2 <- as.numeric(par2)
x <- as.ts(x)
library(lattice)
bitmap(file='pic1.png')
plot(x,type='l',main='Run Sequence Plot',xlab='time or index',ylab='value')
grid()
dev.off()
bitmap(file='pic2.png')
hist(x)
grid()
dev.off()
bitmap(file='pic3.png')
if (par1 > 0)
{
densityplot(~x,col='black',main=paste('Density Plot bw = ',par1),bw=par1)
} else {
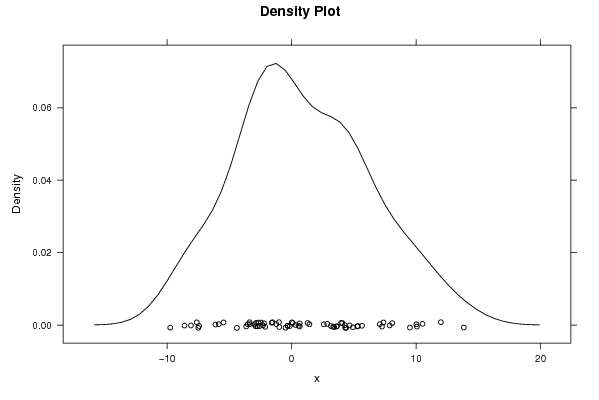
densityplot(~x,col='black',main='Density Plot')
}
dev.off()
bitmap(file='pic4.png')
qqnorm(x)
grid()
dev.off()
if (par2 > 0)
{
bitmap(file='lagplot.png')
dum <- cbind(lag(x,k=1),x)
dum
dum1 <- dum[2:length(x),]
dum1
z <- as.data.frame(dum1)
z
plot(z,main=paste('Lag plot, lowess, and regression line'))
lines(lowess(z))
abline(lm(z))
dev.off()
bitmap(file='pic5.png')
acf(x,lag.max=par2,main='Autocorrelation Function')
grid()
dev.off()
}
summary(x)
load(file='createtable')
a<-table.start()
a<-table.row.start(a)
a<-table.element(a,'Descriptive Statistics',2,TRUE)
a<-table.row.end(a)
a<-table.row.start(a)
a<-table.element(a,'# observations',header=TRUE)
a<-table.element(a,length(x))
a<-table.row.end(a)
a<-table.row.start(a)
a<-table.element(a,'minimum',header=TRUE)
a<-table.element(a,min(x))
a<-table.row.end(a)
a<-table.row.start(a)
a<-table.element(a,'Q1',header=TRUE)
a<-table.element(a,quantile(x,0.25))
a<-table.row.end(a)
a<-table.row.start(a)
a<-table.element(a,'median',header=TRUE)
a<-table.element(a,median(x))
a<-table.row.end(a)
a<-table.row.start(a)
a<-table.element(a,'mean',header=TRUE)
a<-table.element(a,mean(x))
a<-table.row.end(a)
a<-table.row.start(a)
a<-table.element(a,'Q3',header=TRUE)
a<-table.element(a,quantile(x,0.75))
a<-table.row.end(a)
a<-table.row.start(a)
a<-table.element(a,'maximum',header=TRUE)
a<-table.element(a,max(x))
a<-table.row.end(a)
a<-table.end(a)
table.save(a,file='mytable.tab')