Free Statistics
of Irreproducible Research!
Description of Statistical Computation | |||||||||||||||||||||||||||||||||||||||||||||||||||||||||||||||||||||
|---|---|---|---|---|---|---|---|---|---|---|---|---|---|---|---|---|---|---|---|---|---|---|---|---|---|---|---|---|---|---|---|---|---|---|---|---|---|---|---|---|---|---|---|---|---|---|---|---|---|---|---|---|---|---|---|---|---|---|---|---|---|---|---|---|---|---|---|---|---|
| Author's title | |||||||||||||||||||||||||||||||||||||||||||||||||||||||||||||||||||||
| Author | *Unverified author* | ||||||||||||||||||||||||||||||||||||||||||||||||||||||||||||||||||||
| R Software Module | rwasp_pairs.wasp | ||||||||||||||||||||||||||||||||||||||||||||||||||||||||||||||||||||
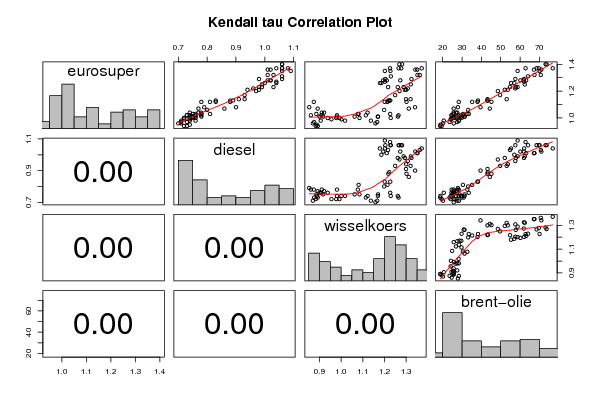
| Title produced by software | Kendall tau Correlation Matrix | ||||||||||||||||||||||||||||||||||||||||||||||||||||||||||||||||||||
| Date of computation | Wed, 19 Dec 2007 08:15:05 -0700 | ||||||||||||||||||||||||||||||||||||||||||||||||||||||||||||||||||||
| Cite this page as follows | Statistical Computations at FreeStatistics.org, Office for Research Development and Education, URL https://freestatistics.org/blog/index.php?v=date/2007/Dec/19/t1198076281r9mhpfhkgccc6fp.htm/, Retrieved Mon, 06 May 2024 23:09:31 +0000 | ||||||||||||||||||||||||||||||||||||||||||||||||||||||||||||||||||||
| Statistical Computations at FreeStatistics.org, Office for Research Development and Education, URL https://freestatistics.org/blog/index.php?pk=4669, Retrieved Mon, 06 May 2024 23:09:31 +0000 | |||||||||||||||||||||||||||||||||||||||||||||||||||||||||||||||||||||
| QR Codes: | |||||||||||||||||||||||||||||||||||||||||||||||||||||||||||||||||||||
|
| |||||||||||||||||||||||||||||||||||||||||||||||||||||||||||||||||||||
| Original text written by user: | |||||||||||||||||||||||||||||||||||||||||||||||||||||||||||||||||||||
| IsPrivate? | No (this computation is public) | ||||||||||||||||||||||||||||||||||||||||||||||||||||||||||||||||||||
| User-defined keywords | |||||||||||||||||||||||||||||||||||||||||||||||||||||||||||||||||||||
| Estimated Impact | 197 | ||||||||||||||||||||||||||||||||||||||||||||||||||||||||||||||||||||
Tree of Dependent Computations | |||||||||||||||||||||||||||||||||||||||||||||||||||||||||||||||||||||
| Family? (F = Feedback message, R = changed R code, M = changed R Module, P = changed Parameters, D = changed Data) | |||||||||||||||||||||||||||||||||||||||||||||||||||||||||||||||||||||
| - [Kendall tau Correlation Matrix] [] [2007-12-19 15:15:05] [e2f7a6e26aa7cf06a3d27eb5298a4843] [Current] | |||||||||||||||||||||||||||||||||||||||||||||||||||||||||||||||||||||
| Feedback Forum | |||||||||||||||||||||||||||||||||||||||||||||||||||||||||||||||||||||
Post a new message | |||||||||||||||||||||||||||||||||||||||||||||||||||||||||||||||||||||
Dataset | |||||||||||||||||||||||||||||||||||||||||||||||||||||||||||||||||||||
| Dataseries X: | |||||||||||||||||||||||||||||||||||||||||||||||||||||||||||||||||||||
1 0.76 0.9383 25.62 1.04 0.77 0.9217 27.5 1.02 0.76 0.9095 24.5 1.07 0.77 0.892 25.66 1.12 0.78 0.8742 28.31 1.08 0.79 0.8532 27.85 1.02 0.78 0.8607 24.61 1.01 0.76 0.9005 25.68 1.04 0.78 0.9111 25.62 0.98 0.76 0.9059 20.54 0.95 0.74 0.8883 18.8 0.94 0.73 0.8924 18.71 0.94 0.72 0.8833 19.46 0.96 0.71 0.87 20.12 0.97 0.73 0.8758 23.54 1.03 0.75 0.8858 25.6 1.01 0.75 0.917 25.39 0.99 0.72 0.9554 24.09 1 0.72 0.9922 25.69 1 0.72 0.9778 26.56 1.02 0.74 0.9808 28.33 1.01 0.78 0.9811 27.5 0.99 0.74 1.0014 24.23 0.98 0.74 1.0183 28.23 1.01 0.75 1.0622 31.29 1.03 0.78 1.0773 32.72 1.03 0.81 1.0807 30.46 1 0.75 1.0848 24.89 0.96 0.7 1.1582 25.68 0.97 0.71 1.1663 27.52 0.98 0.71 1.1372 28.4 1.02 0.73 1.1139 29.71 1.04 0.74 1.1222 26.85 1.01 0.74 1.1692 29.62 1.01 0.75 1.1702 28.69 1 0.74 1.2286 29.76 1.01 0.74 1.2613 31.3 1.02 0.73 1.2646 30.86 1.03 0.76 1.2262 33.46 1.06 0.8 1.1985 33.15 1.12 0.83 1.2007 37.99 1.12 0.81 1.2138 35.24 1.13 0.83 1.2266 38.24 1.13 0.88 1.2176 43.16 1.13 0.89 1.2218 43.33 1.17 0.93 1.249 49.67 1.14 0.91 1.2991 43.17 1.08 0.9 1.3408 39.56 1.07 0.86 1.3119 44.36 1.12 0.88 1.3014 45.22 1.14 0.93 1.3201 53.1 1.21 0.98 1.2938 52.1 1.2 0.97 1.2694 48.52 1.23 1.03 1.2165 54.84 1.29 1.06 1.2037 57.57 1.31 1.06 1.2292 64.14 1.37 1.08 1.2256 62.85 1.35 1.09 1.2015 58.75 1.26 1.04 1.1786 55.33 1.26 1 1.1856 57.03 1.28 1.01 1.2103 63.18 1.28 1.02 1.1938 60.19 1.27 1.04 1.202 62.12 1.35 1.06 1.2271 70.12 1.37 1.06 1.277 69.75 1.37 1.06 1.265 68.56 1.4 1.06 1.2684 73.77 1.4 1.06 1.2811 73.23 1.28 1.02 1.2727 61.96 1.23 0.98 1.2611 57.81 1.23 0.99 1.2881 58.76 1.25 0.99 1.3213 62.47 1.21 0.94 1.2999 53.68 1.22 0.96 1.3074 57.56 1.29 0.98 1.3242 62.05 1.32 1.01 1.3516 67.49 1.36 1.01 1.3511 67.21 1.36 1.02 1.3419 71.05 1.37 1.04 1.3716 76.93 1.32 1.03 1.3622 70.76 | |||||||||||||||||||||||||||||||||||||||||||||||||||||||||||||||||||||
Tables (Output of Computation) | |||||||||||||||||||||||||||||||||||||||||||||||||||||||||||||||||||||
| |||||||||||||||||||||||||||||||||||||||||||||||||||||||||||||||||||||
Figures (Output of Computation) | |||||||||||||||||||||||||||||||||||||||||||||||||||||||||||||||||||||
Input Parameters & R Code | |||||||||||||||||||||||||||||||||||||||||||||||||||||||||||||||||||||
| Parameters (Session): | |||||||||||||||||||||||||||||||||||||||||||||||||||||||||||||||||||||
| Parameters (R input): | |||||||||||||||||||||||||||||||||||||||||||||||||||||||||||||||||||||
| R code (references can be found in the software module): | |||||||||||||||||||||||||||||||||||||||||||||||||||||||||||||||||||||
panel.tau <- function(x, y, digits=2, prefix='', cex.cor) | |||||||||||||||||||||||||||||||||||||||||||||||||||||||||||||||||||||