Free Statistics

of Irreproducible Research!

Author's title

Author*Unverified author*
R Software Modulerwasp_autocorrelation.wasp
Title produced by software(Partial) Autocorrelation Function
Date of computationTue, 18 Dec 2007 13:12:52 -0700
Cite this page as followsStatistical Computations at FreeStatistics.org, Office for Research Development and Education, URL https://freestatistics.org/blog/index.php?v=date/2007/Dec/18/t11980077898cxa8ps2ypmr4jy.htm/, Retrieved Sat, 04 May 2024 11:18:15 +0000
Statistical Computations at FreeStatistics.org, Office for Research Development and Education, URL https://freestatistics.org/blog/index.php?pk=4594, Retrieved Sat, 04 May 2024 11:18:15 +0000
QR Codes:

Original text written by user:
IsPrivate?No (this computation is public)
User-defined keywords
Estimated Impact171
Family? (F = Feedback message, R = changed R code, M = changed R Module, P = changed Parameters, D = changed Data)
-       [(Partial) Autocorrelation Function] [] [2007-12-18 20:12:52] [dd38921fafddee0dfc20da83e9650a2a] [Current]
Feedback Forum

Post a new message
Dataseries X:
359
304,6
297,7
303,3
304,7
331,3
318,8
306,8
331,1
284,1
259,7
335,8
338,5
310,3
322,1
289,3
300,8
360,6
327,3
304,1
362
287,8
286,1
358,2
346
329,9
334,3
303,7
307,6
351,7
324,6
311,9
361,5
271,1
286,5
352,8
322,4
335
322,2
313,6
323,3
379,1
315,6
353,6
371,7
282,9
298,8
361,8
365,9
357,6
335,4
340,1
337,8
389,6
342,5
354,6
391,6
317,7
312,8
356,2


Summary of compuational transaction
Raw Inputview raw input (R code)
Raw Outputview raw output of R engine
Computing time2 seconds
R Server'Gwilym Jenkins' @ 72.249.127.135

\begin{tabular}{lllllllll}
\hline
Summary of compuational transaction \tabularnewline
Raw Input & view raw input (R code)  \tabularnewline
Raw Output & view raw output of R engine  \tabularnewline
Computing time & 2 seconds \tabularnewline
R Server & 'Gwilym Jenkins' @ 72.249.127.135 \tabularnewline
\hline
\end{tabular}
%Source: https://freestatistics.org/blog/index.php?pk=4594&T=0

[TABLE]
[ROW][C]Summary of compuational transaction[/C][/ROW]
[ROW][C]Raw Input[/C][C]view raw input (R code) [/C][/ROW]
[ROW][C]Raw Output[/C][C]view raw output of R engine [/C][/ROW]
[ROW][C]Computing time[/C][C]2 seconds[/C][/ROW]
[ROW][C]R Server[/C][C]'Gwilym Jenkins' @ 72.249.127.135[/C][/ROW]
[/TABLE]
Source: https://freestatistics.org/blog/index.php?pk=4594&T=0

Globally Unique Identifier (entire table): ba.freestatistics.org/blog/index.php?pk=4594&T=0

As an alternative you can also use a QR Code:  

The GUIDs for individual cells are displayed in the table below:

Summary of compuational transaction
Raw Inputview raw input (R code)
Raw Outputview raw output of R engine
Computing time2 seconds
R Server'Gwilym Jenkins' @ 72.249.127.135


Autocorrelation Function
Time lag kACF(k)T-STATP-value
017.7460
10.1015240.78640.217363
2-0.148973-1.15390.87345
30.3166612.45280.008549
4-0.051829-0.40150.655249
50.1075230.83290.204111
60.5037973.90240.000122
70.0398780.30890.379237
8-0.008888-0.06880.52733
90.1869241.44790.076424
10-0.328641-2.54560.993252
110.0079790.06180.475461
120.6194364.79816e-06
13-0.072816-0.5640.712582
14-0.177574-1.37550.912952
150.1123020.86990.193915
16-0.200563-1.55360.937225
170.0003540.00270.498912
180.275082.13080.018608
19-0.082929-0.64240.738459
20-0.048401-0.37490.645476
210.043660.33820.3682
22-0.348033-2.69590.995452
230.0238440.18470.427045
240.3854132.98540.002047
25-0.105794-0.81950.79212
26-0.092736-0.71830.762328
270.0659260.51070.305731
28-0.178634-1.38370.914211
290.0203140.15740.437747
300.1580161.2240.112872
31-0.063971-0.49550.688979
320.009160.0710.471835
33-0.042893-0.33220.629569
34-0.283322-2.19460.983963
35-0.006752-0.05230.520768

\begin{tabular}{lllllllll}
\hline
Autocorrelation Function \tabularnewline
Time lag k & ACF(k) & T-STAT & P-value \tabularnewline
0 & 1 & 7.746 & 0 \tabularnewline
1 & 0.101524 & 0.7864 & 0.217363 \tabularnewline
2 & -0.148973 & -1.1539 & 0.87345 \tabularnewline
3 & 0.316661 & 2.4528 & 0.008549 \tabularnewline
4 & -0.051829 & -0.4015 & 0.655249 \tabularnewline
5 & 0.107523 & 0.8329 & 0.204111 \tabularnewline
6 & 0.503797 & 3.9024 & 0.000122 \tabularnewline
7 & 0.039878 & 0.3089 & 0.379237 \tabularnewline
8 & -0.008888 & -0.0688 & 0.52733 \tabularnewline
9 & 0.186924 & 1.4479 & 0.076424 \tabularnewline
10 & -0.328641 & -2.5456 & 0.993252 \tabularnewline
11 & 0.007979 & 0.0618 & 0.475461 \tabularnewline
12 & 0.619436 & 4.7981 & 6e-06 \tabularnewline
13 & -0.072816 & -0.564 & 0.712582 \tabularnewline
14 & -0.177574 & -1.3755 & 0.912952 \tabularnewline
15 & 0.112302 & 0.8699 & 0.193915 \tabularnewline
16 & -0.200563 & -1.5536 & 0.937225 \tabularnewline
17 & 0.000354 & 0.0027 & 0.498912 \tabularnewline
18 & 0.27508 & 2.1308 & 0.018608 \tabularnewline
19 & -0.082929 & -0.6424 & 0.738459 \tabularnewline
20 & -0.048401 & -0.3749 & 0.645476 \tabularnewline
21 & 0.04366 & 0.3382 & 0.3682 \tabularnewline
22 & -0.348033 & -2.6959 & 0.995452 \tabularnewline
23 & 0.023844 & 0.1847 & 0.427045 \tabularnewline
24 & 0.385413 & 2.9854 & 0.002047 \tabularnewline
25 & -0.105794 & -0.8195 & 0.79212 \tabularnewline
26 & -0.092736 & -0.7183 & 0.762328 \tabularnewline
27 & 0.065926 & 0.5107 & 0.305731 \tabularnewline
28 & -0.178634 & -1.3837 & 0.914211 \tabularnewline
29 & 0.020314 & 0.1574 & 0.437747 \tabularnewline
30 & 0.158016 & 1.224 & 0.112872 \tabularnewline
31 & -0.063971 & -0.4955 & 0.688979 \tabularnewline
32 & 0.00916 & 0.071 & 0.471835 \tabularnewline
33 & -0.042893 & -0.3322 & 0.629569 \tabularnewline
34 & -0.283322 & -2.1946 & 0.983963 \tabularnewline
35 & -0.006752 & -0.0523 & 0.520768 \tabularnewline
\hline
\end{tabular}
%Source: https://freestatistics.org/blog/index.php?pk=4594&T=1

[TABLE]
[ROW][C]Autocorrelation Function[/C][/ROW]
[ROW][C]Time lag k[/C][C]ACF(k)[/C][C]T-STAT[/C][C]P-value[/C][/ROW]
[ROW][C]0[/C][C]1[/C][C]7.746[/C][C]0[/C][/ROW]
[ROW][C]1[/C][C]0.101524[/C][C]0.7864[/C][C]0.217363[/C][/ROW]
[ROW][C]2[/C][C]-0.148973[/C][C]-1.1539[/C][C]0.87345[/C][/ROW]
[ROW][C]3[/C][C]0.316661[/C][C]2.4528[/C][C]0.008549[/C][/ROW]
[ROW][C]4[/C][C]-0.051829[/C][C]-0.4015[/C][C]0.655249[/C][/ROW]
[ROW][C]5[/C][C]0.107523[/C][C]0.8329[/C][C]0.204111[/C][/ROW]
[ROW][C]6[/C][C]0.503797[/C][C]3.9024[/C][C]0.000122[/C][/ROW]
[ROW][C]7[/C][C]0.039878[/C][C]0.3089[/C][C]0.379237[/C][/ROW]
[ROW][C]8[/C][C]-0.008888[/C][C]-0.0688[/C][C]0.52733[/C][/ROW]
[ROW][C]9[/C][C]0.186924[/C][C]1.4479[/C][C]0.076424[/C][/ROW]
[ROW][C]10[/C][C]-0.328641[/C][C]-2.5456[/C][C]0.993252[/C][/ROW]
[ROW][C]11[/C][C]0.007979[/C][C]0.0618[/C][C]0.475461[/C][/ROW]
[ROW][C]12[/C][C]0.619436[/C][C]4.7981[/C][C]6e-06[/C][/ROW]
[ROW][C]13[/C][C]-0.072816[/C][C]-0.564[/C][C]0.712582[/C][/ROW]
[ROW][C]14[/C][C]-0.177574[/C][C]-1.3755[/C][C]0.912952[/C][/ROW]
[ROW][C]15[/C][C]0.112302[/C][C]0.8699[/C][C]0.193915[/C][/ROW]
[ROW][C]16[/C][C]-0.200563[/C][C]-1.5536[/C][C]0.937225[/C][/ROW]
[ROW][C]17[/C][C]0.000354[/C][C]0.0027[/C][C]0.498912[/C][/ROW]
[ROW][C]18[/C][C]0.27508[/C][C]2.1308[/C][C]0.018608[/C][/ROW]
[ROW][C]19[/C][C]-0.082929[/C][C]-0.6424[/C][C]0.738459[/C][/ROW]
[ROW][C]20[/C][C]-0.048401[/C][C]-0.3749[/C][C]0.645476[/C][/ROW]
[ROW][C]21[/C][C]0.04366[/C][C]0.3382[/C][C]0.3682[/C][/ROW]
[ROW][C]22[/C][C]-0.348033[/C][C]-2.6959[/C][C]0.995452[/C][/ROW]
[ROW][C]23[/C][C]0.023844[/C][C]0.1847[/C][C]0.427045[/C][/ROW]
[ROW][C]24[/C][C]0.385413[/C][C]2.9854[/C][C]0.002047[/C][/ROW]
[ROW][C]25[/C][C]-0.105794[/C][C]-0.8195[/C][C]0.79212[/C][/ROW]
[ROW][C]26[/C][C]-0.092736[/C][C]-0.7183[/C][C]0.762328[/C][/ROW]
[ROW][C]27[/C][C]0.065926[/C][C]0.5107[/C][C]0.305731[/C][/ROW]
[ROW][C]28[/C][C]-0.178634[/C][C]-1.3837[/C][C]0.914211[/C][/ROW]
[ROW][C]29[/C][C]0.020314[/C][C]0.1574[/C][C]0.437747[/C][/ROW]
[ROW][C]30[/C][C]0.158016[/C][C]1.224[/C][C]0.112872[/C][/ROW]
[ROW][C]31[/C][C]-0.063971[/C][C]-0.4955[/C][C]0.688979[/C][/ROW]
[ROW][C]32[/C][C]0.00916[/C][C]0.071[/C][C]0.471835[/C][/ROW]
[ROW][C]33[/C][C]-0.042893[/C][C]-0.3322[/C][C]0.629569[/C][/ROW]
[ROW][C]34[/C][C]-0.283322[/C][C]-2.1946[/C][C]0.983963[/C][/ROW]
[ROW][C]35[/C][C]-0.006752[/C][C]-0.0523[/C][C]0.520768[/C][/ROW]
[/TABLE]
Source: https://freestatistics.org/blog/index.php?pk=4594&T=1

Globally Unique Identifier (entire table): ba.freestatistics.org/blog/index.php?pk=4594&T=1

As an alternative you can also use a QR Code:  

The GUIDs for individual cells are displayed in the table below:

Autocorrelation Function
Time lag kACF(k)T-STATP-value
017.7460
10.1015240.78640.217363
2-0.148973-1.15390.87345
30.3166612.45280.008549
4-0.051829-0.40150.655249
50.1075230.83290.204111
60.5037973.90240.000122
70.0398780.30890.379237
8-0.008888-0.06880.52733
90.1869241.44790.076424
10-0.328641-2.54560.993252
110.0079790.06180.475461
120.6194364.79816e-06
13-0.072816-0.5640.712582
14-0.177574-1.37550.912952
150.1123020.86990.193915
16-0.200563-1.55360.937225
170.0003540.00270.498912
180.275082.13080.018608
19-0.082929-0.64240.738459
20-0.048401-0.37490.645476
210.043660.33820.3682
22-0.348033-2.69590.995452
230.0238440.18470.427045
240.3854132.98540.002047
25-0.105794-0.81950.79212
26-0.092736-0.71830.762328
270.0659260.51070.305731
28-0.178634-1.38370.914211
290.0203140.15740.437747
300.1580161.2240.112872
31-0.063971-0.49550.688979
320.009160.0710.471835
33-0.042893-0.33220.629569
34-0.283322-2.19460.983963
35-0.006752-0.05230.520768


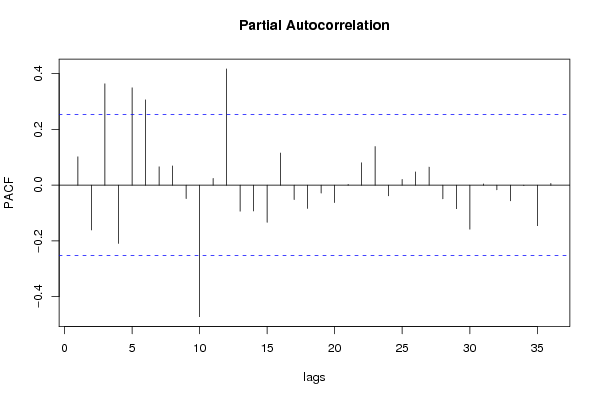
Partial Autocorrelation Function
Time lag kPACF(k)T-STATP-value
00.1015240.78640.217363
1-0.160939-1.24660.891311
20.3636282.81670.00328
3-0.209137-1.620.944758
40.3494232.70660.004419
50.3059962.37020.010504
60.0658020.50970.306065
70.0690710.5350.297306
8-0.048163-0.37310.644795
9-0.471855-3.6550.999729
100.0241680.18720.426065
110.4169473.22970.001006
12-0.093381-0.72330.763854
13-0.092339-0.71530.761387
14-0.133265-1.03230.846954
150.1152440.89270.187798
16-0.051719-0.40060.654938
17-0.083349-0.64560.739507
18-0.028389-0.21990.586653
19-0.062333-0.48280.684514
200.0025710.01990.492087
210.080330.62220.268072
220.138681.07420.143515
23-0.03806-0.29480.615423
240.0203350.15750.437684
250.0474890.36790.357139
260.0646750.5010.309112
27-0.049133-0.38060.64757
28-0.084525-0.65470.742427
29-0.158221-1.22560.887426
300.0044170.03420.486411
31-0.016626-0.12880.551019
32-0.056293-0.4360.667815
33-0.001637-0.01270.505039
34-0.145486-1.12690.867871
350.0062470.04840.480782

\begin{tabular}{lllllllll}
\hline
Partial Autocorrelation Function \tabularnewline
Time lag k & PACF(k) & T-STAT & P-value \tabularnewline
0 & 0.101524 & 0.7864 & 0.217363 \tabularnewline
1 & -0.160939 & -1.2466 & 0.891311 \tabularnewline
2 & 0.363628 & 2.8167 & 0.00328 \tabularnewline
3 & -0.209137 & -1.62 & 0.944758 \tabularnewline
4 & 0.349423 & 2.7066 & 0.004419 \tabularnewline
5 & 0.305996 & 2.3702 & 0.010504 \tabularnewline
6 & 0.065802 & 0.5097 & 0.306065 \tabularnewline
7 & 0.069071 & 0.535 & 0.297306 \tabularnewline
8 & -0.048163 & -0.3731 & 0.644795 \tabularnewline
9 & -0.471855 & -3.655 & 0.999729 \tabularnewline
10 & 0.024168 & 0.1872 & 0.426065 \tabularnewline
11 & 0.416947 & 3.2297 & 0.001006 \tabularnewline
12 & -0.093381 & -0.7233 & 0.763854 \tabularnewline
13 & -0.092339 & -0.7153 & 0.761387 \tabularnewline
14 & -0.133265 & -1.0323 & 0.846954 \tabularnewline
15 & 0.115244 & 0.8927 & 0.187798 \tabularnewline
16 & -0.051719 & -0.4006 & 0.654938 \tabularnewline
17 & -0.083349 & -0.6456 & 0.739507 \tabularnewline
18 & -0.028389 & -0.2199 & 0.586653 \tabularnewline
19 & -0.062333 & -0.4828 & 0.684514 \tabularnewline
20 & 0.002571 & 0.0199 & 0.492087 \tabularnewline
21 & 0.08033 & 0.6222 & 0.268072 \tabularnewline
22 & 0.13868 & 1.0742 & 0.143515 \tabularnewline
23 & -0.03806 & -0.2948 & 0.615423 \tabularnewline
24 & 0.020335 & 0.1575 & 0.437684 \tabularnewline
25 & 0.047489 & 0.3679 & 0.357139 \tabularnewline
26 & 0.064675 & 0.501 & 0.309112 \tabularnewline
27 & -0.049133 & -0.3806 & 0.64757 \tabularnewline
28 & -0.084525 & -0.6547 & 0.742427 \tabularnewline
29 & -0.158221 & -1.2256 & 0.887426 \tabularnewline
30 & 0.004417 & 0.0342 & 0.486411 \tabularnewline
31 & -0.016626 & -0.1288 & 0.551019 \tabularnewline
32 & -0.056293 & -0.436 & 0.667815 \tabularnewline
33 & -0.001637 & -0.0127 & 0.505039 \tabularnewline
34 & -0.145486 & -1.1269 & 0.867871 \tabularnewline
35 & 0.006247 & 0.0484 & 0.480782 \tabularnewline
\hline
\end{tabular}
%Source: https://freestatistics.org/blog/index.php?pk=4594&T=2

[TABLE]
[ROW][C]Partial Autocorrelation Function[/C][/ROW]
[ROW][C]Time lag k[/C][C]PACF(k)[/C][C]T-STAT[/C][C]P-value[/C][/ROW]
[ROW][C]0[/C][C]0.101524[/C][C]0.7864[/C][C]0.217363[/C][/ROW]
[ROW][C]1[/C][C]-0.160939[/C][C]-1.2466[/C][C]0.891311[/C][/ROW]
[ROW][C]2[/C][C]0.363628[/C][C]2.8167[/C][C]0.00328[/C][/ROW]
[ROW][C]3[/C][C]-0.209137[/C][C]-1.62[/C][C]0.944758[/C][/ROW]
[ROW][C]4[/C][C]0.349423[/C][C]2.7066[/C][C]0.004419[/C][/ROW]
[ROW][C]5[/C][C]0.305996[/C][C]2.3702[/C][C]0.010504[/C][/ROW]
[ROW][C]6[/C][C]0.065802[/C][C]0.5097[/C][C]0.306065[/C][/ROW]
[ROW][C]7[/C][C]0.069071[/C][C]0.535[/C][C]0.297306[/C][/ROW]
[ROW][C]8[/C][C]-0.048163[/C][C]-0.3731[/C][C]0.644795[/C][/ROW]
[ROW][C]9[/C][C]-0.471855[/C][C]-3.655[/C][C]0.999729[/C][/ROW]
[ROW][C]10[/C][C]0.024168[/C][C]0.1872[/C][C]0.426065[/C][/ROW]
[ROW][C]11[/C][C]0.416947[/C][C]3.2297[/C][C]0.001006[/C][/ROW]
[ROW][C]12[/C][C]-0.093381[/C][C]-0.7233[/C][C]0.763854[/C][/ROW]
[ROW][C]13[/C][C]-0.092339[/C][C]-0.7153[/C][C]0.761387[/C][/ROW]
[ROW][C]14[/C][C]-0.133265[/C][C]-1.0323[/C][C]0.846954[/C][/ROW]
[ROW][C]15[/C][C]0.115244[/C][C]0.8927[/C][C]0.187798[/C][/ROW]
[ROW][C]16[/C][C]-0.051719[/C][C]-0.4006[/C][C]0.654938[/C][/ROW]
[ROW][C]17[/C][C]-0.083349[/C][C]-0.6456[/C][C]0.739507[/C][/ROW]
[ROW][C]18[/C][C]-0.028389[/C][C]-0.2199[/C][C]0.586653[/C][/ROW]
[ROW][C]19[/C][C]-0.062333[/C][C]-0.4828[/C][C]0.684514[/C][/ROW]
[ROW][C]20[/C][C]0.002571[/C][C]0.0199[/C][C]0.492087[/C][/ROW]
[ROW][C]21[/C][C]0.08033[/C][C]0.6222[/C][C]0.268072[/C][/ROW]
[ROW][C]22[/C][C]0.13868[/C][C]1.0742[/C][C]0.143515[/C][/ROW]
[ROW][C]23[/C][C]-0.03806[/C][C]-0.2948[/C][C]0.615423[/C][/ROW]
[ROW][C]24[/C][C]0.020335[/C][C]0.1575[/C][C]0.437684[/C][/ROW]
[ROW][C]25[/C][C]0.047489[/C][C]0.3679[/C][C]0.357139[/C][/ROW]
[ROW][C]26[/C][C]0.064675[/C][C]0.501[/C][C]0.309112[/C][/ROW]
[ROW][C]27[/C][C]-0.049133[/C][C]-0.3806[/C][C]0.64757[/C][/ROW]
[ROW][C]28[/C][C]-0.084525[/C][C]-0.6547[/C][C]0.742427[/C][/ROW]
[ROW][C]29[/C][C]-0.158221[/C][C]-1.2256[/C][C]0.887426[/C][/ROW]
[ROW][C]30[/C][C]0.004417[/C][C]0.0342[/C][C]0.486411[/C][/ROW]
[ROW][C]31[/C][C]-0.016626[/C][C]-0.1288[/C][C]0.551019[/C][/ROW]
[ROW][C]32[/C][C]-0.056293[/C][C]-0.436[/C][C]0.667815[/C][/ROW]
[ROW][C]33[/C][C]-0.001637[/C][C]-0.0127[/C][C]0.505039[/C][/ROW]
[ROW][C]34[/C][C]-0.145486[/C][C]-1.1269[/C][C]0.867871[/C][/ROW]
[ROW][C]35[/C][C]0.006247[/C][C]0.0484[/C][C]0.480782[/C][/ROW]
[/TABLE]
Source: https://freestatistics.org/blog/index.php?pk=4594&T=2

Globally Unique Identifier (entire table): ba.freestatistics.org/blog/index.php?pk=4594&T=2

As an alternative you can also use a QR Code:  

The GUIDs for individual cells are displayed in the table below:

Partial Autocorrelation Function
Time lag kPACF(k)T-STATP-value
00.1015240.78640.217363
1-0.160939-1.24660.891311
20.3636282.81670.00328
3-0.209137-1.620.944758
40.3494232.70660.004419
50.3059962.37020.010504
60.0658020.50970.306065
70.0690710.5350.297306
8-0.048163-0.37310.644795
9-0.471855-3.6550.999729
100.0241680.18720.426065
110.4169473.22970.001006
12-0.093381-0.72330.763854
13-0.092339-0.71530.761387
14-0.133265-1.03230.846954
150.1152440.89270.187798
16-0.051719-0.40060.654938
17-0.083349-0.64560.739507
18-0.028389-0.21990.586653
19-0.062333-0.48280.684514
200.0025710.01990.492087
210.080330.62220.268072
220.138681.07420.143515
23-0.03806-0.29480.615423
240.0203350.15750.437684
250.0474890.36790.357139
260.0646750.5010.309112
27-0.049133-0.38060.64757
28-0.084525-0.65470.742427
29-0.158221-1.22560.887426
300.0044170.03420.486411
31-0.016626-0.12880.551019
32-0.056293-0.4360.667815
33-0.001637-0.01270.505039
34-0.145486-1.12690.867871
350.0062470.04840.480782


Parameters (Session):
par1 = 1 ; par2 = Do not include Seasonal Dummies ; par3 = No Linear Trend ;
Parameters (R input):
par1 = 36 ; par2 = 1 ; par3 = 0 ; par4 = 0 ; par5 = 12 ;
R code (references can be found in the software module):
if (par1 == 'Default') {
par1 = 10*log10(length(x))
} else {
par1 <- as.numeric(par1)
}
par2 <- as.numeric(par2)
par3 <- as.numeric(par3)
par4 <- as.numeric(par4)
par5 <- as.numeric(par5)
if (par2 == 0) {
x <- log(x)
} else {
x <- (x ^ par2 - 1) / par2
}
if (par3 > 0) x <- diff(x,lag=1,difference=par3)
if (par4 > 0) x <- diff(x,lag=par5,difference=par4)
bitmap(file='pic1.png')
racf <- acf(x,par1,main='Autocorrelation',xlab='lags',ylab='ACF')
dev.off()
bitmap(file='pic2.png')
rpacf <- pacf(x,par1,main='Partial Autocorrelation',xlab='lags',ylab='PACF')
dev.off()
(myacf <- c(racf$acf))
(mypacf <- c(rpacf$acf))
lengthx <- length(x)
sqrtn <- sqrt(lengthx)
load(file='createtable')
a<-table.start()
a<-table.row.start(a)
a<-table.element(a,'Autocorrelation Function',4,TRUE)
a<-table.row.end(a)
a<-table.row.start(a)
a<-table.element(a,'Time lag k',header=TRUE)
a<-table.element(a,hyperlink('basics.htm','ACF(k)','click here for more information about the Autocorrelation Function'),header=TRUE)
a<-table.element(a,'T-STAT',header=TRUE)
a<-table.element(a,'P-value',header=TRUE)
a<-table.row.end(a)
for (i in 1:par1) {
a<-table.row.start(a)
a<-table.element(a,i-1,header=TRUE)
a<-table.element(a,round(myacf[i],6))
mytstat <- myacf[i]*sqrtn
a<-table.element(a,round(mytstat,4))
a<-table.element(a,round(1-pt(mytstat,lengthx),6))
a<-table.row.end(a)
}
a<-table.end(a)
table.save(a,file='mytable.tab')
a<-table.start()
a<-table.row.start(a)
a<-table.element(a,'Partial Autocorrelation Function',4,TRUE)
a<-table.row.end(a)
a<-table.row.start(a)
a<-table.element(a,'Time lag k',header=TRUE)
a<-table.element(a,hyperlink('basics.htm','PACF(k)','click here for more information about the Partial Autocorrelation Function'),header=TRUE)
a<-table.element(a,'T-STAT',header=TRUE)
a<-table.element(a,'P-value',header=TRUE)
a<-table.row.end(a)
for (i in 1:par1) {
a<-table.row.start(a)
a<-table.element(a,i-1,header=TRUE)
a<-table.element(a,round(mypacf[i],6))
mytstat <- mypacf[i]*sqrtn
a<-table.element(a,round(mytstat,4))
a<-table.element(a,round(1-pt(mytstat,lengthx),6))
a<-table.row.end(a)
}
a<-table.end(a)
table.save(a,file='mytable1.tab')