Free Statistics
of Irreproducible Research!
Description of Statistical Computation | |||||||||||||||||||||||||||||||||||||||||||||||||
|---|---|---|---|---|---|---|---|---|---|---|---|---|---|---|---|---|---|---|---|---|---|---|---|---|---|---|---|---|---|---|---|---|---|---|---|---|---|---|---|---|---|---|---|---|---|---|---|---|---|
| Author's title | |||||||||||||||||||||||||||||||||||||||||||||||||
| Author | *Unverified author* | ||||||||||||||||||||||||||||||||||||||||||||||||
| R Software Module | rwasp_tukeylambda.wasp | ||||||||||||||||||||||||||||||||||||||||||||||||
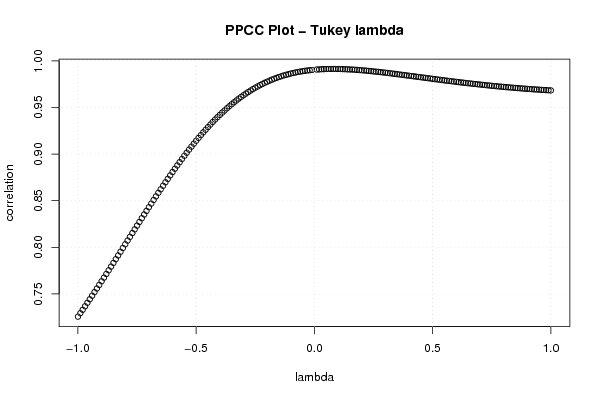
| Title produced by software | Tukey lambda PPCC Plot | ||||||||||||||||||||||||||||||||||||||||||||||||
| Date of computation | Tue, 18 Dec 2007 13:11:06 -0700 | ||||||||||||||||||||||||||||||||||||||||||||||||
| Cite this page as follows | Statistical Computations at FreeStatistics.org, Office for Research Development and Education, URL https://freestatistics.org/blog/index.php?v=date/2007/Dec/18/t11980076373dq82yrfnsbpwdh.htm/, Retrieved Mon, 30 Jun 2025 22:37:44 +0000 | ||||||||||||||||||||||||||||||||||||||||||||||||
| Statistical Computations at FreeStatistics.org, Office for Research Development and Education, URL https://freestatistics.org/blog/index.php?pk=4593, Retrieved Mon, 30 Jun 2025 22:37:44 +0000 | |||||||||||||||||||||||||||||||||||||||||||||||||
| QR Codes: | |||||||||||||||||||||||||||||||||||||||||||||||||
|
| |||||||||||||||||||||||||||||||||||||||||||||||||
| Original text written by user: | |||||||||||||||||||||||||||||||||||||||||||||||||
| IsPrivate? | No (this computation is public) | ||||||||||||||||||||||||||||||||||||||||||||||||
| User-defined keywords | PPPCCPRR | ||||||||||||||||||||||||||||||||||||||||||||||||
| Estimated Impact | 266 | ||||||||||||||||||||||||||||||||||||||||||||||||
Tree of Dependent Computations | |||||||||||||||||||||||||||||||||||||||||||||||||
| Family? (F = Feedback message, R = changed R code, M = changed R Module, P = changed Parameters, D = changed Data) | |||||||||||||||||||||||||||||||||||||||||||||||||
| - [Tukey lambda PPCC Plot] [Paper - PPCC-plot...] [2007-12-18 20:11:06] [e51d7ab0e549b3dc96ac85a81d9bd259] [Current] | |||||||||||||||||||||||||||||||||||||||||||||||||
| Feedback Forum | |||||||||||||||||||||||||||||||||||||||||||||||||
Post a new message | |||||||||||||||||||||||||||||||||||||||||||||||||
Dataset | |||||||||||||||||||||||||||||||||||||||||||||||||
| Dataseries X: | |||||||||||||||||||||||||||||||||||||||||||||||||
1.74138367229942 -2.88580372001652 -3.00801521083293 5.35873352650856 -0.350197418097050 -4.44477983570422 -14.1704246279256 5.06291770302617 8.16317098727172 -6.63032011800066 -0.955084752066612 4.76580237731785 4.64634662056524 -3.37632197945722 -3.48596660066835 0.00318885841739619 -2.30873579009489 4.510676743397 3.86380235714235 -4.84743390386536 1.19326683102373 9.49359417425812 -5.7256091522179 -6.7409221436693 -8.37465970382766 2.41947579953488 2.51107146040831 2.31318281556092 -3.02118693681124 3.49111382410466 -5.27208657466297 -1.65652539783093 1.158900365591 3.29699796504326 5.45943755223924 -3.39089745529757 -3.24888068501405 -3.76725354399628 -1.01610429731824 -0.141686930225946 -2.40143497370904 3.01483128334767 -2.37153731174333 1.90350531137286 -3.75249259201867 -1.15949421149824 1.41625767699710 0.756276066572336 1.74232125798030 -2.82713799160403 2.91169906841461 -7.53666538846806 8.89398251304836 -1.48741996092416 3.26139630257603 -3.15021888842772 3.8905793816289 7.41906373843078 7.78286136215999 -3.77518512848798 0.0882557144562938 1.75385231671455 1.56061031268522 -1.4983198165646 4.36211820238709 2.31013654316626 -2.33448411305145 -1.40752353154939 | |||||||||||||||||||||||||||||||||||||||||||||||||
Tables (Output of Computation) | |||||||||||||||||||||||||||||||||||||||||||||||||
| |||||||||||||||||||||||||||||||||||||||||||||||||
Figures (Output of Computation) | |||||||||||||||||||||||||||||||||||||||||||||||||
Input Parameters & R Code | |||||||||||||||||||||||||||||||||||||||||||||||||
| Parameters (Session): | |||||||||||||||||||||||||||||||||||||||||||||||||
| Parameters (R input): | |||||||||||||||||||||||||||||||||||||||||||||||||
| R code (references can be found in the software module): | |||||||||||||||||||||||||||||||||||||||||||||||||
gp <- function(lambda, p) | |||||||||||||||||||||||||||||||||||||||||||||||||