Free Statistics

of Irreproducible Research!

Author's title

Author*Unverified author*
R Software Modulerwasp_multipleregression.wasp
Title produced by softwareMultiple Regression
Date of computationTue, 18 Dec 2007 12:42:27 -0700
Cite this page as followsStatistical Computations at FreeStatistics.org, Office for Research Development and Education, URL https://freestatistics.org/blog/index.php?v=date/2007/Dec/18/t1198005964fvdd37aai93k2nt.htm/, Retrieved Sat, 04 May 2024 06:03:12 +0000
Statistical Computations at FreeStatistics.org, Office for Research Development and Education, URL https://freestatistics.org/blog/index.php?pk=14394, Retrieved Sat, 04 May 2024 06:03:12 +0000
QR Codes:

Original text written by user:
IsPrivate?No (this computation is public)
User-defined keywords
Estimated Impact194
Family? (F = Feedback message, R = changed R code, M = changed R Module, P = changed Parameters, D = changed Data)
-       [Multiple Regression] [] [2007-12-18 19:42:27] [923db922542fbe09e7ff87bb31b2f310] [Current]
Feedback Forum

Post a new message
Dataseries X:
8.1	359
8.3	304.6
8.2	297.7
8.1	303.3
7.7	304.7
7.6	331.3
7.7	318.8
8.2	306.8
8.4	331.1
8.4	284.1
8.6	259.7
8.4	335.8
8.5	338.5
8.7	310.3
8.7	322.1
8.6	289.3
7.4	300.8
7.3	360.6
7.4	327.3
9	304.1
9.2	362
9.2	287.8
8.5	286.1
8.3	358.2
8.3	346
8.6	329.9
8.6	334.3
8.5	303.7
8.1	307.6
8.1	351.7
8	324.6
8.6	311.9
8.7	361.5
8.7	271.1
8.6	286.5
8.4	352.8
8.4	322.4
8.7	335
8.7	322.2
8.5	313.6
8.3	323.3
8.3	379.1
8.3	315.6
8.1	353.6
8.2	371.7
8.1	282.9
8.1	298.8
7.9	361.8
7.7	365.9
8.1	357.6
8	335.4
7.7	340.1
7.8	337.8
7.6	389.6
7.4	342.5
7.7	354.6
7.8	391.6
7.5	317.7
7.2	312.8
7	356.2


Summary of compuational transaction
Raw Inputview raw input (R code)
Raw Outputview raw output of R engine
Computing time3 seconds
R Server'Gwilym Jenkins' @ 72.249.127.135

\begin{tabular}{lllllllll}
\hline
Summary of compuational transaction \tabularnewline
Raw Input & view raw input (R code)  \tabularnewline
Raw Output & view raw output of R engine  \tabularnewline
Computing time & 3 seconds \tabularnewline
R Server & 'Gwilym Jenkins' @ 72.249.127.135 \tabularnewline
\hline
\end{tabular}
%Source: https://freestatistics.org/blog/index.php?pk=14394&T=0

[TABLE]
[ROW][C]Summary of compuational transaction[/C][/ROW]
[ROW][C]Raw Input[/C][C]view raw input (R code) [/C][/ROW]
[ROW][C]Raw Output[/C][C]view raw output of R engine [/C][/ROW]
[ROW][C]Computing time[/C][C]3 seconds[/C][/ROW]
[ROW][C]R Server[/C][C]'Gwilym Jenkins' @ 72.249.127.135[/C][/ROW]
[/TABLE]
Source: https://freestatistics.org/blog/index.php?pk=14394&T=0

Globally Unique Identifier (entire table): ba.freestatistics.org/blog/index.php?pk=14394&T=0

As an alternative you can also use a QR Code:  

The GUIDs for individual cells are displayed in the table below:

Summary of compuational transaction
Raw Inputview raw input (R code)
Raw Outputview raw output of R engine
Computing time3 seconds
R Server'Gwilym Jenkins' @ 72.249.127.135


Multiple Linear Regression - Estimated Regression Equation
X[t] = + 389.155925196851 -7.52559055118119Y[t] + 2.2411400918632M1[t] -15.1986056430446M2[t] -21.3065403543307M3[t] -35.5175459317585M4[t] -34.5052050524935M5[t] + 11.8458366141732M6[t] -25.6715862860892M7[t] -21.6841666666666M8[t] + 16.0825049212599M9[t] -60.0464534120734M10[t] -62.0079708005249M11[t] + 0.666911089238846t + e[t]

\begin{tabular}{lllllllll}
\hline
Multiple Linear Regression - Estimated Regression Equation \tabularnewline
X[t] =  +  389.155925196851 -7.52559055118119Y[t] +  2.2411400918632M1[t] -15.1986056430446M2[t] -21.3065403543307M3[t] -35.5175459317585M4[t] -34.5052050524935M5[t] +  11.8458366141732M6[t] -25.6715862860892M7[t] -21.6841666666666M8[t] +  16.0825049212599M9[t] -60.0464534120734M10[t] -62.0079708005249M11[t] +  0.666911089238846t  + e[t] \tabularnewline
\hline
\end{tabular}
%Source: https://freestatistics.org/blog/index.php?pk=14394&T=1

[TABLE]
[ROW][C]Multiple Linear Regression - Estimated Regression Equation[/C][/ROW]
[ROW][C]X[t] =  +  389.155925196851 -7.52559055118119Y[t] +  2.2411400918632M1[t] -15.1986056430446M2[t] -21.3065403543307M3[t] -35.5175459317585M4[t] -34.5052050524935M5[t] +  11.8458366141732M6[t] -25.6715862860892M7[t] -21.6841666666666M8[t] +  16.0825049212599M9[t] -60.0464534120734M10[t] -62.0079708005249M11[t] +  0.666911089238846t  + e[t][/C][/ROW]
[/TABLE]
Source: https://freestatistics.org/blog/index.php?pk=14394&T=1

Globally Unique Identifier (entire table): ba.freestatistics.org/blog/index.php?pk=14394&T=1

As an alternative you can also use a QR Code:  

The GUIDs for individual cells are displayed in the table below:

Multiple Linear Regression - Estimated Regression Equation
X[t] = + 389.155925196851 -7.52559055118119Y[t] + 2.2411400918632M1[t] -15.1986056430446M2[t] -21.3065403543307M3[t] -35.5175459317585M4[t] -34.5052050524935M5[t] + 11.8458366141732M6[t] -25.6715862860892M7[t] -21.6841666666666M8[t] + 16.0825049212599M9[t] -60.0464534120734M10[t] -62.0079708005249M11[t] + 0.666911089238846t + e[t]


Multiple Linear Regression - Ordinary Least Squares
VariableParameterS.D.T-STATH0: parameter = 02-tail p-value1-tail p-value
(Intercept)389.15592519685134.92916611.141300
Y-7.525590551181194.119764-1.82670.0742370.037119
M12.24114009186327.6578750.29270.7710990.38555
M2-15.19860564304467.799657-1.94860.0574550.028728
M3-21.30654035433077.76483-2.7440.0086260.004313
M4-35.51754593175857.663006-4.63493e-051.5e-05
M5-34.50520505249357.655622-4.50724.5e-052.2e-05
M611.84583661417327.6862581.54120.1301270.065063
M7-25.67158628608927.686879-3.33970.001670.000835
M8-21.68416666666667.678863-2.82390.006990.003495
M916.08250492125997.7921412.06390.0446910.022345
M10-60.04645341207347.728294-7.769700
M11-62.00797080052497.62264-8.134700
t0.6669110892388460.0991466.726600

\begin{tabular}{lllllllll}
\hline
Multiple Linear Regression - Ordinary Least Squares \tabularnewline
Variable & Parameter & S.D. & T-STATH0: parameter = 0 & 2-tail p-value & 1-tail p-value \tabularnewline
(Intercept) & 389.155925196851 & 34.929166 & 11.1413 & 0 & 0 \tabularnewline
Y & -7.52559055118119 & 4.119764 & -1.8267 & 0.074237 & 0.037119 \tabularnewline
M1 & 2.2411400918632 & 7.657875 & 0.2927 & 0.771099 & 0.38555 \tabularnewline
M2 & -15.1986056430446 & 7.799657 & -1.9486 & 0.057455 & 0.028728 \tabularnewline
M3 & -21.3065403543307 & 7.76483 & -2.744 & 0.008626 & 0.004313 \tabularnewline
M4 & -35.5175459317585 & 7.663006 & -4.6349 & 3e-05 & 1.5e-05 \tabularnewline
M5 & -34.5052050524935 & 7.655622 & -4.5072 & 4.5e-05 & 2.2e-05 \tabularnewline
M6 & 11.8458366141732 & 7.686258 & 1.5412 & 0.130127 & 0.065063 \tabularnewline
M7 & -25.6715862860892 & 7.686879 & -3.3397 & 0.00167 & 0.000835 \tabularnewline
M8 & -21.6841666666666 & 7.678863 & -2.8239 & 0.00699 & 0.003495 \tabularnewline
M9 & 16.0825049212599 & 7.792141 & 2.0639 & 0.044691 & 0.022345 \tabularnewline
M10 & -60.0464534120734 & 7.728294 & -7.7697 & 0 & 0 \tabularnewline
M11 & -62.0079708005249 & 7.62264 & -8.1347 & 0 & 0 \tabularnewline
t & 0.666911089238846 & 0.099146 & 6.7266 & 0 & 0 \tabularnewline
\hline
\end{tabular}
%Source: https://freestatistics.org/blog/index.php?pk=14394&T=2

[TABLE]
[ROW][C]Multiple Linear Regression - Ordinary Least Squares[/C][/ROW]
[ROW][C]Variable[/C][C]Parameter[/C][C]S.D.[/C][C]T-STATH0: parameter = 0[/C][C]2-tail p-value[/C][C]1-tail p-value[/C][/ROW]
[ROW][C](Intercept)[/C][C]389.155925196851[/C][C]34.929166[/C][C]11.1413[/C][C]0[/C][C]0[/C][/ROW]
[ROW][C]Y[/C][C]-7.52559055118119[/C][C]4.119764[/C][C]-1.8267[/C][C]0.074237[/C][C]0.037119[/C][/ROW]
[ROW][C]M1[/C][C]2.2411400918632[/C][C]7.657875[/C][C]0.2927[/C][C]0.771099[/C][C]0.38555[/C][/ROW]
[ROW][C]M2[/C][C]-15.1986056430446[/C][C]7.799657[/C][C]-1.9486[/C][C]0.057455[/C][C]0.028728[/C][/ROW]
[ROW][C]M3[/C][C]-21.3065403543307[/C][C]7.76483[/C][C]-2.744[/C][C]0.008626[/C][C]0.004313[/C][/ROW]
[ROW][C]M4[/C][C]-35.5175459317585[/C][C]7.663006[/C][C]-4.6349[/C][C]3e-05[/C][C]1.5e-05[/C][/ROW]
[ROW][C]M5[/C][C]-34.5052050524935[/C][C]7.655622[/C][C]-4.5072[/C][C]4.5e-05[/C][C]2.2e-05[/C][/ROW]
[ROW][C]M6[/C][C]11.8458366141732[/C][C]7.686258[/C][C]1.5412[/C][C]0.130127[/C][C]0.065063[/C][/ROW]
[ROW][C]M7[/C][C]-25.6715862860892[/C][C]7.686879[/C][C]-3.3397[/C][C]0.00167[/C][C]0.000835[/C][/ROW]
[ROW][C]M8[/C][C]-21.6841666666666[/C][C]7.678863[/C][C]-2.8239[/C][C]0.00699[/C][C]0.003495[/C][/ROW]
[ROW][C]M9[/C][C]16.0825049212599[/C][C]7.792141[/C][C]2.0639[/C][C]0.044691[/C][C]0.022345[/C][/ROW]
[ROW][C]M10[/C][C]-60.0464534120734[/C][C]7.728294[/C][C]-7.7697[/C][C]0[/C][C]0[/C][/ROW]
[ROW][C]M11[/C][C]-62.0079708005249[/C][C]7.62264[/C][C]-8.1347[/C][C]0[/C][C]0[/C][/ROW]
[ROW][C]t[/C][C]0.666911089238846[/C][C]0.099146[/C][C]6.7266[/C][C]0[/C][C]0[/C][/ROW]
[/TABLE]
Source: https://freestatistics.org/blog/index.php?pk=14394&T=2

Globally Unique Identifier (entire table): ba.freestatistics.org/blog/index.php?pk=14394&T=2

As an alternative you can also use a QR Code:  

The GUIDs for individual cells are displayed in the table below:

Multiple Linear Regression - Ordinary Least Squares
VariableParameterS.D.T-STATH0: parameter = 02-tail p-value1-tail p-value
(Intercept)389.15592519685134.92916611.141300
Y-7.525590551181194.119764-1.82670.0742370.037119
M12.24114009186327.6578750.29270.7710990.38555
M2-15.19860564304467.799657-1.94860.0574550.028728
M3-21.30654035433077.76483-2.7440.0086260.004313
M4-35.51754593175857.663006-4.63493e-051.5e-05
M5-34.50520505249357.655622-4.50724.5e-052.2e-05
M611.84583661417327.6862581.54120.1301270.065063
M7-25.67158628608927.686879-3.33970.001670.000835
M8-21.68416666666667.678863-2.82390.006990.003495
M916.08250492125997.7921412.06390.0446910.022345
M10-60.04645341207347.728294-7.769700
M11-62.00797080052497.62264-8.134700
t0.6669110892388460.0991466.726600


Multiple Linear Regression - Regression Statistics
Multiple R0.933813178790619
R-squared0.87200705288304
Adjusted R-squared0.835835133045638
F-TEST (value)24.1072925297536
F-TEST (DF numerator)13
F-TEST (DF denominator)46
p-value3.33066907387547e-16
Multiple Linear Regression - Residual Statistics
Residual Standard Deviation11.9874974471114
Sum Squared Residuals6610.20437204716

\begin{tabular}{lllllllll}
\hline
Multiple Linear Regression - Regression Statistics \tabularnewline
Multiple R & 0.933813178790619 \tabularnewline
R-squared & 0.87200705288304 \tabularnewline
Adjusted R-squared & 0.835835133045638 \tabularnewline
F-TEST (value) & 24.1072925297536 \tabularnewline
F-TEST (DF numerator) & 13 \tabularnewline
F-TEST (DF denominator) & 46 \tabularnewline
p-value & 3.33066907387547e-16 \tabularnewline
Multiple Linear Regression - Residual Statistics \tabularnewline
Residual Standard Deviation & 11.9874974471114 \tabularnewline
Sum Squared Residuals & 6610.20437204716 \tabularnewline
\hline
\end{tabular}
%Source: https://freestatistics.org/blog/index.php?pk=14394&T=3

[TABLE]
[ROW][C]Multiple Linear Regression - Regression Statistics[/C][/ROW]
[ROW][C]Multiple R[/C][C]0.933813178790619[/C][/ROW]
[ROW][C]R-squared[/C][C]0.87200705288304[/C][/ROW]
[ROW][C]Adjusted R-squared[/C][C]0.835835133045638[/C][/ROW]
[ROW][C]F-TEST (value)[/C][C]24.1072925297536[/C][/ROW]
[ROW][C]F-TEST (DF numerator)[/C][C]13[/C][/ROW]
[ROW][C]F-TEST (DF denominator)[/C][C]46[/C][/ROW]
[ROW][C]p-value[/C][C]3.33066907387547e-16[/C][/ROW]
[ROW][C]Multiple Linear Regression - Residual Statistics[/C][/ROW]
[ROW][C]Residual Standard Deviation[/C][C]11.9874974471114[/C][/ROW]
[ROW][C]Sum Squared Residuals[/C][C]6610.20437204716[/C][/ROW]
[/TABLE]
Source: https://freestatistics.org/blog/index.php?pk=14394&T=3

Globally Unique Identifier (entire table): ba.freestatistics.org/blog/index.php?pk=14394&T=3

As an alternative you can also use a QR Code:  

The GUIDs for individual cells are displayed in the table below:

Multiple Linear Regression - Regression Statistics
Multiple R0.933813178790619
R-squared0.87200705288304
Adjusted R-squared0.835835133045638
F-TEST (value)24.1072925297536
F-TEST (DF numerator)13
F-TEST (DF denominator)46
p-value3.33066907387547e-16
Multiple Linear Regression - Residual Statistics
Residual Standard Deviation11.9874974471114
Sum Squared Residuals6610.20437204716


Multiple Linear Regression - Actuals, Interpolation, and Residuals
Time or IndexActualsInterpolationForecastResidualsPrediction Error
1359331.10669291338727.8933070866129
2304.6312.82874015748-8.22874015748024
3297.7308.140275590551-10.4402755905512
4303.3295.348740157487.9512598425197
5304.7300.0382283464574.66177165354334
6331.3347.808740157480-16.5087401574803
7318.8310.2056692913398.59433070866145
8306.8311.097204724409-4.29720472440946
9331.1348.025669291339-16.9256692913386
10284.1272.56362204724411.5363779527559
11259.7269.763897637795-10.0638976377952
12335.8333.9438976377951.85610236220474
13338.5336.0993897637792.40061023622085
14310.3317.821437007874-7.52143700787398
15322.1312.3804133858279.71958661417329
16289.3299.588877952756-10.2888779527559
17300.8310.298838582677-9.4988385826772
18360.6358.0693503937012.53064960629918
19327.3320.4662795275596.8337204724409
20304.1313.079665354331-8.97966535433061
21362350.0081299212611.9918700787402
22287.8274.54608267716513.2539173228348
23286.1278.5193897637797.58061023622051
24358.2342.69938976377915.5006102362205
25346345.6074409448820.392559055118447
26329.9326.5769291338583.32307086614171
27334.3321.13590551181113.164094488189
28303.7308.34437007874-4.64437007874015
29307.6313.033858267717-5.43385826771652
30351.7360.051811023622-8.35181102362206
31324.6323.9538582677170.646141732283486
32311.9324.092834645669-12.1928346456693
33361.5361.773858267716-0.273858267716511
34271.1286.311811023622-15.211811023622
35286.5285.7697637795280.730236220472475
36352.8349.9497637795282.85023622047248
37322.4352.857814960630-30.4578149606296
38335333.8273031496061.17269685039369
39322.2328.386279527559-6.18627952755905
40313.6316.347303149606-2.74730314960627
41323.3319.5316732283463.76832677165357
42379.1366.54962598425212.5503740157481
43315.6329.699114173228-14.0991141732283
44353.6335.85856299212617.741437007874
45371.7373.539586614173-1.83958661417327
46282.9298.830098425197-15.9300984251969
47298.8297.5354921259841.26450787401573
48361.8361.7154921259840.0845078740157477
49365.9366.128661417323-0.228661417322606
50357.6346.34559055118111.2544094488188
51335.4341.657125984252-6.25712598425205
52340.1330.3707086614179.72929133858261
53337.8331.2974015748036.50259842519681
54389.6379.8204724409459.77952755905507
55342.5344.475078740158-1.97507874015756
56354.6346.8717322834657.72826771653537
57391.6384.5527559055127.04724409448812
58317.7311.3483858267726.35161417322822
59312.8312.3114566929140.488543307086506
60356.2376.491456692914-20.2914566929135

\begin{tabular}{lllllllll}
\hline
Multiple Linear Regression - Actuals, Interpolation, and Residuals \tabularnewline
Time or Index & Actuals & InterpolationForecast & ResidualsPrediction Error \tabularnewline
1 & 359 & 331.106692913387 & 27.8933070866129 \tabularnewline
2 & 304.6 & 312.82874015748 & -8.22874015748024 \tabularnewline
3 & 297.7 & 308.140275590551 & -10.4402755905512 \tabularnewline
4 & 303.3 & 295.34874015748 & 7.9512598425197 \tabularnewline
5 & 304.7 & 300.038228346457 & 4.66177165354334 \tabularnewline
6 & 331.3 & 347.808740157480 & -16.5087401574803 \tabularnewline
7 & 318.8 & 310.205669291339 & 8.59433070866145 \tabularnewline
8 & 306.8 & 311.097204724409 & -4.29720472440946 \tabularnewline
9 & 331.1 & 348.025669291339 & -16.9256692913386 \tabularnewline
10 & 284.1 & 272.563622047244 & 11.5363779527559 \tabularnewline
11 & 259.7 & 269.763897637795 & -10.0638976377952 \tabularnewline
12 & 335.8 & 333.943897637795 & 1.85610236220474 \tabularnewline
13 & 338.5 & 336.099389763779 & 2.40061023622085 \tabularnewline
14 & 310.3 & 317.821437007874 & -7.52143700787398 \tabularnewline
15 & 322.1 & 312.380413385827 & 9.71958661417329 \tabularnewline
16 & 289.3 & 299.588877952756 & -10.2888779527559 \tabularnewline
17 & 300.8 & 310.298838582677 & -9.4988385826772 \tabularnewline
18 & 360.6 & 358.069350393701 & 2.53064960629918 \tabularnewline
19 & 327.3 & 320.466279527559 & 6.8337204724409 \tabularnewline
20 & 304.1 & 313.079665354331 & -8.97966535433061 \tabularnewline
21 & 362 & 350.00812992126 & 11.9918700787402 \tabularnewline
22 & 287.8 & 274.546082677165 & 13.2539173228348 \tabularnewline
23 & 286.1 & 278.519389763779 & 7.58061023622051 \tabularnewline
24 & 358.2 & 342.699389763779 & 15.5006102362205 \tabularnewline
25 & 346 & 345.607440944882 & 0.392559055118447 \tabularnewline
26 & 329.9 & 326.576929133858 & 3.32307086614171 \tabularnewline
27 & 334.3 & 321.135905511811 & 13.164094488189 \tabularnewline
28 & 303.7 & 308.34437007874 & -4.64437007874015 \tabularnewline
29 & 307.6 & 313.033858267717 & -5.43385826771652 \tabularnewline
30 & 351.7 & 360.051811023622 & -8.35181102362206 \tabularnewline
31 & 324.6 & 323.953858267717 & 0.646141732283486 \tabularnewline
32 & 311.9 & 324.092834645669 & -12.1928346456693 \tabularnewline
33 & 361.5 & 361.773858267716 & -0.273858267716511 \tabularnewline
34 & 271.1 & 286.311811023622 & -15.211811023622 \tabularnewline
35 & 286.5 & 285.769763779528 & 0.730236220472475 \tabularnewline
36 & 352.8 & 349.949763779528 & 2.85023622047248 \tabularnewline
37 & 322.4 & 352.857814960630 & -30.4578149606296 \tabularnewline
38 & 335 & 333.827303149606 & 1.17269685039369 \tabularnewline
39 & 322.2 & 328.386279527559 & -6.18627952755905 \tabularnewline
40 & 313.6 & 316.347303149606 & -2.74730314960627 \tabularnewline
41 & 323.3 & 319.531673228346 & 3.76832677165357 \tabularnewline
42 & 379.1 & 366.549625984252 & 12.5503740157481 \tabularnewline
43 & 315.6 & 329.699114173228 & -14.0991141732283 \tabularnewline
44 & 353.6 & 335.858562992126 & 17.741437007874 \tabularnewline
45 & 371.7 & 373.539586614173 & -1.83958661417327 \tabularnewline
46 & 282.9 & 298.830098425197 & -15.9300984251969 \tabularnewline
47 & 298.8 & 297.535492125984 & 1.26450787401573 \tabularnewline
48 & 361.8 & 361.715492125984 & 0.0845078740157477 \tabularnewline
49 & 365.9 & 366.128661417323 & -0.228661417322606 \tabularnewline
50 & 357.6 & 346.345590551181 & 11.2544094488188 \tabularnewline
51 & 335.4 & 341.657125984252 & -6.25712598425205 \tabularnewline
52 & 340.1 & 330.370708661417 & 9.72929133858261 \tabularnewline
53 & 337.8 & 331.297401574803 & 6.50259842519681 \tabularnewline
54 & 389.6 & 379.820472440945 & 9.77952755905507 \tabularnewline
55 & 342.5 & 344.475078740158 & -1.97507874015756 \tabularnewline
56 & 354.6 & 346.871732283465 & 7.72826771653537 \tabularnewline
57 & 391.6 & 384.552755905512 & 7.04724409448812 \tabularnewline
58 & 317.7 & 311.348385826772 & 6.35161417322822 \tabularnewline
59 & 312.8 & 312.311456692914 & 0.488543307086506 \tabularnewline
60 & 356.2 & 376.491456692914 & -20.2914566929135 \tabularnewline
\hline
\end{tabular}
%Source: https://freestatistics.org/blog/index.php?pk=14394&T=4

[TABLE]
[ROW][C]Multiple Linear Regression - Actuals, Interpolation, and Residuals[/C][/ROW]
[ROW][C]Time or Index[/C][C]Actuals[/C][C]InterpolationForecast[/C][C]ResidualsPrediction Error[/C][/ROW]
[ROW][C]1[/C][C]359[/C][C]331.106692913387[/C][C]27.8933070866129[/C][/ROW]
[ROW][C]2[/C][C]304.6[/C][C]312.82874015748[/C][C]-8.22874015748024[/C][/ROW]
[ROW][C]3[/C][C]297.7[/C][C]308.140275590551[/C][C]-10.4402755905512[/C][/ROW]
[ROW][C]4[/C][C]303.3[/C][C]295.34874015748[/C][C]7.9512598425197[/C][/ROW]
[ROW][C]5[/C][C]304.7[/C][C]300.038228346457[/C][C]4.66177165354334[/C][/ROW]
[ROW][C]6[/C][C]331.3[/C][C]347.808740157480[/C][C]-16.5087401574803[/C][/ROW]
[ROW][C]7[/C][C]318.8[/C][C]310.205669291339[/C][C]8.59433070866145[/C][/ROW]
[ROW][C]8[/C][C]306.8[/C][C]311.097204724409[/C][C]-4.29720472440946[/C][/ROW]
[ROW][C]9[/C][C]331.1[/C][C]348.025669291339[/C][C]-16.9256692913386[/C][/ROW]
[ROW][C]10[/C][C]284.1[/C][C]272.563622047244[/C][C]11.5363779527559[/C][/ROW]
[ROW][C]11[/C][C]259.7[/C][C]269.763897637795[/C][C]-10.0638976377952[/C][/ROW]
[ROW][C]12[/C][C]335.8[/C][C]333.943897637795[/C][C]1.85610236220474[/C][/ROW]
[ROW][C]13[/C][C]338.5[/C][C]336.099389763779[/C][C]2.40061023622085[/C][/ROW]
[ROW][C]14[/C][C]310.3[/C][C]317.821437007874[/C][C]-7.52143700787398[/C][/ROW]
[ROW][C]15[/C][C]322.1[/C][C]312.380413385827[/C][C]9.71958661417329[/C][/ROW]
[ROW][C]16[/C][C]289.3[/C][C]299.588877952756[/C][C]-10.2888779527559[/C][/ROW]
[ROW][C]17[/C][C]300.8[/C][C]310.298838582677[/C][C]-9.4988385826772[/C][/ROW]
[ROW][C]18[/C][C]360.6[/C][C]358.069350393701[/C][C]2.53064960629918[/C][/ROW]
[ROW][C]19[/C][C]327.3[/C][C]320.466279527559[/C][C]6.8337204724409[/C][/ROW]
[ROW][C]20[/C][C]304.1[/C][C]313.079665354331[/C][C]-8.97966535433061[/C][/ROW]
[ROW][C]21[/C][C]362[/C][C]350.00812992126[/C][C]11.9918700787402[/C][/ROW]
[ROW][C]22[/C][C]287.8[/C][C]274.546082677165[/C][C]13.2539173228348[/C][/ROW]
[ROW][C]23[/C][C]286.1[/C][C]278.519389763779[/C][C]7.58061023622051[/C][/ROW]
[ROW][C]24[/C][C]358.2[/C][C]342.699389763779[/C][C]15.5006102362205[/C][/ROW]
[ROW][C]25[/C][C]346[/C][C]345.607440944882[/C][C]0.392559055118447[/C][/ROW]
[ROW][C]26[/C][C]329.9[/C][C]326.576929133858[/C][C]3.32307086614171[/C][/ROW]
[ROW][C]27[/C][C]334.3[/C][C]321.135905511811[/C][C]13.164094488189[/C][/ROW]
[ROW][C]28[/C][C]303.7[/C][C]308.34437007874[/C][C]-4.64437007874015[/C][/ROW]
[ROW][C]29[/C][C]307.6[/C][C]313.033858267717[/C][C]-5.43385826771652[/C][/ROW]
[ROW][C]30[/C][C]351.7[/C][C]360.051811023622[/C][C]-8.35181102362206[/C][/ROW]
[ROW][C]31[/C][C]324.6[/C][C]323.953858267717[/C][C]0.646141732283486[/C][/ROW]
[ROW][C]32[/C][C]311.9[/C][C]324.092834645669[/C][C]-12.1928346456693[/C][/ROW]
[ROW][C]33[/C][C]361.5[/C][C]361.773858267716[/C][C]-0.273858267716511[/C][/ROW]
[ROW][C]34[/C][C]271.1[/C][C]286.311811023622[/C][C]-15.211811023622[/C][/ROW]
[ROW][C]35[/C][C]286.5[/C][C]285.769763779528[/C][C]0.730236220472475[/C][/ROW]
[ROW][C]36[/C][C]352.8[/C][C]349.949763779528[/C][C]2.85023622047248[/C][/ROW]
[ROW][C]37[/C][C]322.4[/C][C]352.857814960630[/C][C]-30.4578149606296[/C][/ROW]
[ROW][C]38[/C][C]335[/C][C]333.827303149606[/C][C]1.17269685039369[/C][/ROW]
[ROW][C]39[/C][C]322.2[/C][C]328.386279527559[/C][C]-6.18627952755905[/C][/ROW]
[ROW][C]40[/C][C]313.6[/C][C]316.347303149606[/C][C]-2.74730314960627[/C][/ROW]
[ROW][C]41[/C][C]323.3[/C][C]319.531673228346[/C][C]3.76832677165357[/C][/ROW]
[ROW][C]42[/C][C]379.1[/C][C]366.549625984252[/C][C]12.5503740157481[/C][/ROW]
[ROW][C]43[/C][C]315.6[/C][C]329.699114173228[/C][C]-14.0991141732283[/C][/ROW]
[ROW][C]44[/C][C]353.6[/C][C]335.858562992126[/C][C]17.741437007874[/C][/ROW]
[ROW][C]45[/C][C]371.7[/C][C]373.539586614173[/C][C]-1.83958661417327[/C][/ROW]
[ROW][C]46[/C][C]282.9[/C][C]298.830098425197[/C][C]-15.9300984251969[/C][/ROW]
[ROW][C]47[/C][C]298.8[/C][C]297.535492125984[/C][C]1.26450787401573[/C][/ROW]
[ROW][C]48[/C][C]361.8[/C][C]361.715492125984[/C][C]0.0845078740157477[/C][/ROW]
[ROW][C]49[/C][C]365.9[/C][C]366.128661417323[/C][C]-0.228661417322606[/C][/ROW]
[ROW][C]50[/C][C]357.6[/C][C]346.345590551181[/C][C]11.2544094488188[/C][/ROW]
[ROW][C]51[/C][C]335.4[/C][C]341.657125984252[/C][C]-6.25712598425205[/C][/ROW]
[ROW][C]52[/C][C]340.1[/C][C]330.370708661417[/C][C]9.72929133858261[/C][/ROW]
[ROW][C]53[/C][C]337.8[/C][C]331.297401574803[/C][C]6.50259842519681[/C][/ROW]
[ROW][C]54[/C][C]389.6[/C][C]379.820472440945[/C][C]9.77952755905507[/C][/ROW]
[ROW][C]55[/C][C]342.5[/C][C]344.475078740158[/C][C]-1.97507874015756[/C][/ROW]
[ROW][C]56[/C][C]354.6[/C][C]346.871732283465[/C][C]7.72826771653537[/C][/ROW]
[ROW][C]57[/C][C]391.6[/C][C]384.552755905512[/C][C]7.04724409448812[/C][/ROW]
[ROW][C]58[/C][C]317.7[/C][C]311.348385826772[/C][C]6.35161417322822[/C][/ROW]
[ROW][C]59[/C][C]312.8[/C][C]312.311456692914[/C][C]0.488543307086506[/C][/ROW]
[ROW][C]60[/C][C]356.2[/C][C]376.491456692914[/C][C]-20.2914566929135[/C][/ROW]
[/TABLE]
Source: https://freestatistics.org/blog/index.php?pk=14394&T=4

Globally Unique Identifier (entire table): ba.freestatistics.org/blog/index.php?pk=14394&T=4

As an alternative you can also use a QR Code:  

The GUIDs for individual cells are displayed in the table below:

Multiple Linear Regression - Actuals, Interpolation, and Residuals
Time or IndexActualsInterpolationForecastResidualsPrediction Error
1359331.10669291338727.8933070866129
2304.6312.82874015748-8.22874015748024
3297.7308.140275590551-10.4402755905512
4303.3295.348740157487.9512598425197
5304.7300.0382283464574.66177165354334
6331.3347.808740157480-16.5087401574803
7318.8310.2056692913398.59433070866145
8306.8311.097204724409-4.29720472440946
9331.1348.025669291339-16.9256692913386
10284.1272.56362204724411.5363779527559
11259.7269.763897637795-10.0638976377952
12335.8333.9438976377951.85610236220474
13338.5336.0993897637792.40061023622085
14310.3317.821437007874-7.52143700787398
15322.1312.3804133858279.71958661417329
16289.3299.588877952756-10.2888779527559
17300.8310.298838582677-9.4988385826772
18360.6358.0693503937012.53064960629918
19327.3320.4662795275596.8337204724409
20304.1313.079665354331-8.97966535433061
21362350.0081299212611.9918700787402
22287.8274.54608267716513.2539173228348
23286.1278.5193897637797.58061023622051
24358.2342.69938976377915.5006102362205
25346345.6074409448820.392559055118447
26329.9326.5769291338583.32307086614171
27334.3321.13590551181113.164094488189
28303.7308.34437007874-4.64437007874015
29307.6313.033858267717-5.43385826771652
30351.7360.051811023622-8.35181102362206
31324.6323.9538582677170.646141732283486
32311.9324.092834645669-12.1928346456693
33361.5361.773858267716-0.273858267716511
34271.1286.311811023622-15.211811023622
35286.5285.7697637795280.730236220472475
36352.8349.9497637795282.85023622047248
37322.4352.857814960630-30.4578149606296
38335333.8273031496061.17269685039369
39322.2328.386279527559-6.18627952755905
40313.6316.347303149606-2.74730314960627
41323.3319.5316732283463.76832677165357
42379.1366.54962598425212.5503740157481
43315.6329.699114173228-14.0991141732283
44353.6335.85856299212617.741437007874
45371.7373.539586614173-1.83958661417327
46282.9298.830098425197-15.9300984251969
47298.8297.5354921259841.26450787401573
48361.8361.7154921259840.0845078740157477
49365.9366.128661417323-0.228661417322606
50357.6346.34559055118111.2544094488188
51335.4341.657125984252-6.25712598425205
52340.1330.3707086614179.72929133858261
53337.8331.2974015748036.50259842519681
54389.6379.8204724409459.77952755905507
55342.5344.475078740158-1.97507874015756
56354.6346.8717322834657.72826771653537
57391.6384.5527559055127.04724409448812
58317.7311.3483858267726.35161417322822
59312.8312.3114566929140.488543307086506
60356.2376.491456692914-20.2914566929135


Parameters (Session):
par1 = 1 ; par2 = Do not include Seasonal Dummies ; par3 = No Linear Trend ;
Parameters (R input):
par1 = 2 ; par2 = Include Monthly Dummies ; par3 = Linear Trend ;
R code (references can be found in the software module):
library(lattice)
par1 <- as.numeric(par1)
x <- t(y)
k <- length(x[1,])
n <- length(x[,1])
x1 <- cbind(x[,par1], x[,1:k!=par1])
mycolnames <- c(colnames(x)[par1], colnames(x)[1:k!=par1])
colnames(x1) <- mycolnames #colnames(x)[par1]
x <- x1
if (par3 == 'First Differences'){
x2 <- array(0, dim=c(n-1,k), dimnames=list(1:(n-1), paste('(1-B)',colnames(x),sep='')))
for (i in 1:n-1) {
for (j in 1:k) {
x2[i,j] <- x[i+1,j] - x[i,j]
}
}
x <- x2
}
if (par2 == 'Include Monthly Dummies'){
x2 <- array(0, dim=c(n,11), dimnames=list(1:n, paste('M', seq(1:11), sep ='')))
for (i in 1:11){
x2[seq(i,n,12),i] <- 1
}
x <- cbind(x, x2)
}
if (par2 == 'Include Quarterly Dummies'){
x2 <- array(0, dim=c(n,3), dimnames=list(1:n, paste('Q', seq(1:3), sep ='')))
for (i in 1:3){
x2[seq(i,n,4),i] <- 1
}
x <- cbind(x, x2)
}
k <- length(x[1,])
if (par3 == 'Linear Trend'){
x <- cbind(x, c(1:n))
colnames(x)[k+1] <- 't'
}
x
k <- length(x[1,])
df <- as.data.frame(x)
(mylm <- lm(df))
(mysum <- summary(mylm))
bitmap(file='test0.png')
plot(x[,1], type='l', main='Actuals and Interpolation', ylab='value of Actuals and Interpolation (dots)', xlab='time or index')
points(x[,1]-mysum$resid)
grid()
dev.off()
bitmap(file='test1.png')
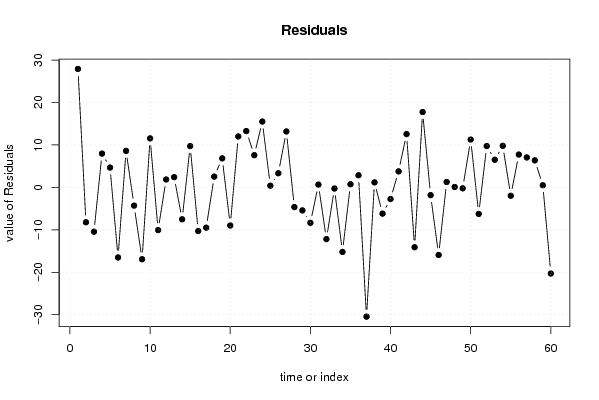
plot(mysum$resid, type='b', pch=19, main='Residuals', ylab='value of Residuals', xlab='time or index')
grid()
dev.off()
bitmap(file='test2.png')
hist(mysum$resid, main='Residual Histogram', xlab='values of Residuals')
grid()
dev.off()
bitmap(file='test3.png')
densityplot(~mysum$resid,col='black',main='Residual Density Plot', xlab='values of Residuals')
dev.off()
bitmap(file='test4.png')
qqnorm(mysum$resid, main='Residual Normal Q-Q Plot')
grid()
dev.off()
(myerror <- as.ts(mysum$resid))
bitmap(file='test5.png')
dum <- cbind(lag(myerror,k=1),myerror)
dum
dum1 <- dum[2:length(myerror),]
dum1
z <- as.data.frame(dum1)
z
plot(z,main=paste('Residual Lag plot, lowess, and regression line'), ylab='values of Residuals', xlab='lagged values of Residuals')
lines(lowess(z))
abline(lm(z))
grid()
dev.off()
bitmap(file='test6.png')
acf(mysum$resid, lag.max=length(mysum$resid)/2, main='Residual Autocorrelation Function')
grid()
dev.off()
bitmap(file='test7.png')
pacf(mysum$resid, lag.max=length(mysum$resid)/2, main='Residual Partial Autocorrelation Function')
grid()
dev.off()
bitmap(file='test8.png')
opar <- par(mfrow = c(2,2), oma = c(0, 0, 1.1, 0))
plot(mylm, las = 1, sub='Residual Diagnostics')
par(opar)
dev.off()
load(file='createtable')
a<-table.start()
a<-table.row.start(a)
a<-table.element(a, 'Multiple Linear Regression - Estimated Regression Equation', 1, TRUE)
a<-table.row.end(a)
myeq <- colnames(x)[1]
myeq <- paste(myeq, '[t] = ', sep='')
for (i in 1:k){
if (mysum$coefficients[i,1] > 0) myeq <- paste(myeq, '+', '')
myeq <- paste(myeq, mysum$coefficients[i,1], sep=' ')
if (rownames(mysum$coefficients)[i] != '(Intercept)') {
myeq <- paste(myeq, rownames(mysum$coefficients)[i], sep='')
if (rownames(mysum$coefficients)[i] != 't') myeq <- paste(myeq, '[t]', sep='')
}
}
myeq <- paste(myeq, ' + e[t]')
a<-table.row.start(a)
a<-table.element(a, myeq)
a<-table.row.end(a)
a<-table.end(a)
table.save(a,file='mytable1.tab')
a<-table.start()
a<-table.row.start(a)
a<-table.element(a,hyperlink('ols1.htm','Multiple Linear Regression - Ordinary Least Squares',''), 6, TRUE)
a<-table.row.end(a)
a<-table.row.start(a)
a<-table.element(a,'Variable',header=TRUE)
a<-table.element(a,'Parameter',header=TRUE)
a<-table.element(a,'S.D.',header=TRUE)
a<-table.element(a,'T-STAT
H0: parameter = 0',header=TRUE)
a<-table.element(a,'2-tail p-value',header=TRUE)
a<-table.element(a,'1-tail p-value',header=TRUE)
a<-table.row.end(a)
for (i in 1:k){
a<-table.row.start(a)
a<-table.element(a,rownames(mysum$coefficients)[i],header=TRUE)
a<-table.element(a,mysum$coefficients[i,1])
a<-table.element(a, round(mysum$coefficients[i,2],6))
a<-table.element(a, round(mysum$coefficients[i,3],4))
a<-table.element(a, round(mysum$coefficients[i,4],6))
a<-table.element(a, round(mysum$coefficients[i,4]/2,6))
a<-table.row.end(a)
}
a<-table.end(a)
table.save(a,file='mytable2.tab')
a<-table.start()
a<-table.row.start(a)
a<-table.element(a, 'Multiple Linear Regression - Regression Statistics', 2, TRUE)
a<-table.row.end(a)
a<-table.row.start(a)
a<-table.element(a, 'Multiple R',1,TRUE)
a<-table.element(a, sqrt(mysum$r.squared))
a<-table.row.end(a)
a<-table.row.start(a)
a<-table.element(a, 'R-squared',1,TRUE)
a<-table.element(a, mysum$r.squared)
a<-table.row.end(a)
a<-table.row.start(a)
a<-table.element(a, 'Adjusted R-squared',1,TRUE)
a<-table.element(a, mysum$adj.r.squared)
a<-table.row.end(a)
a<-table.row.start(a)
a<-table.element(a, 'F-TEST (value)',1,TRUE)
a<-table.element(a, mysum$fstatistic[1])
a<-table.row.end(a)
a<-table.row.start(a)
a<-table.element(a, 'F-TEST (DF numerator)',1,TRUE)
a<-table.element(a, mysum$fstatistic[2])
a<-table.row.end(a)
a<-table.row.start(a)
a<-table.element(a, 'F-TEST (DF denominator)',1,TRUE)
a<-table.element(a, mysum$fstatistic[3])
a<-table.row.end(a)
a<-table.row.start(a)
a<-table.element(a, 'p-value',1,TRUE)
a<-table.element(a, 1-pf(mysum$fstatistic[1],mysum$fstatistic[2],mysum$fstatistic[3]))
a<-table.row.end(a)
a<-table.row.start(a)
a<-table.element(a, 'Multiple Linear Regression - Residual Statistics', 2, TRUE)
a<-table.row.end(a)
a<-table.row.start(a)
a<-table.element(a, 'Residual Standard Deviation',1,TRUE)
a<-table.element(a, mysum$sigma)
a<-table.row.end(a)
a<-table.row.start(a)
a<-table.element(a, 'Sum Squared Residuals',1,TRUE)
a<-table.element(a, sum(myerror*myerror))
a<-table.row.end(a)
a<-table.end(a)
table.save(a,file='mytable3.tab')
a<-table.start()
a<-table.row.start(a)
a<-table.element(a, 'Multiple Linear Regression - Actuals, Interpolation, and Residuals', 4, TRUE)
a<-table.row.end(a)
a<-table.row.start(a)
a<-table.element(a, 'Time or Index', 1, TRUE)
a<-table.element(a, 'Actuals', 1, TRUE)
a<-table.element(a, 'Interpolation
Forecast', 1, TRUE)
a<-table.element(a, 'Residuals
Prediction Error', 1, TRUE)
a<-table.row.end(a)
for (i in 1:n) {
a<-table.row.start(a)
a<-table.element(a,i, 1, TRUE)
a<-table.element(a,x[i])
a<-table.element(a,x[i]-mysum$resid[i])
a<-table.element(a,mysum$resid[i])
a<-table.row.end(a)
}
a<-table.end(a)
table.save(a,file='mytable4.tab')