Free Statistics

of Irreproducible Research!

Author's title

Author*Unverified author*
R Software Modulerwasp_multipleregression.wasp
Title produced by softwareMultiple Regression
Date of computationTue, 18 Dec 2007 10:41:09 -0700
Cite this page as followsStatistical Computations at FreeStatistics.org, Office for Research Development and Education, URL https://freestatistics.org/blog/index.php?v=date/2007/Dec/18/t1197998658z72dduuh7vbwu9w.htm/, Retrieved Sat, 04 May 2024 18:59:15 +0000
Statistical Computations at FreeStatistics.org, Office for Research Development and Education, URL https://freestatistics.org/blog/index.php?pk=14392, Retrieved Sat, 04 May 2024 18:59:15 +0000
QR Codes:

Original text written by user:
IsPrivate?No (this computation is public)
User-defined keywords
Estimated Impact176
Family? (F = Feedback message, R = changed R code, M = changed R Module, P = changed Parameters, D = changed Data)
-       [Multiple Regression] [werkloosheid en i...] [2007-12-18 17:41:09] [151d9b972bcbe57745b80028e4bf0c5f] [Current]
Feedback Forum

Post a new message
Dataseries X:
8.1	359
8.3	304.6
8.2	297.7
8.1	303.3
7.7	304.7
7.6	331.3
7.7	318.8
8.2	306.8
8.4	331.1
8.4	284.1
8.6	259.7
8.4	335.8
8.5	338.5
8.7	310.3
8.7	322.1
8.6	289.3
7.4	300.8
7.3	360.6
7.4	327.3
9	304.1
9.2	362
9.2	287.8
8.5	286.1
8.3	358.2
8.3	346
8.6	329.9
8.6	334.3
8.5	303.7
8.1	307.6
8.1	351.7
8	324.6
8.6	311.9
8.7	361.5
8.7	271.1
8.6	286.5
8.4	352.8
8.4	322.4
8.7	335
8.7	322.2
8.5	313.6
8.3	323.3
8.3	379.1
8.3	315.6
8.1	353.6
8.2	371.7
8.1	282.9
8.1	298.8
7.9	361.8
7.7	365.9
8.1	357.6
8	335.4
7.7	340.1
7.8	337.8
7.6	389.6
7.4	342.5
7.7	354.6
7.8	391.6
7.5	317.7
7.2	312.8
7	356.2


Summary of compuational transaction
Raw Inputview raw input (R code)
Raw Outputview raw output of R engine
Computing time2 seconds
R Server'Gwilym Jenkins' @ 72.249.127.135

\begin{tabular}{lllllllll}
\hline
Summary of compuational transaction \tabularnewline
Raw Input & view raw input (R code)  \tabularnewline
Raw Output & view raw output of R engine  \tabularnewline
Computing time & 2 seconds \tabularnewline
R Server & 'Gwilym Jenkins' @ 72.249.127.135 \tabularnewline
\hline
\end{tabular}
%Source: https://freestatistics.org/blog/index.php?pk=14392&T=0

[TABLE]
[ROW][C]Summary of compuational transaction[/C][/ROW]
[ROW][C]Raw Input[/C][C]view raw input (R code) [/C][/ROW]
[ROW][C]Raw Output[/C][C]view raw output of R engine [/C][/ROW]
[ROW][C]Computing time[/C][C]2 seconds[/C][/ROW]
[ROW][C]R Server[/C][C]'Gwilym Jenkins' @ 72.249.127.135[/C][/ROW]
[/TABLE]
Source: https://freestatistics.org/blog/index.php?pk=14392&T=0

Globally Unique Identifier (entire table): ba.freestatistics.org/blog/index.php?pk=14392&T=0

As an alternative you can also use a QR Code:  

The GUIDs for individual cells are displayed in the table below:

Summary of compuational transaction
Raw Inputview raw input (R code)
Raw Outputview raw output of R engine
Computing time2 seconds
R Server'Gwilym Jenkins' @ 72.249.127.135


Multiple Linear Regression - Estimated Regression Equation
werkl[t] = + 11.2733558593295 -0.00898720362548001Iprod[t] + 0.109752313169581M1[t] + 0.222885921711642M2[t] + 0.139503708067787M3[t] -0.128586371679523M4[t] -0.502276293141087M5[t] -0.151493643504616M6[t] -0.49851200356862M7[t] + 0.0682543790177037M8[t] + 0.547008063529259M9[t] -0.202961986883062M10[t] -0.37961074167442M11[t] -0.00281201299111269t + e[t]

\begin{tabular}{lllllllll}
\hline
Multiple Linear Regression - Estimated Regression Equation \tabularnewline
werkl[t] =  +  11.2733558593295 -0.00898720362548001Iprod[t] +  0.109752313169581M1[t] +  0.222885921711642M2[t] +  0.139503708067787M3[t] -0.128586371679523M4[t] -0.502276293141087M5[t] -0.151493643504616M6[t] -0.49851200356862M7[t] +  0.0682543790177037M8[t] +  0.547008063529259M9[t] -0.202961986883062M10[t] -0.37961074167442M11[t] -0.00281201299111269t  + e[t] \tabularnewline
\hline
\end{tabular}
%Source: https://freestatistics.org/blog/index.php?pk=14392&T=1

[TABLE]
[ROW][C]Multiple Linear Regression - Estimated Regression Equation[/C][/ROW]
[ROW][C]werkl[t] =  +  11.2733558593295 -0.00898720362548001Iprod[t] +  0.109752313169581M1[t] +  0.222885921711642M2[t] +  0.139503708067787M3[t] -0.128586371679523M4[t] -0.502276293141087M5[t] -0.151493643504616M6[t] -0.49851200356862M7[t] +  0.0682543790177037M8[t] +  0.547008063529259M9[t] -0.202961986883062M10[t] -0.37961074167442M11[t] -0.00281201299111269t  + e[t][/C][/ROW]
[/TABLE]
Source: https://freestatistics.org/blog/index.php?pk=14392&T=1

Globally Unique Identifier (entire table): ba.freestatistics.org/blog/index.php?pk=14392&T=1

As an alternative you can also use a QR Code:  

The GUIDs for individual cells are displayed in the table below:

Multiple Linear Regression - Estimated Regression Equation
werkl[t] = + 11.2733558593295 -0.00898720362548001Iprod[t] + 0.109752313169581M1[t] + 0.222885921711642M2[t] + 0.139503708067787M3[t] -0.128586371679523M4[t] -0.502276293141087M5[t] -0.151493643504616M6[t] -0.49851200356862M7[t] + 0.0682543790177037M8[t] + 0.547008063529259M9[t] -0.202961986883062M10[t] -0.37961074167442M11[t] -0.00281201299111269t + e[t]


Multiple Linear Regression - Ordinary Least Squares
VariableParameterS.D.T-STATH0: parameter = 02-tail p-value1-tail p-value
(Intercept)11.27335585932951.6204466.956900
Iprod-0.008987203625480010.00492-1.82670.0742370.037119
M10.1097523131695810.2643880.41510.6799860.339993
M20.2228859217116420.2785080.80030.427660.21383
M30.1395037080677870.288730.48320.6312720.315636
M4-0.1285863716795230.320183-0.40160.6898360.344918
M5-0.5022762931410870.308896-1.6260.1107740.055387
M6-0.1514936435046160.271472-0.5580.5795190.289759
M7-0.498512003568620.286829-1.7380.08890.04445
M80.06825437901770370.2872680.23760.8132480.406624
M90.5470080635292590.2696672.02850.0483260.024163
M10-0.2029619868830620.405014-0.50110.6186740.309337
M11-0.379610741674420.407526-0.93150.3564590.178229
t-0.002812012991112690.004808-0.58490.5614740.280737

\begin{tabular}{lllllllll}
\hline
Multiple Linear Regression - Ordinary Least Squares \tabularnewline
Variable & Parameter & S.D. & T-STATH0: parameter = 0 & 2-tail p-value & 1-tail p-value \tabularnewline
(Intercept) & 11.2733558593295 & 1.620446 & 6.9569 & 0 & 0 \tabularnewline
Iprod & -0.00898720362548001 & 0.00492 & -1.8267 & 0.074237 & 0.037119 \tabularnewline
M1 & 0.109752313169581 & 0.264388 & 0.4151 & 0.679986 & 0.339993 \tabularnewline
M2 & 0.222885921711642 & 0.278508 & 0.8003 & 0.42766 & 0.21383 \tabularnewline
M3 & 0.139503708067787 & 0.28873 & 0.4832 & 0.631272 & 0.315636 \tabularnewline
M4 & -0.128586371679523 & 0.320183 & -0.4016 & 0.689836 & 0.344918 \tabularnewline
M5 & -0.502276293141087 & 0.308896 & -1.626 & 0.110774 & 0.055387 \tabularnewline
M6 & -0.151493643504616 & 0.271472 & -0.558 & 0.579519 & 0.289759 \tabularnewline
M7 & -0.49851200356862 & 0.286829 & -1.738 & 0.0889 & 0.04445 \tabularnewline
M8 & 0.0682543790177037 & 0.287268 & 0.2376 & 0.813248 & 0.406624 \tabularnewline
M9 & 0.547008063529259 & 0.269667 & 2.0285 & 0.048326 & 0.024163 \tabularnewline
M10 & -0.202961986883062 & 0.405014 & -0.5011 & 0.618674 & 0.309337 \tabularnewline
M11 & -0.37961074167442 & 0.407526 & -0.9315 & 0.356459 & 0.178229 \tabularnewline
t & -0.00281201299111269 & 0.004808 & -0.5849 & 0.561474 & 0.280737 \tabularnewline
\hline
\end{tabular}
%Source: https://freestatistics.org/blog/index.php?pk=14392&T=2

[TABLE]
[ROW][C]Multiple Linear Regression - Ordinary Least Squares[/C][/ROW]
[ROW][C]Variable[/C][C]Parameter[/C][C]S.D.[/C][C]T-STATH0: parameter = 0[/C][C]2-tail p-value[/C][C]1-tail p-value[/C][/ROW]
[ROW][C](Intercept)[/C][C]11.2733558593295[/C][C]1.620446[/C][C]6.9569[/C][C]0[/C][C]0[/C][/ROW]
[ROW][C]Iprod[/C][C]-0.00898720362548001[/C][C]0.00492[/C][C]-1.8267[/C][C]0.074237[/C][C]0.037119[/C][/ROW]
[ROW][C]M1[/C][C]0.109752313169581[/C][C]0.264388[/C][C]0.4151[/C][C]0.679986[/C][C]0.339993[/C][/ROW]
[ROW][C]M2[/C][C]0.222885921711642[/C][C]0.278508[/C][C]0.8003[/C][C]0.42766[/C][C]0.21383[/C][/ROW]
[ROW][C]M3[/C][C]0.139503708067787[/C][C]0.28873[/C][C]0.4832[/C][C]0.631272[/C][C]0.315636[/C][/ROW]
[ROW][C]M4[/C][C]-0.128586371679523[/C][C]0.320183[/C][C]-0.4016[/C][C]0.689836[/C][C]0.344918[/C][/ROW]
[ROW][C]M5[/C][C]-0.502276293141087[/C][C]0.308896[/C][C]-1.626[/C][C]0.110774[/C][C]0.055387[/C][/ROW]
[ROW][C]M6[/C][C]-0.151493643504616[/C][C]0.271472[/C][C]-0.558[/C][C]0.579519[/C][C]0.289759[/C][/ROW]
[ROW][C]M7[/C][C]-0.49851200356862[/C][C]0.286829[/C][C]-1.738[/C][C]0.0889[/C][C]0.04445[/C][/ROW]
[ROW][C]M8[/C][C]0.0682543790177037[/C][C]0.287268[/C][C]0.2376[/C][C]0.813248[/C][C]0.406624[/C][/ROW]
[ROW][C]M9[/C][C]0.547008063529259[/C][C]0.269667[/C][C]2.0285[/C][C]0.048326[/C][C]0.024163[/C][/ROW]
[ROW][C]M10[/C][C]-0.202961986883062[/C][C]0.405014[/C][C]-0.5011[/C][C]0.618674[/C][C]0.309337[/C][/ROW]
[ROW][C]M11[/C][C]-0.37961074167442[/C][C]0.407526[/C][C]-0.9315[/C][C]0.356459[/C][C]0.178229[/C][/ROW]
[ROW][C]t[/C][C]-0.00281201299111269[/C][C]0.004808[/C][C]-0.5849[/C][C]0.561474[/C][C]0.280737[/C][/ROW]
[/TABLE]
Source: https://freestatistics.org/blog/index.php?pk=14392&T=2

Globally Unique Identifier (entire table): ba.freestatistics.org/blog/index.php?pk=14392&T=2

As an alternative you can also use a QR Code:  

The GUIDs for individual cells are displayed in the table below:

Multiple Linear Regression - Ordinary Least Squares
VariableParameterS.D.T-STATH0: parameter = 02-tail p-value1-tail p-value
(Intercept)11.27335585932951.6204466.956900
Iprod-0.008987203625480010.00492-1.82670.0742370.037119
M10.1097523131695810.2643880.41510.6799860.339993
M20.2228859217116420.2785080.80030.427660.21383
M30.1395037080677870.288730.48320.6312720.315636
M4-0.1285863716795230.320183-0.40160.6898360.344918
M5-0.5022762931410870.308896-1.6260.1107740.055387
M6-0.1514936435046160.271472-0.5580.5795190.289759
M7-0.498512003568620.286829-1.7380.08890.04445
M80.06825437901770370.2872680.23760.8132480.406624
M90.5470080635292590.2696672.02850.0483260.024163
M10-0.2029619868830620.405014-0.50110.6186740.309337
M11-0.379610741674420.407526-0.93150.3564590.178229
t-0.002812012991112690.004808-0.58490.5614740.280737


Multiple Linear Regression - Regression Statistics
Multiple R0.657206628108399
R-squared0.431920552029611
Adjusted R-squared0.271376360211893
F-TEST (value)2.69035302454300
F-TEST (DF numerator)13
F-TEST (DF denominator)46
p-value0.00676045586162599
Multiple Linear Regression - Residual Statistics
Residual Standard Deviation0.414257639036294
Sum Squared Residuals7.89403200899652

\begin{tabular}{lllllllll}
\hline
Multiple Linear Regression - Regression Statistics \tabularnewline
Multiple R & 0.657206628108399 \tabularnewline
R-squared & 0.431920552029611 \tabularnewline
Adjusted R-squared & 0.271376360211893 \tabularnewline
F-TEST (value) & 2.69035302454300 \tabularnewline
F-TEST (DF numerator) & 13 \tabularnewline
F-TEST (DF denominator) & 46 \tabularnewline
p-value & 0.00676045586162599 \tabularnewline
Multiple Linear Regression - Residual Statistics \tabularnewline
Residual Standard Deviation & 0.414257639036294 \tabularnewline
Sum Squared Residuals & 7.89403200899652 \tabularnewline
\hline
\end{tabular}
%Source: https://freestatistics.org/blog/index.php?pk=14392&T=3

[TABLE]
[ROW][C]Multiple Linear Regression - Regression Statistics[/C][/ROW]
[ROW][C]Multiple R[/C][C]0.657206628108399[/C][/ROW]
[ROW][C]R-squared[/C][C]0.431920552029611[/C][/ROW]
[ROW][C]Adjusted R-squared[/C][C]0.271376360211893[/C][/ROW]
[ROW][C]F-TEST (value)[/C][C]2.69035302454300[/C][/ROW]
[ROW][C]F-TEST (DF numerator)[/C][C]13[/C][/ROW]
[ROW][C]F-TEST (DF denominator)[/C][C]46[/C][/ROW]
[ROW][C]p-value[/C][C]0.00676045586162599[/C][/ROW]
[ROW][C]Multiple Linear Regression - Residual Statistics[/C][/ROW]
[ROW][C]Residual Standard Deviation[/C][C]0.414257639036294[/C][/ROW]
[ROW][C]Sum Squared Residuals[/C][C]7.89403200899652[/C][/ROW]
[/TABLE]
Source: https://freestatistics.org/blog/index.php?pk=14392&T=3

Globally Unique Identifier (entire table): ba.freestatistics.org/blog/index.php?pk=14392&T=3

As an alternative you can also use a QR Code:  

The GUIDs for individual cells are displayed in the table below:

Multiple Linear Regression - Regression Statistics
Multiple R0.657206628108399
R-squared0.431920552029611
Adjusted R-squared0.271376360211893
F-TEST (value)2.69035302454300
F-TEST (DF numerator)13
F-TEST (DF denominator)46
p-value0.00676045586162599
Multiple Linear Regression - Residual Statistics
Residual Standard Deviation0.414257639036294
Sum Squared Residuals7.89403200899652


Multiple Linear Regression - Actuals, Interpolation, and Residuals
Time or IndexActualsInterpolationForecastResidualsPrediction Error
18.18.15389005796068-0.0538900579606841
28.38.75311553073769-0.453115530737686
38.28.72893300911853-0.528933009118533
48.18.40770257607742-0.307702576077421
57.78.01861855654907-0.318618556549072
67.68.12752957675666-0.527529576756662
77.77.89003924902005-0.190039249020046
88.28.56184006212102-0.361840062121017
98.48.8193926855423-0.419392685542295
108.48.48900919253642-0.0890091925364214
118.68.528836193215660.0711638067843368
128.48.221708725999940.178291274000059
138.58.304383576389610.195616423610387
148.78.66814431417910.0318556858209007
158.78.475901084763470.224098915236533
168.68.499779270940790.100220729059211
177.48.0199244947951-0.619924494795091
187.37.83046035463675-0.530460354636745
197.47.77990386231011-0.379903862310113
2098.552361356016460.44763864398354
219.28.507943937621610.692056062378389
229.28.422012383228790.777987616771206
238.58.257829861609640.242170138390362
248.37.986651208895840.313348791104163
258.38.203235393305160.0967646066948395
268.68.458250967226340.141749032773661
278.68.332513044639260.267486955360741
288.58.336619382840520.163380617159476
298.17.925067354248480.174932645751524
308.17.876702311010170.223297688989835
3187.770425156205560.229574843794443
328.68.448517011844360.151482988155635
338.78.4786933835410.221306616459001
348.78.538354527880960.161645472119042
358.68.22049082426610.379509175733905
368.48.001437952580080.398562047419923
378.48.381589242973140.0184107570268628
388.78.378672072843040.321327927156961
398.78.407514052614210.292485947385785
408.58.213901911054920.286098088945080
418.37.750224101435090.549775898564914
428.37.596708775778660.703291224221341
438.37.817565832941520.482434167058476
448.18.04000646476850.0599935352315046
458.28.35327975066775-0.153279750667751
468.18.39856136920694-0.298561369206942
478.18.076204063779340.0237959362206616
487.97.88680896405740.0131910359425956
497.77.9569017293714-0.256901729371404
508.18.14181711501384-0.0418171150138374
5188.25513880886453-0.255138808864526
527.77.94199685908635-0.241996859086347
537.87.586165492972270.213834507027725
547.67.468598981817770.131401018182232
557.47.54206589952276-0.14206589952276
567.77.99727510524966-0.297275105249663
577.88.14069024262735-0.340690242627345
587.58.05206252714688-0.552062527146885
597.27.91663905712927-0.716639057129265
6077.90339314846674-0.90339314846674

\begin{tabular}{lllllllll}
\hline
Multiple Linear Regression - Actuals, Interpolation, and Residuals \tabularnewline
Time or Index & Actuals & InterpolationForecast & ResidualsPrediction Error \tabularnewline
1 & 8.1 & 8.15389005796068 & -0.0538900579606841 \tabularnewline
2 & 8.3 & 8.75311553073769 & -0.453115530737686 \tabularnewline
3 & 8.2 & 8.72893300911853 & -0.528933009118533 \tabularnewline
4 & 8.1 & 8.40770257607742 & -0.307702576077421 \tabularnewline
5 & 7.7 & 8.01861855654907 & -0.318618556549072 \tabularnewline
6 & 7.6 & 8.12752957675666 & -0.527529576756662 \tabularnewline
7 & 7.7 & 7.89003924902005 & -0.190039249020046 \tabularnewline
8 & 8.2 & 8.56184006212102 & -0.361840062121017 \tabularnewline
9 & 8.4 & 8.8193926855423 & -0.419392685542295 \tabularnewline
10 & 8.4 & 8.48900919253642 & -0.0890091925364214 \tabularnewline
11 & 8.6 & 8.52883619321566 & 0.0711638067843368 \tabularnewline
12 & 8.4 & 8.22170872599994 & 0.178291274000059 \tabularnewline
13 & 8.5 & 8.30438357638961 & 0.195616423610387 \tabularnewline
14 & 8.7 & 8.6681443141791 & 0.0318556858209007 \tabularnewline
15 & 8.7 & 8.47590108476347 & 0.224098915236533 \tabularnewline
16 & 8.6 & 8.49977927094079 & 0.100220729059211 \tabularnewline
17 & 7.4 & 8.0199244947951 & -0.619924494795091 \tabularnewline
18 & 7.3 & 7.83046035463675 & -0.530460354636745 \tabularnewline
19 & 7.4 & 7.77990386231011 & -0.379903862310113 \tabularnewline
20 & 9 & 8.55236135601646 & 0.44763864398354 \tabularnewline
21 & 9.2 & 8.50794393762161 & 0.692056062378389 \tabularnewline
22 & 9.2 & 8.42201238322879 & 0.777987616771206 \tabularnewline
23 & 8.5 & 8.25782986160964 & 0.242170138390362 \tabularnewline
24 & 8.3 & 7.98665120889584 & 0.313348791104163 \tabularnewline
25 & 8.3 & 8.20323539330516 & 0.0967646066948395 \tabularnewline
26 & 8.6 & 8.45825096722634 & 0.141749032773661 \tabularnewline
27 & 8.6 & 8.33251304463926 & 0.267486955360741 \tabularnewline
28 & 8.5 & 8.33661938284052 & 0.163380617159476 \tabularnewline
29 & 8.1 & 7.92506735424848 & 0.174932645751524 \tabularnewline
30 & 8.1 & 7.87670231101017 & 0.223297688989835 \tabularnewline
31 & 8 & 7.77042515620556 & 0.229574843794443 \tabularnewline
32 & 8.6 & 8.44851701184436 & 0.151482988155635 \tabularnewline
33 & 8.7 & 8.478693383541 & 0.221306616459001 \tabularnewline
34 & 8.7 & 8.53835452788096 & 0.161645472119042 \tabularnewline
35 & 8.6 & 8.2204908242661 & 0.379509175733905 \tabularnewline
36 & 8.4 & 8.00143795258008 & 0.398562047419923 \tabularnewline
37 & 8.4 & 8.38158924297314 & 0.0184107570268628 \tabularnewline
38 & 8.7 & 8.37867207284304 & 0.321327927156961 \tabularnewline
39 & 8.7 & 8.40751405261421 & 0.292485947385785 \tabularnewline
40 & 8.5 & 8.21390191105492 & 0.286098088945080 \tabularnewline
41 & 8.3 & 7.75022410143509 & 0.549775898564914 \tabularnewline
42 & 8.3 & 7.59670877577866 & 0.703291224221341 \tabularnewline
43 & 8.3 & 7.81756583294152 & 0.482434167058476 \tabularnewline
44 & 8.1 & 8.0400064647685 & 0.0599935352315046 \tabularnewline
45 & 8.2 & 8.35327975066775 & -0.153279750667751 \tabularnewline
46 & 8.1 & 8.39856136920694 & -0.298561369206942 \tabularnewline
47 & 8.1 & 8.07620406377934 & 0.0237959362206616 \tabularnewline
48 & 7.9 & 7.8868089640574 & 0.0131910359425956 \tabularnewline
49 & 7.7 & 7.9569017293714 & -0.256901729371404 \tabularnewline
50 & 8.1 & 8.14181711501384 & -0.0418171150138374 \tabularnewline
51 & 8 & 8.25513880886453 & -0.255138808864526 \tabularnewline
52 & 7.7 & 7.94199685908635 & -0.241996859086347 \tabularnewline
53 & 7.8 & 7.58616549297227 & 0.213834507027725 \tabularnewline
54 & 7.6 & 7.46859898181777 & 0.131401018182232 \tabularnewline
55 & 7.4 & 7.54206589952276 & -0.14206589952276 \tabularnewline
56 & 7.7 & 7.99727510524966 & -0.297275105249663 \tabularnewline
57 & 7.8 & 8.14069024262735 & -0.340690242627345 \tabularnewline
58 & 7.5 & 8.05206252714688 & -0.552062527146885 \tabularnewline
59 & 7.2 & 7.91663905712927 & -0.716639057129265 \tabularnewline
60 & 7 & 7.90339314846674 & -0.90339314846674 \tabularnewline
\hline
\end{tabular}
%Source: https://freestatistics.org/blog/index.php?pk=14392&T=4

[TABLE]
[ROW][C]Multiple Linear Regression - Actuals, Interpolation, and Residuals[/C][/ROW]
[ROW][C]Time or Index[/C][C]Actuals[/C][C]InterpolationForecast[/C][C]ResidualsPrediction Error[/C][/ROW]
[ROW][C]1[/C][C]8.1[/C][C]8.15389005796068[/C][C]-0.0538900579606841[/C][/ROW]
[ROW][C]2[/C][C]8.3[/C][C]8.75311553073769[/C][C]-0.453115530737686[/C][/ROW]
[ROW][C]3[/C][C]8.2[/C][C]8.72893300911853[/C][C]-0.528933009118533[/C][/ROW]
[ROW][C]4[/C][C]8.1[/C][C]8.40770257607742[/C][C]-0.307702576077421[/C][/ROW]
[ROW][C]5[/C][C]7.7[/C][C]8.01861855654907[/C][C]-0.318618556549072[/C][/ROW]
[ROW][C]6[/C][C]7.6[/C][C]8.12752957675666[/C][C]-0.527529576756662[/C][/ROW]
[ROW][C]7[/C][C]7.7[/C][C]7.89003924902005[/C][C]-0.190039249020046[/C][/ROW]
[ROW][C]8[/C][C]8.2[/C][C]8.56184006212102[/C][C]-0.361840062121017[/C][/ROW]
[ROW][C]9[/C][C]8.4[/C][C]8.8193926855423[/C][C]-0.419392685542295[/C][/ROW]
[ROW][C]10[/C][C]8.4[/C][C]8.48900919253642[/C][C]-0.0890091925364214[/C][/ROW]
[ROW][C]11[/C][C]8.6[/C][C]8.52883619321566[/C][C]0.0711638067843368[/C][/ROW]
[ROW][C]12[/C][C]8.4[/C][C]8.22170872599994[/C][C]0.178291274000059[/C][/ROW]
[ROW][C]13[/C][C]8.5[/C][C]8.30438357638961[/C][C]0.195616423610387[/C][/ROW]
[ROW][C]14[/C][C]8.7[/C][C]8.6681443141791[/C][C]0.0318556858209007[/C][/ROW]
[ROW][C]15[/C][C]8.7[/C][C]8.47590108476347[/C][C]0.224098915236533[/C][/ROW]
[ROW][C]16[/C][C]8.6[/C][C]8.49977927094079[/C][C]0.100220729059211[/C][/ROW]
[ROW][C]17[/C][C]7.4[/C][C]8.0199244947951[/C][C]-0.619924494795091[/C][/ROW]
[ROW][C]18[/C][C]7.3[/C][C]7.83046035463675[/C][C]-0.530460354636745[/C][/ROW]
[ROW][C]19[/C][C]7.4[/C][C]7.77990386231011[/C][C]-0.379903862310113[/C][/ROW]
[ROW][C]20[/C][C]9[/C][C]8.55236135601646[/C][C]0.44763864398354[/C][/ROW]
[ROW][C]21[/C][C]9.2[/C][C]8.50794393762161[/C][C]0.692056062378389[/C][/ROW]
[ROW][C]22[/C][C]9.2[/C][C]8.42201238322879[/C][C]0.777987616771206[/C][/ROW]
[ROW][C]23[/C][C]8.5[/C][C]8.25782986160964[/C][C]0.242170138390362[/C][/ROW]
[ROW][C]24[/C][C]8.3[/C][C]7.98665120889584[/C][C]0.313348791104163[/C][/ROW]
[ROW][C]25[/C][C]8.3[/C][C]8.20323539330516[/C][C]0.0967646066948395[/C][/ROW]
[ROW][C]26[/C][C]8.6[/C][C]8.45825096722634[/C][C]0.141749032773661[/C][/ROW]
[ROW][C]27[/C][C]8.6[/C][C]8.33251304463926[/C][C]0.267486955360741[/C][/ROW]
[ROW][C]28[/C][C]8.5[/C][C]8.33661938284052[/C][C]0.163380617159476[/C][/ROW]
[ROW][C]29[/C][C]8.1[/C][C]7.92506735424848[/C][C]0.174932645751524[/C][/ROW]
[ROW][C]30[/C][C]8.1[/C][C]7.87670231101017[/C][C]0.223297688989835[/C][/ROW]
[ROW][C]31[/C][C]8[/C][C]7.77042515620556[/C][C]0.229574843794443[/C][/ROW]
[ROW][C]32[/C][C]8.6[/C][C]8.44851701184436[/C][C]0.151482988155635[/C][/ROW]
[ROW][C]33[/C][C]8.7[/C][C]8.478693383541[/C][C]0.221306616459001[/C][/ROW]
[ROW][C]34[/C][C]8.7[/C][C]8.53835452788096[/C][C]0.161645472119042[/C][/ROW]
[ROW][C]35[/C][C]8.6[/C][C]8.2204908242661[/C][C]0.379509175733905[/C][/ROW]
[ROW][C]36[/C][C]8.4[/C][C]8.00143795258008[/C][C]0.398562047419923[/C][/ROW]
[ROW][C]37[/C][C]8.4[/C][C]8.38158924297314[/C][C]0.0184107570268628[/C][/ROW]
[ROW][C]38[/C][C]8.7[/C][C]8.37867207284304[/C][C]0.321327927156961[/C][/ROW]
[ROW][C]39[/C][C]8.7[/C][C]8.40751405261421[/C][C]0.292485947385785[/C][/ROW]
[ROW][C]40[/C][C]8.5[/C][C]8.21390191105492[/C][C]0.286098088945080[/C][/ROW]
[ROW][C]41[/C][C]8.3[/C][C]7.75022410143509[/C][C]0.549775898564914[/C][/ROW]
[ROW][C]42[/C][C]8.3[/C][C]7.59670877577866[/C][C]0.703291224221341[/C][/ROW]
[ROW][C]43[/C][C]8.3[/C][C]7.81756583294152[/C][C]0.482434167058476[/C][/ROW]
[ROW][C]44[/C][C]8.1[/C][C]8.0400064647685[/C][C]0.0599935352315046[/C][/ROW]
[ROW][C]45[/C][C]8.2[/C][C]8.35327975066775[/C][C]-0.153279750667751[/C][/ROW]
[ROW][C]46[/C][C]8.1[/C][C]8.39856136920694[/C][C]-0.298561369206942[/C][/ROW]
[ROW][C]47[/C][C]8.1[/C][C]8.07620406377934[/C][C]0.0237959362206616[/C][/ROW]
[ROW][C]48[/C][C]7.9[/C][C]7.8868089640574[/C][C]0.0131910359425956[/C][/ROW]
[ROW][C]49[/C][C]7.7[/C][C]7.9569017293714[/C][C]-0.256901729371404[/C][/ROW]
[ROW][C]50[/C][C]8.1[/C][C]8.14181711501384[/C][C]-0.0418171150138374[/C][/ROW]
[ROW][C]51[/C][C]8[/C][C]8.25513880886453[/C][C]-0.255138808864526[/C][/ROW]
[ROW][C]52[/C][C]7.7[/C][C]7.94199685908635[/C][C]-0.241996859086347[/C][/ROW]
[ROW][C]53[/C][C]7.8[/C][C]7.58616549297227[/C][C]0.213834507027725[/C][/ROW]
[ROW][C]54[/C][C]7.6[/C][C]7.46859898181777[/C][C]0.131401018182232[/C][/ROW]
[ROW][C]55[/C][C]7.4[/C][C]7.54206589952276[/C][C]-0.14206589952276[/C][/ROW]
[ROW][C]56[/C][C]7.7[/C][C]7.99727510524966[/C][C]-0.297275105249663[/C][/ROW]
[ROW][C]57[/C][C]7.8[/C][C]8.14069024262735[/C][C]-0.340690242627345[/C][/ROW]
[ROW][C]58[/C][C]7.5[/C][C]8.05206252714688[/C][C]-0.552062527146885[/C][/ROW]
[ROW][C]59[/C][C]7.2[/C][C]7.91663905712927[/C][C]-0.716639057129265[/C][/ROW]
[ROW][C]60[/C][C]7[/C][C]7.90339314846674[/C][C]-0.90339314846674[/C][/ROW]
[/TABLE]
Source: https://freestatistics.org/blog/index.php?pk=14392&T=4

Globally Unique Identifier (entire table): ba.freestatistics.org/blog/index.php?pk=14392&T=4

As an alternative you can also use a QR Code:  

The GUIDs for individual cells are displayed in the table below:

Multiple Linear Regression - Actuals, Interpolation, and Residuals
Time or IndexActualsInterpolationForecastResidualsPrediction Error
18.18.15389005796068-0.0538900579606841
28.38.75311553073769-0.453115530737686
38.28.72893300911853-0.528933009118533
48.18.40770257607742-0.307702576077421
57.78.01861855654907-0.318618556549072
67.68.12752957675666-0.527529576756662
77.77.89003924902005-0.190039249020046
88.28.56184006212102-0.361840062121017
98.48.8193926855423-0.419392685542295
108.48.48900919253642-0.0890091925364214
118.68.528836193215660.0711638067843368
128.48.221708725999940.178291274000059
138.58.304383576389610.195616423610387
148.78.66814431417910.0318556858209007
158.78.475901084763470.224098915236533
168.68.499779270940790.100220729059211
177.48.0199244947951-0.619924494795091
187.37.83046035463675-0.530460354636745
197.47.77990386231011-0.379903862310113
2098.552361356016460.44763864398354
219.28.507943937621610.692056062378389
229.28.422012383228790.777987616771206
238.58.257829861609640.242170138390362
248.37.986651208895840.313348791104163
258.38.203235393305160.0967646066948395
268.68.458250967226340.141749032773661
278.68.332513044639260.267486955360741
288.58.336619382840520.163380617159476
298.17.925067354248480.174932645751524
308.17.876702311010170.223297688989835
3187.770425156205560.229574843794443
328.68.448517011844360.151482988155635
338.78.4786933835410.221306616459001
348.78.538354527880960.161645472119042
358.68.22049082426610.379509175733905
368.48.001437952580080.398562047419923
378.48.381589242973140.0184107570268628
388.78.378672072843040.321327927156961
398.78.407514052614210.292485947385785
408.58.213901911054920.286098088945080
418.37.750224101435090.549775898564914
428.37.596708775778660.703291224221341
438.37.817565832941520.482434167058476
448.18.04000646476850.0599935352315046
458.28.35327975066775-0.153279750667751
468.18.39856136920694-0.298561369206942
478.18.076204063779340.0237959362206616
487.97.88680896405740.0131910359425956
497.77.9569017293714-0.256901729371404
508.18.14181711501384-0.0418171150138374
5188.25513880886453-0.255138808864526
527.77.94199685908635-0.241996859086347
537.87.586165492972270.213834507027725
547.67.468598981817770.131401018182232
557.47.54206589952276-0.14206589952276
567.77.99727510524966-0.297275105249663
577.88.14069024262735-0.340690242627345
587.58.05206252714688-0.552062527146885
597.27.91663905712927-0.716639057129265
6077.90339314846674-0.90339314846674


Parameters (Session):
par1 = 1 ; par2 = Do not include Seasonal Dummies ; par3 = No Linear Trend ;
Parameters (R input):
par1 = 1 ; par2 = Include Monthly Dummies ; par3 = Linear Trend ;
R code (references can be found in the software module):
library(lattice)
par1 <- as.numeric(par1)
x <- t(y)
k <- length(x[1,])
n <- length(x[,1])
x1 <- cbind(x[,par1], x[,1:k!=par1])
mycolnames <- c(colnames(x)[par1], colnames(x)[1:k!=par1])
colnames(x1) <- mycolnames #colnames(x)[par1]
x <- x1
if (par3 == 'First Differences'){
x2 <- array(0, dim=c(n-1,k), dimnames=list(1:(n-1), paste('(1-B)',colnames(x),sep='')))
for (i in 1:n-1) {
for (j in 1:k) {
x2[i,j] <- x[i+1,j] - x[i,j]
}
}
x <- x2
}
if (par2 == 'Include Monthly Dummies'){
x2 <- array(0, dim=c(n,11), dimnames=list(1:n, paste('M', seq(1:11), sep ='')))
for (i in 1:11){
x2[seq(i,n,12),i] <- 1
}
x <- cbind(x, x2)
}
if (par2 == 'Include Quarterly Dummies'){
x2 <- array(0, dim=c(n,3), dimnames=list(1:n, paste('Q', seq(1:3), sep ='')))
for (i in 1:3){
x2[seq(i,n,4),i] <- 1
}
x <- cbind(x, x2)
}
k <- length(x[1,])
if (par3 == 'Linear Trend'){
x <- cbind(x, c(1:n))
colnames(x)[k+1] <- 't'
}
x
k <- length(x[1,])
df <- as.data.frame(x)
(mylm <- lm(df))
(mysum <- summary(mylm))
bitmap(file='test0.png')
plot(x[,1], type='l', main='Actuals and Interpolation', ylab='value of Actuals and Interpolation (dots)', xlab='time or index')
points(x[,1]-mysum$resid)
grid()
dev.off()
bitmap(file='test1.png')
plot(mysum$resid, type='b', pch=19, main='Residuals', ylab='value of Residuals', xlab='time or index')
grid()
dev.off()
bitmap(file='test2.png')
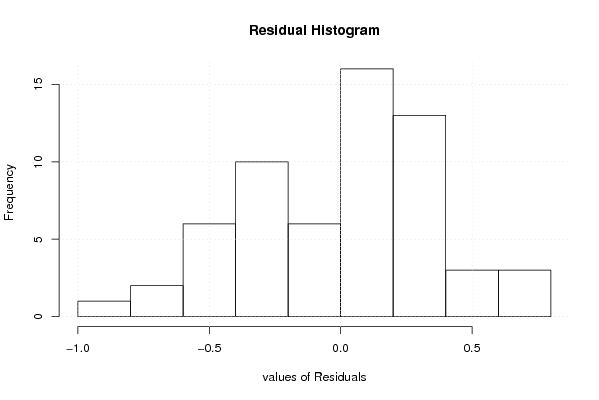
hist(mysum$resid, main='Residual Histogram', xlab='values of Residuals')
grid()
dev.off()
bitmap(file='test3.png')
densityplot(~mysum$resid,col='black',main='Residual Density Plot', xlab='values of Residuals')
dev.off()
bitmap(file='test4.png')
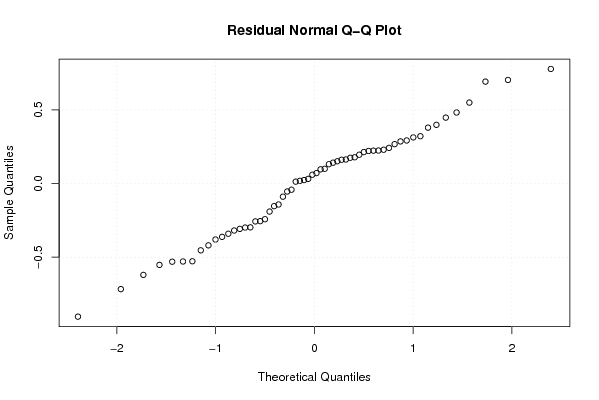
qqnorm(mysum$resid, main='Residual Normal Q-Q Plot')
grid()
dev.off()
(myerror <- as.ts(mysum$resid))
bitmap(file='test5.png')
dum <- cbind(lag(myerror,k=1),myerror)
dum
dum1 <- dum[2:length(myerror),]
dum1
z <- as.data.frame(dum1)
z
plot(z,main=paste('Residual Lag plot, lowess, and regression line'), ylab='values of Residuals', xlab='lagged values of Residuals')
lines(lowess(z))
abline(lm(z))
grid()
dev.off()
bitmap(file='test6.png')
acf(mysum$resid, lag.max=length(mysum$resid)/2, main='Residual Autocorrelation Function')
grid()
dev.off()
bitmap(file='test7.png')
pacf(mysum$resid, lag.max=length(mysum$resid)/2, main='Residual Partial Autocorrelation Function')
grid()
dev.off()
bitmap(file='test8.png')
opar <- par(mfrow = c(2,2), oma = c(0, 0, 1.1, 0))
plot(mylm, las = 1, sub='Residual Diagnostics')
par(opar)
dev.off()
load(file='createtable')
a<-table.start()
a<-table.row.start(a)
a<-table.element(a, 'Multiple Linear Regression - Estimated Regression Equation', 1, TRUE)
a<-table.row.end(a)
myeq <- colnames(x)[1]
myeq <- paste(myeq, '[t] = ', sep='')
for (i in 1:k){
if (mysum$coefficients[i,1] > 0) myeq <- paste(myeq, '+', '')
myeq <- paste(myeq, mysum$coefficients[i,1], sep=' ')
if (rownames(mysum$coefficients)[i] != '(Intercept)') {
myeq <- paste(myeq, rownames(mysum$coefficients)[i], sep='')
if (rownames(mysum$coefficients)[i] != 't') myeq <- paste(myeq, '[t]', sep='')
}
}
myeq <- paste(myeq, ' + e[t]')
a<-table.row.start(a)
a<-table.element(a, myeq)
a<-table.row.end(a)
a<-table.end(a)
table.save(a,file='mytable1.tab')
a<-table.start()
a<-table.row.start(a)
a<-table.element(a,hyperlink('ols1.htm','Multiple Linear Regression - Ordinary Least Squares',''), 6, TRUE)
a<-table.row.end(a)
a<-table.row.start(a)
a<-table.element(a,'Variable',header=TRUE)
a<-table.element(a,'Parameter',header=TRUE)
a<-table.element(a,'S.D.',header=TRUE)
a<-table.element(a,'T-STAT
H0: parameter = 0',header=TRUE)
a<-table.element(a,'2-tail p-value',header=TRUE)
a<-table.element(a,'1-tail p-value',header=TRUE)
a<-table.row.end(a)
for (i in 1:k){
a<-table.row.start(a)
a<-table.element(a,rownames(mysum$coefficients)[i],header=TRUE)
a<-table.element(a,mysum$coefficients[i,1])
a<-table.element(a, round(mysum$coefficients[i,2],6))
a<-table.element(a, round(mysum$coefficients[i,3],4))
a<-table.element(a, round(mysum$coefficients[i,4],6))
a<-table.element(a, round(mysum$coefficients[i,4]/2,6))
a<-table.row.end(a)
}
a<-table.end(a)
table.save(a,file='mytable2.tab')
a<-table.start()
a<-table.row.start(a)
a<-table.element(a, 'Multiple Linear Regression - Regression Statistics', 2, TRUE)
a<-table.row.end(a)
a<-table.row.start(a)
a<-table.element(a, 'Multiple R',1,TRUE)
a<-table.element(a, sqrt(mysum$r.squared))
a<-table.row.end(a)
a<-table.row.start(a)
a<-table.element(a, 'R-squared',1,TRUE)
a<-table.element(a, mysum$r.squared)
a<-table.row.end(a)
a<-table.row.start(a)
a<-table.element(a, 'Adjusted R-squared',1,TRUE)
a<-table.element(a, mysum$adj.r.squared)
a<-table.row.end(a)
a<-table.row.start(a)
a<-table.element(a, 'F-TEST (value)',1,TRUE)
a<-table.element(a, mysum$fstatistic[1])
a<-table.row.end(a)
a<-table.row.start(a)
a<-table.element(a, 'F-TEST (DF numerator)',1,TRUE)
a<-table.element(a, mysum$fstatistic[2])
a<-table.row.end(a)
a<-table.row.start(a)
a<-table.element(a, 'F-TEST (DF denominator)',1,TRUE)
a<-table.element(a, mysum$fstatistic[3])
a<-table.row.end(a)
a<-table.row.start(a)
a<-table.element(a, 'p-value',1,TRUE)
a<-table.element(a, 1-pf(mysum$fstatistic[1],mysum$fstatistic[2],mysum$fstatistic[3]))
a<-table.row.end(a)
a<-table.row.start(a)
a<-table.element(a, 'Multiple Linear Regression - Residual Statistics', 2, TRUE)
a<-table.row.end(a)
a<-table.row.start(a)
a<-table.element(a, 'Residual Standard Deviation',1,TRUE)
a<-table.element(a, mysum$sigma)
a<-table.row.end(a)
a<-table.row.start(a)
a<-table.element(a, 'Sum Squared Residuals',1,TRUE)
a<-table.element(a, sum(myerror*myerror))
a<-table.row.end(a)
a<-table.end(a)
table.save(a,file='mytable3.tab')
a<-table.start()
a<-table.row.start(a)
a<-table.element(a, 'Multiple Linear Regression - Actuals, Interpolation, and Residuals', 4, TRUE)
a<-table.row.end(a)
a<-table.row.start(a)
a<-table.element(a, 'Time or Index', 1, TRUE)
a<-table.element(a, 'Actuals', 1, TRUE)
a<-table.element(a, 'Interpolation
Forecast', 1, TRUE)
a<-table.element(a, 'Residuals
Prediction Error', 1, TRUE)
a<-table.row.end(a)
for (i in 1:n) {
a<-table.row.start(a)
a<-table.element(a,i, 1, TRUE)
a<-table.element(a,x[i])
a<-table.element(a,x[i]-mysum$resid[i])
a<-table.element(a,mysum$resid[i])
a<-table.row.end(a)
}
a<-table.end(a)
table.save(a,file='mytable4.tab')