Free Statistics
of Irreproducible Research!
Description of Statistical Computation | |||||||||||||||||||||||||||||||||||||||
|---|---|---|---|---|---|---|---|---|---|---|---|---|---|---|---|---|---|---|---|---|---|---|---|---|---|---|---|---|---|---|---|---|---|---|---|---|---|---|---|
| Author's title | paper-maximum likelihood fitting normal distribution-elektronische apparate... | ||||||||||||||||||||||||||||||||||||||
| Author | *Unverified author* | ||||||||||||||||||||||||||||||||||||||
| R Software Module | rwasp_fitdistrnorm.wasp | ||||||||||||||||||||||||||||||||||||||
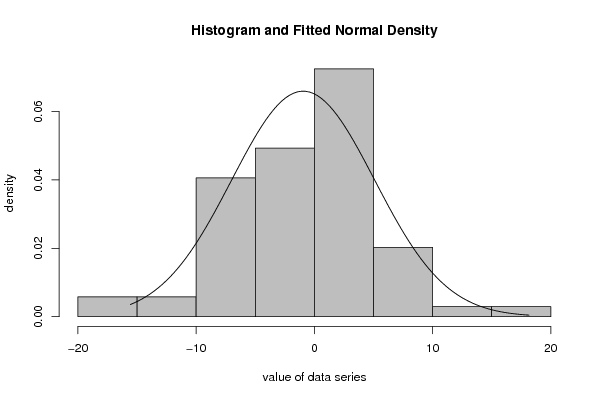
| Title produced by software | Maximum-likelihood Fitting - Normal Distribution | ||||||||||||||||||||||||||||||||||||||
| Date of computation | Tue, 18 Dec 2007 10:34:38 -0700 | ||||||||||||||||||||||||||||||||||||||
| Cite this page as follows | Statistical Computations at FreeStatistics.org, Office for Research Development and Education, URL https://freestatistics.org/blog/index.php?v=date/2007/Dec/18/t1197998280c7s1xkhmjjafyj1.htm/, Retrieved Fri, 18 Jul 2025 23:28:13 +0000 | ||||||||||||||||||||||||||||||||||||||
| Statistical Computations at FreeStatistics.org, Office for Research Development and Education, URL https://freestatistics.org/blog/index.php?pk=4558, Retrieved Fri, 18 Jul 2025 23:28:13 +0000 | |||||||||||||||||||||||||||||||||||||||
| QR Codes: | |||||||||||||||||||||||||||||||||||||||
|
| |||||||||||||||||||||||||||||||||||||||
| Original text written by user: | |||||||||||||||||||||||||||||||||||||||
| IsPrivate? | No (this computation is public) | ||||||||||||||||||||||||||||||||||||||
| User-defined keywords | |||||||||||||||||||||||||||||||||||||||
| Estimated Impact | 306 | ||||||||||||||||||||||||||||||||||||||
Tree of Dependent Computations | |||||||||||||||||||||||||||||||||||||||
| Family? (F = Feedback message, R = changed R code, M = changed R Module, P = changed Parameters, D = changed Data) | |||||||||||||||||||||||||||||||||||||||
| - [Maximum-likelihood Fitting - Normal Distribution] [paper-maximum lik...] [2007-12-18 17:34:38] [5b9249e3962a4d9b95a2c513d8084bf7] [Current] - PD [Maximum-likelihood Fitting - Normal Distribution] [paper-maximum lik...] [2008-12-27 13:03:41] [1aad2bd7746abaf3ab17fe0d80878872] | |||||||||||||||||||||||||||||||||||||||
| Feedback Forum | |||||||||||||||||||||||||||||||||||||||
Post a new message | |||||||||||||||||||||||||||||||||||||||
Dataset | |||||||||||||||||||||||||||||||||||||||
| Dataseries X: | |||||||||||||||||||||||||||||||||||||||
0.084299365852926 -15.5692124815993 -6.9953619930182 -2.07575919037298 6.06472185178652 3.10063183929146 -7.27872604143293 11.9305592423578 -15.1800926797913 -4.96965957564265 -3.06184332688462 5.17876413221274 -2.29638814463019 -1.85853257792512 -8.74637895628288 -8.02346934029272 4.80319999595127 3.90173526693944 -11.3069080265042 4.26225040152088 -6.88628010104842 4.12797896412461 4.24824928932737 -5.91811547446539 -2.62127541719435 -5.11947651478644 -6.19169292552164 1.57682830128841 6.93381888926023 1.30435330636300 0.701451547474772 18.1487693268603 -13.6251962127511 -8.9684198944174 -3.48024416476534 0.133268755660886 0.156896176204026 -1.28412130463800 -8.4586972345603 -2.91518278408049 0.150465578819962 3.86877987666889 7.70993797103159 -4.11650976301151 -2.74475852656699 3.19286810860467 -6.2212027713738 1.25489355791219 4.23585013027417 0.153440583363572 -2.05719003274709 2.14422869581576 -1.68156215590428 5.0318450949173 2.24823311061623 -6.58372573676435 -2.85420176875137 5.0379752614482 4.43711208741108 -0.675511401722624 -2.50684702275299 2.35909448398834 -6.31849429304567 -3.81949862816358 2.17307118170725 4.13663986179168 -6.96229654560136 5.28008601863276 4.2774558989149 | |||||||||||||||||||||||||||||||||||||||
Tables (Output of Computation) | |||||||||||||||||||||||||||||||||||||||
| |||||||||||||||||||||||||||||||||||||||
Figures (Output of Computation) | |||||||||||||||||||||||||||||||||||||||
Input Parameters & R Code | |||||||||||||||||||||||||||||||||||||||
| Parameters (Session): | |||||||||||||||||||||||||||||||||||||||
| par1 = 8 ; par2 = 0 ; | |||||||||||||||||||||||||||||||||||||||
| Parameters (R input): | |||||||||||||||||||||||||||||||||||||||
| par1 = 8 ; par2 = 0 ; | |||||||||||||||||||||||||||||||||||||||
| R code (references can be found in the software module): | |||||||||||||||||||||||||||||||||||||||
library(MASS) | |||||||||||||||||||||||||||||||||||||||