Free Statistics

of Irreproducible Research!

Author's title

Author*Unverified author*
R Software Modulerwasp_multipleregression.wasp
Title produced by softwareMultiple Regression
Date of computationTue, 18 Dec 2007 10:34:29 -0700
Cite this page as followsStatistical Computations at FreeStatistics.org, Office for Research Development and Education, URL https://freestatistics.org/blog/index.php?v=date/2007/Dec/18/t1197998274z2xnotyqg0t3jfj.htm/, Retrieved Sat, 04 May 2024 08:57:49 +0000
Statistical Computations at FreeStatistics.org, Office for Research Development and Education, URL https://freestatistics.org/blog/index.php?pk=14390, Retrieved Sat, 04 May 2024 08:57:49 +0000
QR Codes:

Original text written by user:
IsPrivate?No (this computation is public)
User-defined keywords
Estimated Impact190
Family? (F = Feedback message, R = changed R code, M = changed R Module, P = changed Parameters, D = changed Data)
-       [Multiple Regression] [werkloosheid en i...] [2007-12-18 17:34:29] [151d9b972bcbe57745b80028e4bf0c5f] [Current]
Feedback Forum

Post a new message
Dataseries X:
8,1	359
8,3	304,6
8,2	297,7
8,1	303,3
7,7	304,7
7,6	331,3
7,7	318,8
8,2	306,8
8,4	331,1
8,4	284,1
8,6	259,7
8,4	335,8
8,5	338,5
8,7	310,3
8,7	322,1
8,6	289,3
7,4	300,8
7,3	360,6
7,4	327,3
9	304,1
9,2	362
9,2	287,8
8,5	286,1
8,3	358,2
8,3	346
8,6	329,9
8,6	334,3
8,5	303,7
8,1	307,6
8,1	351,7
8	324,6
8,6	311,9
8,7	361,5
8,7	271,1
8,6	286,5
8,4	352,8
8,4	322,4
8,7	335
8,7	322,2
8,5	313,6
8,3	323,3
8,3	379,1
8,3	315,6
8,1	353,6
8,2	371,7
8,1	282,9
8,1	298,8
7,9	361,8
7,7	365,9
8,1	357,6
8	335,4
7,7	340,1
7,8	337,8
7,6	389,6
7,4	342,5
7,7	354,6
7,8	391,6
7,5	317,7
7,2	312,8
7	356,2


Summary of compuational transaction
Raw Inputview raw input (R code)
Raw Outputview raw output of R engine
Computing time3 seconds
R Server'Gwilym Jenkins' @ 72.249.127.135

\begin{tabular}{lllllllll}
\hline
Summary of compuational transaction \tabularnewline
Raw Input & view raw input (R code)  \tabularnewline
Raw Output & view raw output of R engine  \tabularnewline
Computing time & 3 seconds \tabularnewline
R Server & 'Gwilym Jenkins' @ 72.249.127.135 \tabularnewline
\hline
\end{tabular}
%Source: https://freestatistics.org/blog/index.php?pk=14390&T=0

[TABLE]
[ROW][C]Summary of compuational transaction[/C][/ROW]
[ROW][C]Raw Input[/C][C]view raw input (R code) [/C][/ROW]
[ROW][C]Raw Output[/C][C]view raw output of R engine [/C][/ROW]
[ROW][C]Computing time[/C][C]3 seconds[/C][/ROW]
[ROW][C]R Server[/C][C]'Gwilym Jenkins' @ 72.249.127.135[/C][/ROW]
[/TABLE]
Source: https://freestatistics.org/blog/index.php?pk=14390&T=0

Globally Unique Identifier (entire table): ba.freestatistics.org/blog/index.php?pk=14390&T=0

As an alternative you can also use a QR Code:  

The GUIDs for individual cells are displayed in the table below:

Summary of compuational transaction
Raw Inputview raw input (R code)
Raw Outputview raw output of R engine
Computing time3 seconds
R Server'Gwilym Jenkins' @ 72.249.127.135


Multiple Linear Regression - Estimated Regression Equation
werkl[t] = + 9.49129736541874 -0.0033318274051573Iprod[t] -0.00722191047269792t + e[t]

\begin{tabular}{lllllllll}
\hline
Multiple Linear Regression - Estimated Regression Equation \tabularnewline
werkl[t] =  +  9.49129736541874 -0.0033318274051573Iprod[t] -0.00722191047269792t  + e[t] \tabularnewline
\hline
\end{tabular}
%Source: https://freestatistics.org/blog/index.php?pk=14390&T=1

[TABLE]
[ROW][C]Multiple Linear Regression - Estimated Regression Equation[/C][/ROW]
[ROW][C]werkl[t] =  +  9.49129736541874 -0.0033318274051573Iprod[t] -0.00722191047269792t  + e[t][/C][/ROW]
[/TABLE]
Source: https://freestatistics.org/blog/index.php?pk=14390&T=1

Globally Unique Identifier (entire table): ba.freestatistics.org/blog/index.php?pk=14390&T=1

As an alternative you can also use a QR Code:  

The GUIDs for individual cells are displayed in the table below:

Multiple Linear Regression - Estimated Regression Equation
werkl[t] = + 9.49129736541874 -0.0033318274051573Iprod[t] -0.00722191047269792t + e[t]


Multiple Linear Regression - Ordinary Least Squares
VariableParameterS.D.T-STATH0: parameter = 02-tail p-value1-tail p-value
(Intercept)9.491297365418740.68028113.95200
Iprod-0.00333182740515730.002183-1.52660.1324020.066201
t-0.007221910472697920.003698-1.95320.0557130.027856

\begin{tabular}{lllllllll}
\hline
Multiple Linear Regression - Ordinary Least Squares \tabularnewline
Variable & Parameter & S.D. & T-STATH0: parameter = 0 & 2-tail p-value & 1-tail p-value \tabularnewline
(Intercept) & 9.49129736541874 & 0.680281 & 13.952 & 0 & 0 \tabularnewline
Iprod & -0.0033318274051573 & 0.002183 & -1.5266 & 0.132402 & 0.066201 \tabularnewline
t & -0.00722191047269792 & 0.003698 & -1.9532 & 0.055713 & 0.027856 \tabularnewline
\hline
\end{tabular}
%Source: https://freestatistics.org/blog/index.php?pk=14390&T=2

[TABLE]
[ROW][C]Multiple Linear Regression - Ordinary Least Squares[/C][/ROW]
[ROW][C]Variable[/C][C]Parameter[/C][C]S.D.[/C][C]T-STATH0: parameter = 0[/C][C]2-tail p-value[/C][C]1-tail p-value[/C][/ROW]
[ROW][C](Intercept)[/C][C]9.49129736541874[/C][C]0.680281[/C][C]13.952[/C][C]0[/C][C]0[/C][/ROW]
[ROW][C]Iprod[/C][C]-0.0033318274051573[/C][C]0.002183[/C][C]-1.5266[/C][C]0.132402[/C][C]0.066201[/C][/ROW]
[ROW][C]t[/C][C]-0.00722191047269792[/C][C]0.003698[/C][C]-1.9532[/C][C]0.055713[/C][C]0.027856[/C][/ROW]
[/TABLE]
Source: https://freestatistics.org/blog/index.php?pk=14390&T=2

Globally Unique Identifier (entire table): ba.freestatistics.org/blog/index.php?pk=14390&T=2

As an alternative you can also use a QR Code:  

The GUIDs for individual cells are displayed in the table below:

Multiple Linear Regression - Ordinary Least Squares
VariableParameterS.D.T-STATH0: parameter = 02-tail p-value1-tail p-value
(Intercept)9.491297365418740.68028113.95200
Iprod-0.00333182740515730.002183-1.52660.1324020.066201
t-0.007221910472697920.003698-1.95320.0557130.027856


Multiple Linear Regression - Regression Statistics
Multiple R0.388374131532672
R-squared0.150834466043757
Adjusted R-squared0.121039184150555
F-TEST (value)5.06236076518454
F-TEST (DF numerator)2
F-TEST (DF denominator)57
p-value0.00946852263049802
Multiple Linear Regression - Residual Statistics
Residual Standard Deviation0.454991888492492
Sum Squared Residuals11.8000042598560

\begin{tabular}{lllllllll}
\hline
Multiple Linear Regression - Regression Statistics \tabularnewline
Multiple R & 0.388374131532672 \tabularnewline
R-squared & 0.150834466043757 \tabularnewline
Adjusted R-squared & 0.121039184150555 \tabularnewline
F-TEST (value) & 5.06236076518454 \tabularnewline
F-TEST (DF numerator) & 2 \tabularnewline
F-TEST (DF denominator) & 57 \tabularnewline
p-value & 0.00946852263049802 \tabularnewline
Multiple Linear Regression - Residual Statistics \tabularnewline
Residual Standard Deviation & 0.454991888492492 \tabularnewline
Sum Squared Residuals & 11.8000042598560 \tabularnewline
\hline
\end{tabular}
%Source: https://freestatistics.org/blog/index.php?pk=14390&T=3

[TABLE]
[ROW][C]Multiple Linear Regression - Regression Statistics[/C][/ROW]
[ROW][C]Multiple R[/C][C]0.388374131532672[/C][/ROW]
[ROW][C]R-squared[/C][C]0.150834466043757[/C][/ROW]
[ROW][C]Adjusted R-squared[/C][C]0.121039184150555[/C][/ROW]
[ROW][C]F-TEST (value)[/C][C]5.06236076518454[/C][/ROW]
[ROW][C]F-TEST (DF numerator)[/C][C]2[/C][/ROW]
[ROW][C]F-TEST (DF denominator)[/C][C]57[/C][/ROW]
[ROW][C]p-value[/C][C]0.00946852263049802[/C][/ROW]
[ROW][C]Multiple Linear Regression - Residual Statistics[/C][/ROW]
[ROW][C]Residual Standard Deviation[/C][C]0.454991888492492[/C][/ROW]
[ROW][C]Sum Squared Residuals[/C][C]11.8000042598560[/C][/ROW]
[/TABLE]
Source: https://freestatistics.org/blog/index.php?pk=14390&T=3

Globally Unique Identifier (entire table): ba.freestatistics.org/blog/index.php?pk=14390&T=3

As an alternative you can also use a QR Code:  

The GUIDs for individual cells are displayed in the table below:

Multiple Linear Regression - Regression Statistics
Multiple R0.388374131532672
R-squared0.150834466043757
Adjusted R-squared0.121039184150555
F-TEST (value)5.06236076518454
F-TEST (DF numerator)2
F-TEST (DF denominator)57
p-value0.00946852263049802
Multiple Linear Regression - Residual Statistics
Residual Standard Deviation0.454991888492492
Sum Squared Residuals11.8000042598560


Multiple Linear Regression - Actuals, Interpolation, and Residuals
Time or IndexActualsInterpolationForecastResidualsPrediction Error
18.18.28794941649463-0.187949416494628
28.38.46197891686244-0.161978916862434
38.28.47774661548532-0.277746615485324
48.18.45186647154374-0.351866471543744
57.78.43998000270383-0.739980002703826
67.68.34413148325394-0.744131483253944
77.78.37855741534571-0.678557415345712
88.28.4113174337349-0.211317433734902
98.48.323132117316880.076867882683119
108.48.47250609488658-0.072506094886576
118.68.546580773099720.0534192269002831
128.48.285806797094550.114193202905452
138.58.269588952627930.230411047372074
148.78.356324574980660.343675425019336
158.78.309787101127110.39021289887289
168.68.411849129543570.188150870456429
177.48.36631120391156-0.966311203911564
187.38.15984601461046-0.85984601461046
197.48.2635739567295-0.8635739567295
2098.333650442056450.666349557943549
219.28.133515724825141.06648427517485
229.28.373515407815120.82648459218488
238.58.371957603931190.128042396068811
248.38.124510937546650.175489062453351
258.38.157937321416870.14206267858313
268.68.20435783216720.395642167832794
278.68.182475881111810.417524118888184
288.58.277207889236930.222792110763069
298.18.25699185188412-0.156991851884120
308.18.10283635284399-0.00283635284398502
3188.18590696505105-0.185906965051049
328.68.220999262623850.37900073737615
338.78.048518712855350.65148128714465
348.78.342493999808870.357506000191128
358.68.283961947296750.316038052703249
368.48.055839879862120.344160120137876
378.48.14990552250620.250094477493792
388.78.100702586728530.599297413271471
398.78.136128067041840.563871932958156
408.58.15755987225350.342440127746502
418.38.118019235950770.181980764049226
428.37.92488135627030.375118643729701
438.38.12923048602510.170769513974911
448.17.995399134156410.104600865843585
458.27.927871147650370.272128852349629
468.18.21651551075564-0.116515510755640
478.18.15631754454094-0.0563175445409412
487.97.93919050754333-0.0391905075433329
497.77.91830810470949-0.218308104709490
508.17.93874036169960.161259638300402
5188.0054850196214-0.00548501962139219
527.77.98260352034445-0.282603520344455
537.87.98304481290362-0.183044812903619
547.67.80323424284377-0.203234242843773
557.47.95294140315398-0.552941403153983
567.77.90540438107888-0.205404381078882
577.87.774904856615360.0250951433846354
587.58.01390499138379-0.513904991383791
597.28.02300903519636-0.823009035196363
6077.87118581533984-0.871185815339839

\begin{tabular}{lllllllll}
\hline
Multiple Linear Regression - Actuals, Interpolation, and Residuals \tabularnewline
Time or Index & Actuals & InterpolationForecast & ResidualsPrediction Error \tabularnewline
1 & 8.1 & 8.28794941649463 & -0.187949416494628 \tabularnewline
2 & 8.3 & 8.46197891686244 & -0.161978916862434 \tabularnewline
3 & 8.2 & 8.47774661548532 & -0.277746615485324 \tabularnewline
4 & 8.1 & 8.45186647154374 & -0.351866471543744 \tabularnewline
5 & 7.7 & 8.43998000270383 & -0.739980002703826 \tabularnewline
6 & 7.6 & 8.34413148325394 & -0.744131483253944 \tabularnewline
7 & 7.7 & 8.37855741534571 & -0.678557415345712 \tabularnewline
8 & 8.2 & 8.4113174337349 & -0.211317433734902 \tabularnewline
9 & 8.4 & 8.32313211731688 & 0.076867882683119 \tabularnewline
10 & 8.4 & 8.47250609488658 & -0.072506094886576 \tabularnewline
11 & 8.6 & 8.54658077309972 & 0.0534192269002831 \tabularnewline
12 & 8.4 & 8.28580679709455 & 0.114193202905452 \tabularnewline
13 & 8.5 & 8.26958895262793 & 0.230411047372074 \tabularnewline
14 & 8.7 & 8.35632457498066 & 0.343675425019336 \tabularnewline
15 & 8.7 & 8.30978710112711 & 0.39021289887289 \tabularnewline
16 & 8.6 & 8.41184912954357 & 0.188150870456429 \tabularnewline
17 & 7.4 & 8.36631120391156 & -0.966311203911564 \tabularnewline
18 & 7.3 & 8.15984601461046 & -0.85984601461046 \tabularnewline
19 & 7.4 & 8.2635739567295 & -0.8635739567295 \tabularnewline
20 & 9 & 8.33365044205645 & 0.666349557943549 \tabularnewline
21 & 9.2 & 8.13351572482514 & 1.06648427517485 \tabularnewline
22 & 9.2 & 8.37351540781512 & 0.82648459218488 \tabularnewline
23 & 8.5 & 8.37195760393119 & 0.128042396068811 \tabularnewline
24 & 8.3 & 8.12451093754665 & 0.175489062453351 \tabularnewline
25 & 8.3 & 8.15793732141687 & 0.14206267858313 \tabularnewline
26 & 8.6 & 8.2043578321672 & 0.395642167832794 \tabularnewline
27 & 8.6 & 8.18247588111181 & 0.417524118888184 \tabularnewline
28 & 8.5 & 8.27720788923693 & 0.222792110763069 \tabularnewline
29 & 8.1 & 8.25699185188412 & -0.156991851884120 \tabularnewline
30 & 8.1 & 8.10283635284399 & -0.00283635284398502 \tabularnewline
31 & 8 & 8.18590696505105 & -0.185906965051049 \tabularnewline
32 & 8.6 & 8.22099926262385 & 0.37900073737615 \tabularnewline
33 & 8.7 & 8.04851871285535 & 0.65148128714465 \tabularnewline
34 & 8.7 & 8.34249399980887 & 0.357506000191128 \tabularnewline
35 & 8.6 & 8.28396194729675 & 0.316038052703249 \tabularnewline
36 & 8.4 & 8.05583987986212 & 0.344160120137876 \tabularnewline
37 & 8.4 & 8.1499055225062 & 0.250094477493792 \tabularnewline
38 & 8.7 & 8.10070258672853 & 0.599297413271471 \tabularnewline
39 & 8.7 & 8.13612806704184 & 0.563871932958156 \tabularnewline
40 & 8.5 & 8.1575598722535 & 0.342440127746502 \tabularnewline
41 & 8.3 & 8.11801923595077 & 0.181980764049226 \tabularnewline
42 & 8.3 & 7.9248813562703 & 0.375118643729701 \tabularnewline
43 & 8.3 & 8.1292304860251 & 0.170769513974911 \tabularnewline
44 & 8.1 & 7.99539913415641 & 0.104600865843585 \tabularnewline
45 & 8.2 & 7.92787114765037 & 0.272128852349629 \tabularnewline
46 & 8.1 & 8.21651551075564 & -0.116515510755640 \tabularnewline
47 & 8.1 & 8.15631754454094 & -0.0563175445409412 \tabularnewline
48 & 7.9 & 7.93919050754333 & -0.0391905075433329 \tabularnewline
49 & 7.7 & 7.91830810470949 & -0.218308104709490 \tabularnewline
50 & 8.1 & 7.9387403616996 & 0.161259638300402 \tabularnewline
51 & 8 & 8.0054850196214 & -0.00548501962139219 \tabularnewline
52 & 7.7 & 7.98260352034445 & -0.282603520344455 \tabularnewline
53 & 7.8 & 7.98304481290362 & -0.183044812903619 \tabularnewline
54 & 7.6 & 7.80323424284377 & -0.203234242843773 \tabularnewline
55 & 7.4 & 7.95294140315398 & -0.552941403153983 \tabularnewline
56 & 7.7 & 7.90540438107888 & -0.205404381078882 \tabularnewline
57 & 7.8 & 7.77490485661536 & 0.0250951433846354 \tabularnewline
58 & 7.5 & 8.01390499138379 & -0.513904991383791 \tabularnewline
59 & 7.2 & 8.02300903519636 & -0.823009035196363 \tabularnewline
60 & 7 & 7.87118581533984 & -0.871185815339839 \tabularnewline
\hline
\end{tabular}
%Source: https://freestatistics.org/blog/index.php?pk=14390&T=4

[TABLE]
[ROW][C]Multiple Linear Regression - Actuals, Interpolation, and Residuals[/C][/ROW]
[ROW][C]Time or Index[/C][C]Actuals[/C][C]InterpolationForecast[/C][C]ResidualsPrediction Error[/C][/ROW]
[ROW][C]1[/C][C]8.1[/C][C]8.28794941649463[/C][C]-0.187949416494628[/C][/ROW]
[ROW][C]2[/C][C]8.3[/C][C]8.46197891686244[/C][C]-0.161978916862434[/C][/ROW]
[ROW][C]3[/C][C]8.2[/C][C]8.47774661548532[/C][C]-0.277746615485324[/C][/ROW]
[ROW][C]4[/C][C]8.1[/C][C]8.45186647154374[/C][C]-0.351866471543744[/C][/ROW]
[ROW][C]5[/C][C]7.7[/C][C]8.43998000270383[/C][C]-0.739980002703826[/C][/ROW]
[ROW][C]6[/C][C]7.6[/C][C]8.34413148325394[/C][C]-0.744131483253944[/C][/ROW]
[ROW][C]7[/C][C]7.7[/C][C]8.37855741534571[/C][C]-0.678557415345712[/C][/ROW]
[ROW][C]8[/C][C]8.2[/C][C]8.4113174337349[/C][C]-0.211317433734902[/C][/ROW]
[ROW][C]9[/C][C]8.4[/C][C]8.32313211731688[/C][C]0.076867882683119[/C][/ROW]
[ROW][C]10[/C][C]8.4[/C][C]8.47250609488658[/C][C]-0.072506094886576[/C][/ROW]
[ROW][C]11[/C][C]8.6[/C][C]8.54658077309972[/C][C]0.0534192269002831[/C][/ROW]
[ROW][C]12[/C][C]8.4[/C][C]8.28580679709455[/C][C]0.114193202905452[/C][/ROW]
[ROW][C]13[/C][C]8.5[/C][C]8.26958895262793[/C][C]0.230411047372074[/C][/ROW]
[ROW][C]14[/C][C]8.7[/C][C]8.35632457498066[/C][C]0.343675425019336[/C][/ROW]
[ROW][C]15[/C][C]8.7[/C][C]8.30978710112711[/C][C]0.39021289887289[/C][/ROW]
[ROW][C]16[/C][C]8.6[/C][C]8.41184912954357[/C][C]0.188150870456429[/C][/ROW]
[ROW][C]17[/C][C]7.4[/C][C]8.36631120391156[/C][C]-0.966311203911564[/C][/ROW]
[ROW][C]18[/C][C]7.3[/C][C]8.15984601461046[/C][C]-0.85984601461046[/C][/ROW]
[ROW][C]19[/C][C]7.4[/C][C]8.2635739567295[/C][C]-0.8635739567295[/C][/ROW]
[ROW][C]20[/C][C]9[/C][C]8.33365044205645[/C][C]0.666349557943549[/C][/ROW]
[ROW][C]21[/C][C]9.2[/C][C]8.13351572482514[/C][C]1.06648427517485[/C][/ROW]
[ROW][C]22[/C][C]9.2[/C][C]8.37351540781512[/C][C]0.82648459218488[/C][/ROW]
[ROW][C]23[/C][C]8.5[/C][C]8.37195760393119[/C][C]0.128042396068811[/C][/ROW]
[ROW][C]24[/C][C]8.3[/C][C]8.12451093754665[/C][C]0.175489062453351[/C][/ROW]
[ROW][C]25[/C][C]8.3[/C][C]8.15793732141687[/C][C]0.14206267858313[/C][/ROW]
[ROW][C]26[/C][C]8.6[/C][C]8.2043578321672[/C][C]0.395642167832794[/C][/ROW]
[ROW][C]27[/C][C]8.6[/C][C]8.18247588111181[/C][C]0.417524118888184[/C][/ROW]
[ROW][C]28[/C][C]8.5[/C][C]8.27720788923693[/C][C]0.222792110763069[/C][/ROW]
[ROW][C]29[/C][C]8.1[/C][C]8.25699185188412[/C][C]-0.156991851884120[/C][/ROW]
[ROW][C]30[/C][C]8.1[/C][C]8.10283635284399[/C][C]-0.00283635284398502[/C][/ROW]
[ROW][C]31[/C][C]8[/C][C]8.18590696505105[/C][C]-0.185906965051049[/C][/ROW]
[ROW][C]32[/C][C]8.6[/C][C]8.22099926262385[/C][C]0.37900073737615[/C][/ROW]
[ROW][C]33[/C][C]8.7[/C][C]8.04851871285535[/C][C]0.65148128714465[/C][/ROW]
[ROW][C]34[/C][C]8.7[/C][C]8.34249399980887[/C][C]0.357506000191128[/C][/ROW]
[ROW][C]35[/C][C]8.6[/C][C]8.28396194729675[/C][C]0.316038052703249[/C][/ROW]
[ROW][C]36[/C][C]8.4[/C][C]8.05583987986212[/C][C]0.344160120137876[/C][/ROW]
[ROW][C]37[/C][C]8.4[/C][C]8.1499055225062[/C][C]0.250094477493792[/C][/ROW]
[ROW][C]38[/C][C]8.7[/C][C]8.10070258672853[/C][C]0.599297413271471[/C][/ROW]
[ROW][C]39[/C][C]8.7[/C][C]8.13612806704184[/C][C]0.563871932958156[/C][/ROW]
[ROW][C]40[/C][C]8.5[/C][C]8.1575598722535[/C][C]0.342440127746502[/C][/ROW]
[ROW][C]41[/C][C]8.3[/C][C]8.11801923595077[/C][C]0.181980764049226[/C][/ROW]
[ROW][C]42[/C][C]8.3[/C][C]7.9248813562703[/C][C]0.375118643729701[/C][/ROW]
[ROW][C]43[/C][C]8.3[/C][C]8.1292304860251[/C][C]0.170769513974911[/C][/ROW]
[ROW][C]44[/C][C]8.1[/C][C]7.99539913415641[/C][C]0.104600865843585[/C][/ROW]
[ROW][C]45[/C][C]8.2[/C][C]7.92787114765037[/C][C]0.272128852349629[/C][/ROW]
[ROW][C]46[/C][C]8.1[/C][C]8.21651551075564[/C][C]-0.116515510755640[/C][/ROW]
[ROW][C]47[/C][C]8.1[/C][C]8.15631754454094[/C][C]-0.0563175445409412[/C][/ROW]
[ROW][C]48[/C][C]7.9[/C][C]7.93919050754333[/C][C]-0.0391905075433329[/C][/ROW]
[ROW][C]49[/C][C]7.7[/C][C]7.91830810470949[/C][C]-0.218308104709490[/C][/ROW]
[ROW][C]50[/C][C]8.1[/C][C]7.9387403616996[/C][C]0.161259638300402[/C][/ROW]
[ROW][C]51[/C][C]8[/C][C]8.0054850196214[/C][C]-0.00548501962139219[/C][/ROW]
[ROW][C]52[/C][C]7.7[/C][C]7.98260352034445[/C][C]-0.282603520344455[/C][/ROW]
[ROW][C]53[/C][C]7.8[/C][C]7.98304481290362[/C][C]-0.183044812903619[/C][/ROW]
[ROW][C]54[/C][C]7.6[/C][C]7.80323424284377[/C][C]-0.203234242843773[/C][/ROW]
[ROW][C]55[/C][C]7.4[/C][C]7.95294140315398[/C][C]-0.552941403153983[/C][/ROW]
[ROW][C]56[/C][C]7.7[/C][C]7.90540438107888[/C][C]-0.205404381078882[/C][/ROW]
[ROW][C]57[/C][C]7.8[/C][C]7.77490485661536[/C][C]0.0250951433846354[/C][/ROW]
[ROW][C]58[/C][C]7.5[/C][C]8.01390499138379[/C][C]-0.513904991383791[/C][/ROW]
[ROW][C]59[/C][C]7.2[/C][C]8.02300903519636[/C][C]-0.823009035196363[/C][/ROW]
[ROW][C]60[/C][C]7[/C][C]7.87118581533984[/C][C]-0.871185815339839[/C][/ROW]
[/TABLE]
Source: https://freestatistics.org/blog/index.php?pk=14390&T=4

Globally Unique Identifier (entire table): ba.freestatistics.org/blog/index.php?pk=14390&T=4

As an alternative you can also use a QR Code:  

The GUIDs for individual cells are displayed in the table below:

Multiple Linear Regression - Actuals, Interpolation, and Residuals
Time or IndexActualsInterpolationForecastResidualsPrediction Error
18.18.28794941649463-0.187949416494628
28.38.46197891686244-0.161978916862434
38.28.47774661548532-0.277746615485324
48.18.45186647154374-0.351866471543744
57.78.43998000270383-0.739980002703826
67.68.34413148325394-0.744131483253944
77.78.37855741534571-0.678557415345712
88.28.4113174337349-0.211317433734902
98.48.323132117316880.076867882683119
108.48.47250609488658-0.072506094886576
118.68.546580773099720.0534192269002831
128.48.285806797094550.114193202905452
138.58.269588952627930.230411047372074
148.78.356324574980660.343675425019336
158.78.309787101127110.39021289887289
168.68.411849129543570.188150870456429
177.48.36631120391156-0.966311203911564
187.38.15984601461046-0.85984601461046
197.48.2635739567295-0.8635739567295
2098.333650442056450.666349557943549
219.28.133515724825141.06648427517485
229.28.373515407815120.82648459218488
238.58.371957603931190.128042396068811
248.38.124510937546650.175489062453351
258.38.157937321416870.14206267858313
268.68.20435783216720.395642167832794
278.68.182475881111810.417524118888184
288.58.277207889236930.222792110763069
298.18.25699185188412-0.156991851884120
308.18.10283635284399-0.00283635284398502
3188.18590696505105-0.185906965051049
328.68.220999262623850.37900073737615
338.78.048518712855350.65148128714465
348.78.342493999808870.357506000191128
358.68.283961947296750.316038052703249
368.48.055839879862120.344160120137876
378.48.14990552250620.250094477493792
388.78.100702586728530.599297413271471
398.78.136128067041840.563871932958156
408.58.15755987225350.342440127746502
418.38.118019235950770.181980764049226
428.37.92488135627030.375118643729701
438.38.12923048602510.170769513974911
448.17.995399134156410.104600865843585
458.27.927871147650370.272128852349629
468.18.21651551075564-0.116515510755640
478.18.15631754454094-0.0563175445409412
487.97.93919050754333-0.0391905075433329
497.77.91830810470949-0.218308104709490
508.17.93874036169960.161259638300402
5188.0054850196214-0.00548501962139219
527.77.98260352034445-0.282603520344455
537.87.98304481290362-0.183044812903619
547.67.80323424284377-0.203234242843773
557.47.95294140315398-0.552941403153983
567.77.90540438107888-0.205404381078882
577.87.774904856615360.0250951433846354
587.58.01390499138379-0.513904991383791
597.28.02300903519636-0.823009035196363
6077.87118581533984-0.871185815339839


Parameters (Session):
par1 = 1 ; par2 = Do not include Seasonal Dummies ; par3 = No Linear Trend ;
Parameters (R input):
par1 = 1 ; par2 = Do not include Seasonal Dummies ; par3 = Linear Trend ;
R code (references can be found in the software module):
library(lattice)
par1 <- as.numeric(par1)
x <- t(y)
k <- length(x[1,])
n <- length(x[,1])
x1 <- cbind(x[,par1], x[,1:k!=par1])
mycolnames <- c(colnames(x)[par1], colnames(x)[1:k!=par1])
colnames(x1) <- mycolnames #colnames(x)[par1]
x <- x1
if (par3 == 'First Differences'){
x2 <- array(0, dim=c(n-1,k), dimnames=list(1:(n-1), paste('(1-B)',colnames(x),sep='')))
for (i in 1:n-1) {
for (j in 1:k) {
x2[i,j] <- x[i+1,j] - x[i,j]
}
}
x <- x2
}
if (par2 == 'Include Monthly Dummies'){
x2 <- array(0, dim=c(n,11), dimnames=list(1:n, paste('M', seq(1:11), sep ='')))
for (i in 1:11){
x2[seq(i,n,12),i] <- 1
}
x <- cbind(x, x2)
}
if (par2 == 'Include Quarterly Dummies'){
x2 <- array(0, dim=c(n,3), dimnames=list(1:n, paste('Q', seq(1:3), sep ='')))
for (i in 1:3){
x2[seq(i,n,4),i] <- 1
}
x <- cbind(x, x2)
}
k <- length(x[1,])
if (par3 == 'Linear Trend'){
x <- cbind(x, c(1:n))
colnames(x)[k+1] <- 't'
}
x
k <- length(x[1,])
df <- as.data.frame(x)
(mylm <- lm(df))
(mysum <- summary(mylm))
bitmap(file='test0.png')
plot(x[,1], type='l', main='Actuals and Interpolation', ylab='value of Actuals and Interpolation (dots)', xlab='time or index')
points(x[,1]-mysum$resid)
grid()
dev.off()
bitmap(file='test1.png')
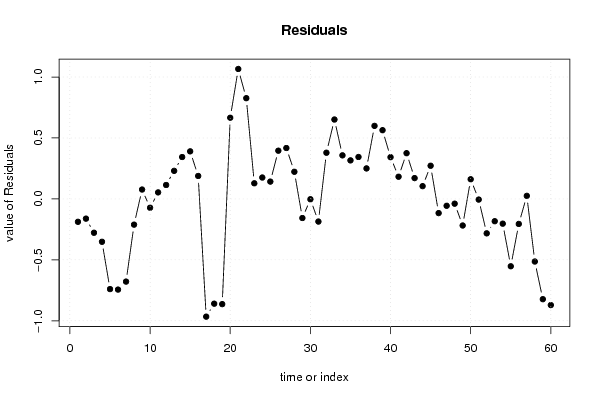
plot(mysum$resid, type='b', pch=19, main='Residuals', ylab='value of Residuals', xlab='time or index')
grid()
dev.off()
bitmap(file='test2.png')
hist(mysum$resid, main='Residual Histogram', xlab='values of Residuals')
grid()
dev.off()
bitmap(file='test3.png')
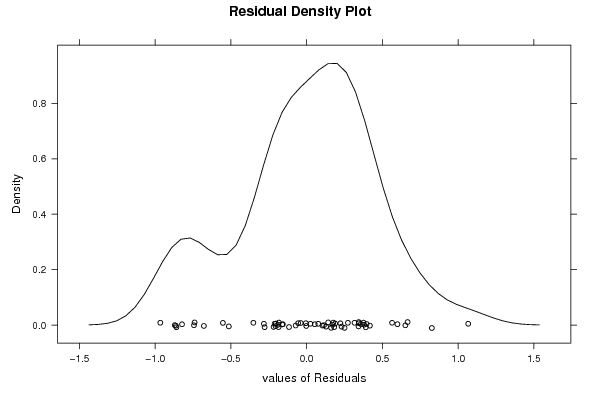
densityplot(~mysum$resid,col='black',main='Residual Density Plot', xlab='values of Residuals')
dev.off()
bitmap(file='test4.png')
qqnorm(mysum$resid, main='Residual Normal Q-Q Plot')
grid()
dev.off()
(myerror <- as.ts(mysum$resid))
bitmap(file='test5.png')
dum <- cbind(lag(myerror,k=1),myerror)
dum
dum1 <- dum[2:length(myerror),]
dum1
z <- as.data.frame(dum1)
z
plot(z,main=paste('Residual Lag plot, lowess, and regression line'), ylab='values of Residuals', xlab='lagged values of Residuals')
lines(lowess(z))
abline(lm(z))
grid()
dev.off()
bitmap(file='test6.png')
acf(mysum$resid, lag.max=length(mysum$resid)/2, main='Residual Autocorrelation Function')
grid()
dev.off()
bitmap(file='test7.png')
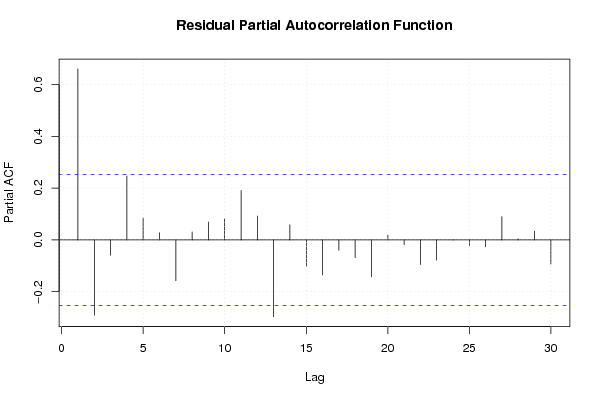
pacf(mysum$resid, lag.max=length(mysum$resid)/2, main='Residual Partial Autocorrelation Function')
grid()
dev.off()
bitmap(file='test8.png')
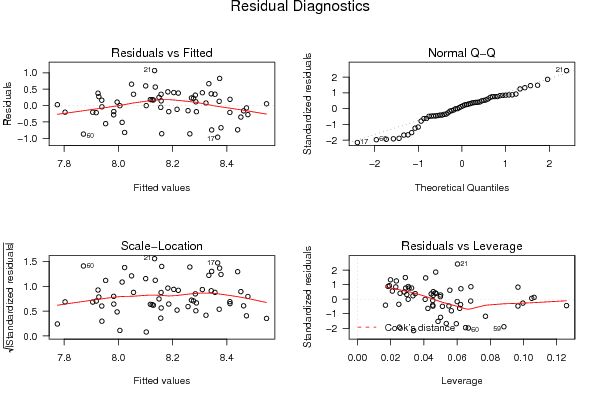
opar <- par(mfrow = c(2,2), oma = c(0, 0, 1.1, 0))
plot(mylm, las = 1, sub='Residual Diagnostics')
par(opar)
dev.off()
load(file='createtable')
a<-table.start()
a<-table.row.start(a)
a<-table.element(a, 'Multiple Linear Regression - Estimated Regression Equation', 1, TRUE)
a<-table.row.end(a)
myeq <- colnames(x)[1]
myeq <- paste(myeq, '[t] = ', sep='')
for (i in 1:k){
if (mysum$coefficients[i,1] > 0) myeq <- paste(myeq, '+', '')
myeq <- paste(myeq, mysum$coefficients[i,1], sep=' ')
if (rownames(mysum$coefficients)[i] != '(Intercept)') {
myeq <- paste(myeq, rownames(mysum$coefficients)[i], sep='')
if (rownames(mysum$coefficients)[i] != 't') myeq <- paste(myeq, '[t]', sep='')
}
}
myeq <- paste(myeq, ' + e[t]')
a<-table.row.start(a)
a<-table.element(a, myeq)
a<-table.row.end(a)
a<-table.end(a)
table.save(a,file='mytable1.tab')
a<-table.start()
a<-table.row.start(a)
a<-table.element(a,hyperlink('ols1.htm','Multiple Linear Regression - Ordinary Least Squares',''), 6, TRUE)
a<-table.row.end(a)
a<-table.row.start(a)
a<-table.element(a,'Variable',header=TRUE)
a<-table.element(a,'Parameter',header=TRUE)
a<-table.element(a,'S.D.',header=TRUE)
a<-table.element(a,'T-STAT
H0: parameter = 0',header=TRUE)
a<-table.element(a,'2-tail p-value',header=TRUE)
a<-table.element(a,'1-tail p-value',header=TRUE)
a<-table.row.end(a)
for (i in 1:k){
a<-table.row.start(a)
a<-table.element(a,rownames(mysum$coefficients)[i],header=TRUE)
a<-table.element(a,mysum$coefficients[i,1])
a<-table.element(a, round(mysum$coefficients[i,2],6))
a<-table.element(a, round(mysum$coefficients[i,3],4))
a<-table.element(a, round(mysum$coefficients[i,4],6))
a<-table.element(a, round(mysum$coefficients[i,4]/2,6))
a<-table.row.end(a)
}
a<-table.end(a)
table.save(a,file='mytable2.tab')
a<-table.start()
a<-table.row.start(a)
a<-table.element(a, 'Multiple Linear Regression - Regression Statistics', 2, TRUE)
a<-table.row.end(a)
a<-table.row.start(a)
a<-table.element(a, 'Multiple R',1,TRUE)
a<-table.element(a, sqrt(mysum$r.squared))
a<-table.row.end(a)
a<-table.row.start(a)
a<-table.element(a, 'R-squared',1,TRUE)
a<-table.element(a, mysum$r.squared)
a<-table.row.end(a)
a<-table.row.start(a)
a<-table.element(a, 'Adjusted R-squared',1,TRUE)
a<-table.element(a, mysum$adj.r.squared)
a<-table.row.end(a)
a<-table.row.start(a)
a<-table.element(a, 'F-TEST (value)',1,TRUE)
a<-table.element(a, mysum$fstatistic[1])
a<-table.row.end(a)
a<-table.row.start(a)
a<-table.element(a, 'F-TEST (DF numerator)',1,TRUE)
a<-table.element(a, mysum$fstatistic[2])
a<-table.row.end(a)
a<-table.row.start(a)
a<-table.element(a, 'F-TEST (DF denominator)',1,TRUE)
a<-table.element(a, mysum$fstatistic[3])
a<-table.row.end(a)
a<-table.row.start(a)
a<-table.element(a, 'p-value',1,TRUE)
a<-table.element(a, 1-pf(mysum$fstatistic[1],mysum$fstatistic[2],mysum$fstatistic[3]))
a<-table.row.end(a)
a<-table.row.start(a)
a<-table.element(a, 'Multiple Linear Regression - Residual Statistics', 2, TRUE)
a<-table.row.end(a)
a<-table.row.start(a)
a<-table.element(a, 'Residual Standard Deviation',1,TRUE)
a<-table.element(a, mysum$sigma)
a<-table.row.end(a)
a<-table.row.start(a)
a<-table.element(a, 'Sum Squared Residuals',1,TRUE)
a<-table.element(a, sum(myerror*myerror))
a<-table.row.end(a)
a<-table.end(a)
table.save(a,file='mytable3.tab')
a<-table.start()
a<-table.row.start(a)
a<-table.element(a, 'Multiple Linear Regression - Actuals, Interpolation, and Residuals', 4, TRUE)
a<-table.row.end(a)
a<-table.row.start(a)
a<-table.element(a, 'Time or Index', 1, TRUE)
a<-table.element(a, 'Actuals', 1, TRUE)
a<-table.element(a, 'Interpolation
Forecast', 1, TRUE)
a<-table.element(a, 'Residuals
Prediction Error', 1, TRUE)
a<-table.row.end(a)
for (i in 1:n) {
a<-table.row.start(a)
a<-table.element(a,i, 1, TRUE)
a<-table.element(a,x[i])
a<-table.element(a,x[i]-mysum$resid[i])
a<-table.element(a,mysum$resid[i])
a<-table.row.end(a)
}
a<-table.end(a)
table.save(a,file='mytable4.tab')