Free Statistics

of Irreproducible Research!

Author's title

Author*Unverified author*
R Software Modulerwasp_multipleregression.wasp
Title produced by softwareMultiple Regression
Date of computationTue, 18 Dec 2007 03:31:59 -0700
Cite this page as followsStatistical Computations at FreeStatistics.org, Office for Research Development and Education, URL https://freestatistics.org/blog/index.php?v=date/2007/Dec/18/t1197973061f78vof8lv6cjddt.htm/, Retrieved Sat, 04 May 2024 11:23:58 +0000
Statistical Computations at FreeStatistics.org, Office for Research Development and Education, URL https://freestatistics.org/blog/index.php?pk=4480, Retrieved Sat, 04 May 2024 11:23:58 +0000
QR Codes:

Original text written by user:
IsPrivate?No (this computation is public)
User-defined keywords
Estimated Impact233
Family? (F = Feedback message, R = changed R code, M = changed R Module, P = changed Parameters, D = changed Data)
-       [Multiple Regression] [regressieanalyse] [2007-12-18 10:31:59] [bd02e85be52eb1cb060a2c60779eb820] [Current]
Feedback Forum

Post a new message
Dataseries X:
88900	0
87280	0
85519	0
83647	0
81616	0
80100	0
94027	0
102327	0
104296	0
101593	0
94816	0
93535	0
93618	0
92330	0
90751	0
88576	0
86102	0
85494	0
103432	1
108870	1
109713	1
106960	1
103195	1
102348	1
102158	1
100431	1
97649	1
95611	1
93035	1
93579	1
111777	1
116065	1
116609	1
112934	1
107660	1
107965	1
107772	1
106201	1
102288	1
99217	1
96511	1
96456	1
113021	1
117836	1
118492	1
113922	1
109317	1
107496	1
105524	1
103824	1
101833	1
99436	1
96915	1
96072	1
111941	1
116008	1
117557	1
113445	1
108762	1
106661	1
102824	1
101912	1
99005	1
97894	1
96256	1
95606	1
108948	1
111223	1
113142	1
106078	1
100992	1
97413	1


Summary of compuational transaction
Raw Inputview raw input (R code)
Raw Outputview raw output of R engine
Computing time6 seconds
R Server'Herman Ole Andreas Wold' @ 193.190.124.10:1001

\begin{tabular}{lllllllll}
\hline
Summary of compuational transaction \tabularnewline
Raw Input & view raw input (R code)  \tabularnewline
Raw Output & view raw output of R engine  \tabularnewline
Computing time & 6 seconds \tabularnewline
R Server & 'Herman Ole Andreas Wold' @ 193.190.124.10:1001 \tabularnewline
\hline
\end{tabular}
%Source: https://freestatistics.org/blog/index.php?pk=4480&T=0

[TABLE]
[ROW][C]Summary of compuational transaction[/C][/ROW]
[ROW][C]Raw Input[/C][C]view raw input (R code) [/C][/ROW]
[ROW][C]Raw Output[/C][C]view raw output of R engine [/C][/ROW]
[ROW][C]Computing time[/C][C]6 seconds[/C][/ROW]
[ROW][C]R Server[/C][C]'Herman Ole Andreas Wold' @ 193.190.124.10:1001[/C][/ROW]
[/TABLE]
Source: https://freestatistics.org/blog/index.php?pk=4480&T=0

Globally Unique Identifier (entire table): ba.freestatistics.org/blog/index.php?pk=4480&T=0

As an alternative you can also use a QR Code:  

The GUIDs for individual cells are displayed in the table below:

Summary of compuational transaction
Raw Inputview raw input (R code)
Raw Outputview raw output of R engine
Computing time6 seconds
R Server'Herman Ole Andreas Wold' @ 193.190.124.10:1001


Multiple Linear Regression - Estimated Regression Equation
werkl50[t] = + 92451.0982905983 + 12142.2820512820premie[t] -413.28632478629M1[t] -1882.95299145299M2[t] -4371.78632478633M3[t] -6482.45299145299M4[t] -8806.78632478633M5[t] -9328.11965811966M6[t] + 4621.33333333333M7[t] + 9485.16666666667M8[t] + 10731.8333333333M9[t] + 6585.66666666666M10[t] + 1554M11[t] + e[t]

\begin{tabular}{lllllllll}
\hline
Multiple Linear Regression - Estimated Regression Equation \tabularnewline
werkl50[t] =  +  92451.0982905983 +  12142.2820512820premie[t] -413.28632478629M1[t] -1882.95299145299M2[t] -4371.78632478633M3[t] -6482.45299145299M4[t] -8806.78632478633M5[t] -9328.11965811966M6[t] +  4621.33333333333M7[t] +  9485.16666666667M8[t] +  10731.8333333333M9[t] +  6585.66666666666M10[t] +  1554M11[t]  + e[t] \tabularnewline
\hline
\end{tabular}
%Source: https://freestatistics.org/blog/index.php?pk=4480&T=1

[TABLE]
[ROW][C]Multiple Linear Regression - Estimated Regression Equation[/C][/ROW]
[ROW][C]werkl50[t] =  +  92451.0982905983 +  12142.2820512820premie[t] -413.28632478629M1[t] -1882.95299145299M2[t] -4371.78632478633M3[t] -6482.45299145299M4[t] -8806.78632478633M5[t] -9328.11965811966M6[t] +  4621.33333333333M7[t] +  9485.16666666667M8[t] +  10731.8333333333M9[t] +  6585.66666666666M10[t] +  1554M11[t]  + e[t][/C][/ROW]
[/TABLE]
Source: https://freestatistics.org/blog/index.php?pk=4480&T=1

Globally Unique Identifier (entire table): ba.freestatistics.org/blog/index.php?pk=4480&T=1

As an alternative you can also use a QR Code:  

The GUIDs for individual cells are displayed in the table below:

Multiple Linear Regression - Estimated Regression Equation
werkl50[t] = + 92451.0982905983 + 12142.2820512820premie[t] -413.28632478629M1[t] -1882.95299145299M2[t] -4371.78632478633M3[t] -6482.45299145299M4[t] -8806.78632478633M5[t] -9328.11965811966M6[t] + 4621.33333333333M7[t] + 9485.16666666667M8[t] + 10731.8333333333M9[t] + 6585.66666666666M10[t] + 1554M11[t] + e[t]


Multiple Linear Regression - Ordinary Least Squares
VariableParameterS.D.T-STATH0: parameter = 02-tail p-value1-tail p-value
(Intercept)92451.09829059831421.27084465.048200
premie12142.2820512820840.25186514.450800
M1-413.286324786291754.720948-0.23550.8146140.407307
M2-1882.952991452991754.720948-1.07310.2876050.143803
M3-4371.786324786331754.720948-2.49140.0155540.007777
M4-6482.452991452991754.720948-3.69430.0004840.000242
M5-8806.786324786331754.720948-5.01895e-063e-06
M6-9328.119658119661754.720948-5.3162e-061e-06
M74621.333333333331749.1237382.64210.0105330.005267
M89485.166666666671749.1237385.42281e-061e-06
M910731.83333333331749.1237386.135500
M106585.666666666661749.1237383.76510.0003860.000193
M1115541749.1237380.88840.3779090.188955

\begin{tabular}{lllllllll}
\hline
Multiple Linear Regression - Ordinary Least Squares \tabularnewline
Variable & Parameter & S.D. & T-STATH0: parameter = 0 & 2-tail p-value & 1-tail p-value \tabularnewline
(Intercept) & 92451.0982905983 & 1421.270844 & 65.0482 & 0 & 0 \tabularnewline
premie & 12142.2820512820 & 840.251865 & 14.4508 & 0 & 0 \tabularnewline
M1 & -413.28632478629 & 1754.720948 & -0.2355 & 0.814614 & 0.407307 \tabularnewline
M2 & -1882.95299145299 & 1754.720948 & -1.0731 & 0.287605 & 0.143803 \tabularnewline
M3 & -4371.78632478633 & 1754.720948 & -2.4914 & 0.015554 & 0.007777 \tabularnewline
M4 & -6482.45299145299 & 1754.720948 & -3.6943 & 0.000484 & 0.000242 \tabularnewline
M5 & -8806.78632478633 & 1754.720948 & -5.0189 & 5e-06 & 3e-06 \tabularnewline
M6 & -9328.11965811966 & 1754.720948 & -5.316 & 2e-06 & 1e-06 \tabularnewline
M7 & 4621.33333333333 & 1749.123738 & 2.6421 & 0.010533 & 0.005267 \tabularnewline
M8 & 9485.16666666667 & 1749.123738 & 5.4228 & 1e-06 & 1e-06 \tabularnewline
M9 & 10731.8333333333 & 1749.123738 & 6.1355 & 0 & 0 \tabularnewline
M10 & 6585.66666666666 & 1749.123738 & 3.7651 & 0.000386 & 0.000193 \tabularnewline
M11 & 1554 & 1749.123738 & 0.8884 & 0.377909 & 0.188955 \tabularnewline
\hline
\end{tabular}
%Source: https://freestatistics.org/blog/index.php?pk=4480&T=2

[TABLE]
[ROW][C]Multiple Linear Regression - Ordinary Least Squares[/C][/ROW]
[ROW][C]Variable[/C][C]Parameter[/C][C]S.D.[/C][C]T-STATH0: parameter = 0[/C][C]2-tail p-value[/C][C]1-tail p-value[/C][/ROW]
[ROW][C](Intercept)[/C][C]92451.0982905983[/C][C]1421.270844[/C][C]65.0482[/C][C]0[/C][C]0[/C][/ROW]
[ROW][C]premie[/C][C]12142.2820512820[/C][C]840.251865[/C][C]14.4508[/C][C]0[/C][C]0[/C][/ROW]
[ROW][C]M1[/C][C]-413.28632478629[/C][C]1754.720948[/C][C]-0.2355[/C][C]0.814614[/C][C]0.407307[/C][/ROW]
[ROW][C]M2[/C][C]-1882.95299145299[/C][C]1754.720948[/C][C]-1.0731[/C][C]0.287605[/C][C]0.143803[/C][/ROW]
[ROW][C]M3[/C][C]-4371.78632478633[/C][C]1754.720948[/C][C]-2.4914[/C][C]0.015554[/C][C]0.007777[/C][/ROW]
[ROW][C]M4[/C][C]-6482.45299145299[/C][C]1754.720948[/C][C]-3.6943[/C][C]0.000484[/C][C]0.000242[/C][/ROW]
[ROW][C]M5[/C][C]-8806.78632478633[/C][C]1754.720948[/C][C]-5.0189[/C][C]5e-06[/C][C]3e-06[/C][/ROW]
[ROW][C]M6[/C][C]-9328.11965811966[/C][C]1754.720948[/C][C]-5.316[/C][C]2e-06[/C][C]1e-06[/C][/ROW]
[ROW][C]M7[/C][C]4621.33333333333[/C][C]1749.123738[/C][C]2.6421[/C][C]0.010533[/C][C]0.005267[/C][/ROW]
[ROW][C]M8[/C][C]9485.16666666667[/C][C]1749.123738[/C][C]5.4228[/C][C]1e-06[/C][C]1e-06[/C][/ROW]
[ROW][C]M9[/C][C]10731.8333333333[/C][C]1749.123738[/C][C]6.1355[/C][C]0[/C][C]0[/C][/ROW]
[ROW][C]M10[/C][C]6585.66666666666[/C][C]1749.123738[/C][C]3.7651[/C][C]0.000386[/C][C]0.000193[/C][/ROW]
[ROW][C]M11[/C][C]1554[/C][C]1749.123738[/C][C]0.8884[/C][C]0.377909[/C][C]0.188955[/C][/ROW]
[/TABLE]
Source: https://freestatistics.org/blog/index.php?pk=4480&T=2

Globally Unique Identifier (entire table): ba.freestatistics.org/blog/index.php?pk=4480&T=2

As an alternative you can also use a QR Code:  

The GUIDs for individual cells are displayed in the table below:

Multiple Linear Regression - Ordinary Least Squares
VariableParameterS.D.T-STATH0: parameter = 02-tail p-value1-tail p-value
(Intercept)92451.09829059831421.27084465.048200
premie12142.2820512820840.25186514.450800
M1-413.286324786291754.720948-0.23550.8146140.407307
M2-1882.952991452991754.720948-1.07310.2876050.143803
M3-4371.786324786331754.720948-2.49140.0155540.007777
M4-6482.452991452991754.720948-3.69430.0004840.000242
M5-8806.786324786331754.720948-5.01895e-063e-06
M6-9328.119658119661754.720948-5.3162e-061e-06
M74621.333333333331749.1237382.64210.0105330.005267
M89485.166666666671749.1237385.42281e-061e-06
M910731.83333333331749.1237386.135500
M106585.666666666661749.1237383.76510.0003860.000193
M1115541749.1237380.88840.3779090.188955


Multiple Linear Regression - Regression Statistics
Multiple R0.956206137182481
R-squared0.914330176785442
Adjusted R-squared0.896905805962142
F-TEST (value)52.4742147683632
F-TEST (DF numerator)12
F-TEST (DF denominator)59
p-value0
Multiple Linear Regression - Residual Statistics
Residual Standard Deviation3029.57118210534
Sum Squared Residuals541519791.299144

\begin{tabular}{lllllllll}
\hline
Multiple Linear Regression - Regression Statistics \tabularnewline
Multiple R & 0.956206137182481 \tabularnewline
R-squared & 0.914330176785442 \tabularnewline
Adjusted R-squared & 0.896905805962142 \tabularnewline
F-TEST (value) & 52.4742147683632 \tabularnewline
F-TEST (DF numerator) & 12 \tabularnewline
F-TEST (DF denominator) & 59 \tabularnewline
p-value & 0 \tabularnewline
Multiple Linear Regression - Residual Statistics \tabularnewline
Residual Standard Deviation & 3029.57118210534 \tabularnewline
Sum Squared Residuals & 541519791.299144 \tabularnewline
\hline
\end{tabular}
%Source: https://freestatistics.org/blog/index.php?pk=4480&T=3

[TABLE]
[ROW][C]Multiple Linear Regression - Regression Statistics[/C][/ROW]
[ROW][C]Multiple R[/C][C]0.956206137182481[/C][/ROW]
[ROW][C]R-squared[/C][C]0.914330176785442[/C][/ROW]
[ROW][C]Adjusted R-squared[/C][C]0.896905805962142[/C][/ROW]
[ROW][C]F-TEST (value)[/C][C]52.4742147683632[/C][/ROW]
[ROW][C]F-TEST (DF numerator)[/C][C]12[/C][/ROW]
[ROW][C]F-TEST (DF denominator)[/C][C]59[/C][/ROW]
[ROW][C]p-value[/C][C]0[/C][/ROW]
[ROW][C]Multiple Linear Regression - Residual Statistics[/C][/ROW]
[ROW][C]Residual Standard Deviation[/C][C]3029.57118210534[/C][/ROW]
[ROW][C]Sum Squared Residuals[/C][C]541519791.299144[/C][/ROW]
[/TABLE]
Source: https://freestatistics.org/blog/index.php?pk=4480&T=3

Globally Unique Identifier (entire table): ba.freestatistics.org/blog/index.php?pk=4480&T=3

As an alternative you can also use a QR Code:  

The GUIDs for individual cells are displayed in the table below:

Multiple Linear Regression - Regression Statistics
Multiple R0.956206137182481
R-squared0.914330176785442
Adjusted R-squared0.896905805962142
F-TEST (value)52.4742147683632
F-TEST (DF numerator)12
F-TEST (DF denominator)59
p-value0
Multiple Linear Regression - Residual Statistics
Residual Standard Deviation3029.57118210534
Sum Squared Residuals541519791.299144


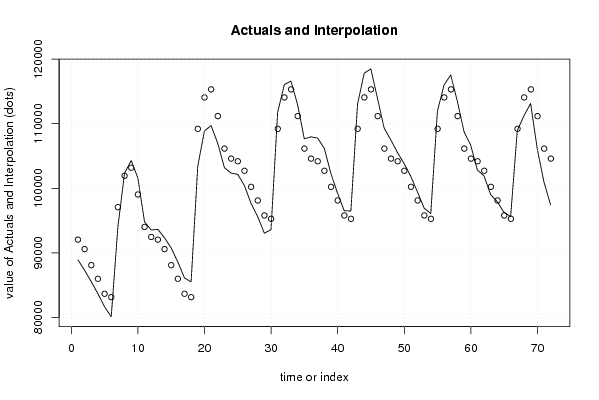
Multiple Linear Regression - Actuals, Interpolation, and Residuals
Time or IndexActualsInterpolationForecastResidualsPrediction Error
18890092037.8119658118-3137.81196581178
28728090568.1452991453-3288.14529914531
38551988079.311965812-2560.31196581197
48364785968.6452991453-2321.64529914531
58161683644.311965812-2028.31196581197
68010083122.9786324786-3022.97863247864
79402797072.4316239316-3045.43162393164
8102327101936.264957265390.735042735036
9104296103182.9316239321113.06837606837
1010159399036.7649572652556.23504273503
119481694005.0982905983810.90170940169
129353592451.09829059831083.9017094017
139361892037.8119658121580.18803418799
149233090568.14529914531761.85470085469
159075188079.3119658122671.68803418803
168857685968.64529914532607.35470085469
178610283644.3119658122457.68803418803
188549483122.97863247862371.02136752136
19103432109214.713675214-5782.71367521367
20108870114078.547008547-5208.54700854701
21109713115325.213675214-5612.21367521367
22106960111179.047008547-4219.04700854701
23103195106147.380341880-2952.38034188034
24102348104593.380341880-2245.38034188034
25102158104180.094017094-2022.09401709405
26100431102710.427350427-2279.42735042735
2797649100221.594017094-2572.59401709401
289561198110.9273504273-2499.92735042735
299303595786.594017094-2751.59401709401
309357995265.2606837607-1686.26068376068
31111777109214.7136752142562.28632478633
32116065114078.5470085471986.45299145299
33116609115325.2136752141283.78632478632
34112934111179.0470085471754.95299145299
35107660106147.3803418801512.61965811966
36107965104593.3803418803371.61965811966
37107772104180.0940170943591.90598290595
38106201102710.4273504273490.57264957265
39102288100221.5940170942066.40598290599
409921798110.92735042731106.07264957265
419651195786.594017094724.405982905987
429645695265.26068376071190.73931623932
43113021109214.7136752143806.28632478633
44117836114078.5470085473757.45299145299
45118492115325.2136752143166.78632478632
46113922111179.0470085472742.95299145299
47109317106147.3803418803169.61965811966
48107496104593.3803418802902.61965811966
49105524104180.0940170941343.90598290595
50103824102710.4273504271113.57264957265
51101833100221.5940170941611.40598290599
529943698110.92735042731325.07264957265
539691595786.5940170941128.40598290599
549607295265.2606837607806.73931623932
55111941109214.7136752142726.28632478633
56116008114078.5470085471929.45299145299
57117557115325.2136752142231.78632478632
58113445111179.0470085472265.95299145299
59108762106147.3803418802614.61965811966
60106661104593.3803418802067.61965811966
61102824104180.094017094-1356.09401709405
62101912102710.427350427-798.427350427346
6399005100221.594017094-1216.59401709401
649789498110.9273504273-216.927350427346
659625695786.594017094469.405982905986
669560695265.2606837607340.739316239321
67108948109214.713675214-266.713675213673
68111223114078.547008547-2855.54700854701
69113142115325.213675214-2183.21367521367
70106078111179.047008547-5101.04700854701
71100992106147.380341880-5155.38034188034
7297413104593.380341880-7180.38034188034

\begin{tabular}{lllllllll}
\hline
Multiple Linear Regression - Actuals, Interpolation, and Residuals \tabularnewline
Time or Index & Actuals & InterpolationForecast & ResidualsPrediction Error \tabularnewline
1 & 88900 & 92037.8119658118 & -3137.81196581178 \tabularnewline
2 & 87280 & 90568.1452991453 & -3288.14529914531 \tabularnewline
3 & 85519 & 88079.311965812 & -2560.31196581197 \tabularnewline
4 & 83647 & 85968.6452991453 & -2321.64529914531 \tabularnewline
5 & 81616 & 83644.311965812 & -2028.31196581197 \tabularnewline
6 & 80100 & 83122.9786324786 & -3022.97863247864 \tabularnewline
7 & 94027 & 97072.4316239316 & -3045.43162393164 \tabularnewline
8 & 102327 & 101936.264957265 & 390.735042735036 \tabularnewline
9 & 104296 & 103182.931623932 & 1113.06837606837 \tabularnewline
10 & 101593 & 99036.764957265 & 2556.23504273503 \tabularnewline
11 & 94816 & 94005.0982905983 & 810.90170940169 \tabularnewline
12 & 93535 & 92451.0982905983 & 1083.9017094017 \tabularnewline
13 & 93618 & 92037.811965812 & 1580.18803418799 \tabularnewline
14 & 92330 & 90568.1452991453 & 1761.85470085469 \tabularnewline
15 & 90751 & 88079.311965812 & 2671.68803418803 \tabularnewline
16 & 88576 & 85968.6452991453 & 2607.35470085469 \tabularnewline
17 & 86102 & 83644.311965812 & 2457.68803418803 \tabularnewline
18 & 85494 & 83122.9786324786 & 2371.02136752136 \tabularnewline
19 & 103432 & 109214.713675214 & -5782.71367521367 \tabularnewline
20 & 108870 & 114078.547008547 & -5208.54700854701 \tabularnewline
21 & 109713 & 115325.213675214 & -5612.21367521367 \tabularnewline
22 & 106960 & 111179.047008547 & -4219.04700854701 \tabularnewline
23 & 103195 & 106147.380341880 & -2952.38034188034 \tabularnewline
24 & 102348 & 104593.380341880 & -2245.38034188034 \tabularnewline
25 & 102158 & 104180.094017094 & -2022.09401709405 \tabularnewline
26 & 100431 & 102710.427350427 & -2279.42735042735 \tabularnewline
27 & 97649 & 100221.594017094 & -2572.59401709401 \tabularnewline
28 & 95611 & 98110.9273504273 & -2499.92735042735 \tabularnewline
29 & 93035 & 95786.594017094 & -2751.59401709401 \tabularnewline
30 & 93579 & 95265.2606837607 & -1686.26068376068 \tabularnewline
31 & 111777 & 109214.713675214 & 2562.28632478633 \tabularnewline
32 & 116065 & 114078.547008547 & 1986.45299145299 \tabularnewline
33 & 116609 & 115325.213675214 & 1283.78632478632 \tabularnewline
34 & 112934 & 111179.047008547 & 1754.95299145299 \tabularnewline
35 & 107660 & 106147.380341880 & 1512.61965811966 \tabularnewline
36 & 107965 & 104593.380341880 & 3371.61965811966 \tabularnewline
37 & 107772 & 104180.094017094 & 3591.90598290595 \tabularnewline
38 & 106201 & 102710.427350427 & 3490.57264957265 \tabularnewline
39 & 102288 & 100221.594017094 & 2066.40598290599 \tabularnewline
40 & 99217 & 98110.9273504273 & 1106.07264957265 \tabularnewline
41 & 96511 & 95786.594017094 & 724.405982905987 \tabularnewline
42 & 96456 & 95265.2606837607 & 1190.73931623932 \tabularnewline
43 & 113021 & 109214.713675214 & 3806.28632478633 \tabularnewline
44 & 117836 & 114078.547008547 & 3757.45299145299 \tabularnewline
45 & 118492 & 115325.213675214 & 3166.78632478632 \tabularnewline
46 & 113922 & 111179.047008547 & 2742.95299145299 \tabularnewline
47 & 109317 & 106147.380341880 & 3169.61965811966 \tabularnewline
48 & 107496 & 104593.380341880 & 2902.61965811966 \tabularnewline
49 & 105524 & 104180.094017094 & 1343.90598290595 \tabularnewline
50 & 103824 & 102710.427350427 & 1113.57264957265 \tabularnewline
51 & 101833 & 100221.594017094 & 1611.40598290599 \tabularnewline
52 & 99436 & 98110.9273504273 & 1325.07264957265 \tabularnewline
53 & 96915 & 95786.594017094 & 1128.40598290599 \tabularnewline
54 & 96072 & 95265.2606837607 & 806.73931623932 \tabularnewline
55 & 111941 & 109214.713675214 & 2726.28632478633 \tabularnewline
56 & 116008 & 114078.547008547 & 1929.45299145299 \tabularnewline
57 & 117557 & 115325.213675214 & 2231.78632478632 \tabularnewline
58 & 113445 & 111179.047008547 & 2265.95299145299 \tabularnewline
59 & 108762 & 106147.380341880 & 2614.61965811966 \tabularnewline
60 & 106661 & 104593.380341880 & 2067.61965811966 \tabularnewline
61 & 102824 & 104180.094017094 & -1356.09401709405 \tabularnewline
62 & 101912 & 102710.427350427 & -798.427350427346 \tabularnewline
63 & 99005 & 100221.594017094 & -1216.59401709401 \tabularnewline
64 & 97894 & 98110.9273504273 & -216.927350427346 \tabularnewline
65 & 96256 & 95786.594017094 & 469.405982905986 \tabularnewline
66 & 95606 & 95265.2606837607 & 340.739316239321 \tabularnewline
67 & 108948 & 109214.713675214 & -266.713675213673 \tabularnewline
68 & 111223 & 114078.547008547 & -2855.54700854701 \tabularnewline
69 & 113142 & 115325.213675214 & -2183.21367521367 \tabularnewline
70 & 106078 & 111179.047008547 & -5101.04700854701 \tabularnewline
71 & 100992 & 106147.380341880 & -5155.38034188034 \tabularnewline
72 & 97413 & 104593.380341880 & -7180.38034188034 \tabularnewline
\hline
\end{tabular}
%Source: https://freestatistics.org/blog/index.php?pk=4480&T=4

[TABLE]
[ROW][C]Multiple Linear Regression - Actuals, Interpolation, and Residuals[/C][/ROW]
[ROW][C]Time or Index[/C][C]Actuals[/C][C]InterpolationForecast[/C][C]ResidualsPrediction Error[/C][/ROW]
[ROW][C]1[/C][C]88900[/C][C]92037.8119658118[/C][C]-3137.81196581178[/C][/ROW]
[ROW][C]2[/C][C]87280[/C][C]90568.1452991453[/C][C]-3288.14529914531[/C][/ROW]
[ROW][C]3[/C][C]85519[/C][C]88079.311965812[/C][C]-2560.31196581197[/C][/ROW]
[ROW][C]4[/C][C]83647[/C][C]85968.6452991453[/C][C]-2321.64529914531[/C][/ROW]
[ROW][C]5[/C][C]81616[/C][C]83644.311965812[/C][C]-2028.31196581197[/C][/ROW]
[ROW][C]6[/C][C]80100[/C][C]83122.9786324786[/C][C]-3022.97863247864[/C][/ROW]
[ROW][C]7[/C][C]94027[/C][C]97072.4316239316[/C][C]-3045.43162393164[/C][/ROW]
[ROW][C]8[/C][C]102327[/C][C]101936.264957265[/C][C]390.735042735036[/C][/ROW]
[ROW][C]9[/C][C]104296[/C][C]103182.931623932[/C][C]1113.06837606837[/C][/ROW]
[ROW][C]10[/C][C]101593[/C][C]99036.764957265[/C][C]2556.23504273503[/C][/ROW]
[ROW][C]11[/C][C]94816[/C][C]94005.0982905983[/C][C]810.90170940169[/C][/ROW]
[ROW][C]12[/C][C]93535[/C][C]92451.0982905983[/C][C]1083.9017094017[/C][/ROW]
[ROW][C]13[/C][C]93618[/C][C]92037.811965812[/C][C]1580.18803418799[/C][/ROW]
[ROW][C]14[/C][C]92330[/C][C]90568.1452991453[/C][C]1761.85470085469[/C][/ROW]
[ROW][C]15[/C][C]90751[/C][C]88079.311965812[/C][C]2671.68803418803[/C][/ROW]
[ROW][C]16[/C][C]88576[/C][C]85968.6452991453[/C][C]2607.35470085469[/C][/ROW]
[ROW][C]17[/C][C]86102[/C][C]83644.311965812[/C][C]2457.68803418803[/C][/ROW]
[ROW][C]18[/C][C]85494[/C][C]83122.9786324786[/C][C]2371.02136752136[/C][/ROW]
[ROW][C]19[/C][C]103432[/C][C]109214.713675214[/C][C]-5782.71367521367[/C][/ROW]
[ROW][C]20[/C][C]108870[/C][C]114078.547008547[/C][C]-5208.54700854701[/C][/ROW]
[ROW][C]21[/C][C]109713[/C][C]115325.213675214[/C][C]-5612.21367521367[/C][/ROW]
[ROW][C]22[/C][C]106960[/C][C]111179.047008547[/C][C]-4219.04700854701[/C][/ROW]
[ROW][C]23[/C][C]103195[/C][C]106147.380341880[/C][C]-2952.38034188034[/C][/ROW]
[ROW][C]24[/C][C]102348[/C][C]104593.380341880[/C][C]-2245.38034188034[/C][/ROW]
[ROW][C]25[/C][C]102158[/C][C]104180.094017094[/C][C]-2022.09401709405[/C][/ROW]
[ROW][C]26[/C][C]100431[/C][C]102710.427350427[/C][C]-2279.42735042735[/C][/ROW]
[ROW][C]27[/C][C]97649[/C][C]100221.594017094[/C][C]-2572.59401709401[/C][/ROW]
[ROW][C]28[/C][C]95611[/C][C]98110.9273504273[/C][C]-2499.92735042735[/C][/ROW]
[ROW][C]29[/C][C]93035[/C][C]95786.594017094[/C][C]-2751.59401709401[/C][/ROW]
[ROW][C]30[/C][C]93579[/C][C]95265.2606837607[/C][C]-1686.26068376068[/C][/ROW]
[ROW][C]31[/C][C]111777[/C][C]109214.713675214[/C][C]2562.28632478633[/C][/ROW]
[ROW][C]32[/C][C]116065[/C][C]114078.547008547[/C][C]1986.45299145299[/C][/ROW]
[ROW][C]33[/C][C]116609[/C][C]115325.213675214[/C][C]1283.78632478632[/C][/ROW]
[ROW][C]34[/C][C]112934[/C][C]111179.047008547[/C][C]1754.95299145299[/C][/ROW]
[ROW][C]35[/C][C]107660[/C][C]106147.380341880[/C][C]1512.61965811966[/C][/ROW]
[ROW][C]36[/C][C]107965[/C][C]104593.380341880[/C][C]3371.61965811966[/C][/ROW]
[ROW][C]37[/C][C]107772[/C][C]104180.094017094[/C][C]3591.90598290595[/C][/ROW]
[ROW][C]38[/C][C]106201[/C][C]102710.427350427[/C][C]3490.57264957265[/C][/ROW]
[ROW][C]39[/C][C]102288[/C][C]100221.594017094[/C][C]2066.40598290599[/C][/ROW]
[ROW][C]40[/C][C]99217[/C][C]98110.9273504273[/C][C]1106.07264957265[/C][/ROW]
[ROW][C]41[/C][C]96511[/C][C]95786.594017094[/C][C]724.405982905987[/C][/ROW]
[ROW][C]42[/C][C]96456[/C][C]95265.2606837607[/C][C]1190.73931623932[/C][/ROW]
[ROW][C]43[/C][C]113021[/C][C]109214.713675214[/C][C]3806.28632478633[/C][/ROW]
[ROW][C]44[/C][C]117836[/C][C]114078.547008547[/C][C]3757.45299145299[/C][/ROW]
[ROW][C]45[/C][C]118492[/C][C]115325.213675214[/C][C]3166.78632478632[/C][/ROW]
[ROW][C]46[/C][C]113922[/C][C]111179.047008547[/C][C]2742.95299145299[/C][/ROW]
[ROW][C]47[/C][C]109317[/C][C]106147.380341880[/C][C]3169.61965811966[/C][/ROW]
[ROW][C]48[/C][C]107496[/C][C]104593.380341880[/C][C]2902.61965811966[/C][/ROW]
[ROW][C]49[/C][C]105524[/C][C]104180.094017094[/C][C]1343.90598290595[/C][/ROW]
[ROW][C]50[/C][C]103824[/C][C]102710.427350427[/C][C]1113.57264957265[/C][/ROW]
[ROW][C]51[/C][C]101833[/C][C]100221.594017094[/C][C]1611.40598290599[/C][/ROW]
[ROW][C]52[/C][C]99436[/C][C]98110.9273504273[/C][C]1325.07264957265[/C][/ROW]
[ROW][C]53[/C][C]96915[/C][C]95786.594017094[/C][C]1128.40598290599[/C][/ROW]
[ROW][C]54[/C][C]96072[/C][C]95265.2606837607[/C][C]806.73931623932[/C][/ROW]
[ROW][C]55[/C][C]111941[/C][C]109214.713675214[/C][C]2726.28632478633[/C][/ROW]
[ROW][C]56[/C][C]116008[/C][C]114078.547008547[/C][C]1929.45299145299[/C][/ROW]
[ROW][C]57[/C][C]117557[/C][C]115325.213675214[/C][C]2231.78632478632[/C][/ROW]
[ROW][C]58[/C][C]113445[/C][C]111179.047008547[/C][C]2265.95299145299[/C][/ROW]
[ROW][C]59[/C][C]108762[/C][C]106147.380341880[/C][C]2614.61965811966[/C][/ROW]
[ROW][C]60[/C][C]106661[/C][C]104593.380341880[/C][C]2067.61965811966[/C][/ROW]
[ROW][C]61[/C][C]102824[/C][C]104180.094017094[/C][C]-1356.09401709405[/C][/ROW]
[ROW][C]62[/C][C]101912[/C][C]102710.427350427[/C][C]-798.427350427346[/C][/ROW]
[ROW][C]63[/C][C]99005[/C][C]100221.594017094[/C][C]-1216.59401709401[/C][/ROW]
[ROW][C]64[/C][C]97894[/C][C]98110.9273504273[/C][C]-216.927350427346[/C][/ROW]
[ROW][C]65[/C][C]96256[/C][C]95786.594017094[/C][C]469.405982905986[/C][/ROW]
[ROW][C]66[/C][C]95606[/C][C]95265.2606837607[/C][C]340.739316239321[/C][/ROW]
[ROW][C]67[/C][C]108948[/C][C]109214.713675214[/C][C]-266.713675213673[/C][/ROW]
[ROW][C]68[/C][C]111223[/C][C]114078.547008547[/C][C]-2855.54700854701[/C][/ROW]
[ROW][C]69[/C][C]113142[/C][C]115325.213675214[/C][C]-2183.21367521367[/C][/ROW]
[ROW][C]70[/C][C]106078[/C][C]111179.047008547[/C][C]-5101.04700854701[/C][/ROW]
[ROW][C]71[/C][C]100992[/C][C]106147.380341880[/C][C]-5155.38034188034[/C][/ROW]
[ROW][C]72[/C][C]97413[/C][C]104593.380341880[/C][C]-7180.38034188034[/C][/ROW]
[/TABLE]
Source: https://freestatistics.org/blog/index.php?pk=4480&T=4

Globally Unique Identifier (entire table): ba.freestatistics.org/blog/index.php?pk=4480&T=4

As an alternative you can also use a QR Code:  

The GUIDs for individual cells are displayed in the table below:

Multiple Linear Regression - Actuals, Interpolation, and Residuals
Time or IndexActualsInterpolationForecastResidualsPrediction Error
18890092037.8119658118-3137.81196581178
28728090568.1452991453-3288.14529914531
38551988079.311965812-2560.31196581197
48364785968.6452991453-2321.64529914531
58161683644.311965812-2028.31196581197
68010083122.9786324786-3022.97863247864
79402797072.4316239316-3045.43162393164
8102327101936.264957265390.735042735036
9104296103182.9316239321113.06837606837
1010159399036.7649572652556.23504273503
119481694005.0982905983810.90170940169
129353592451.09829059831083.9017094017
139361892037.8119658121580.18803418799
149233090568.14529914531761.85470085469
159075188079.3119658122671.68803418803
168857685968.64529914532607.35470085469
178610283644.3119658122457.68803418803
188549483122.97863247862371.02136752136
19103432109214.713675214-5782.71367521367
20108870114078.547008547-5208.54700854701
21109713115325.213675214-5612.21367521367
22106960111179.047008547-4219.04700854701
23103195106147.380341880-2952.38034188034
24102348104593.380341880-2245.38034188034
25102158104180.094017094-2022.09401709405
26100431102710.427350427-2279.42735042735
2797649100221.594017094-2572.59401709401
289561198110.9273504273-2499.92735042735
299303595786.594017094-2751.59401709401
309357995265.2606837607-1686.26068376068
31111777109214.7136752142562.28632478633
32116065114078.5470085471986.45299145299
33116609115325.2136752141283.78632478632
34112934111179.0470085471754.95299145299
35107660106147.3803418801512.61965811966
36107965104593.3803418803371.61965811966
37107772104180.0940170943591.90598290595
38106201102710.4273504273490.57264957265
39102288100221.5940170942066.40598290599
409921798110.92735042731106.07264957265
419651195786.594017094724.405982905987
429645695265.26068376071190.73931623932
43113021109214.7136752143806.28632478633
44117836114078.5470085473757.45299145299
45118492115325.2136752143166.78632478632
46113922111179.0470085472742.95299145299
47109317106147.3803418803169.61965811966
48107496104593.3803418802902.61965811966
49105524104180.0940170941343.90598290595
50103824102710.4273504271113.57264957265
51101833100221.5940170941611.40598290599
529943698110.92735042731325.07264957265
539691595786.5940170941128.40598290599
549607295265.2606837607806.73931623932
55111941109214.7136752142726.28632478633
56116008114078.5470085471929.45299145299
57117557115325.2136752142231.78632478632
58113445111179.0470085472265.95299145299
59108762106147.3803418802614.61965811966
60106661104593.3803418802067.61965811966
61102824104180.094017094-1356.09401709405
62101912102710.427350427-798.427350427346
6399005100221.594017094-1216.59401709401
649789498110.9273504273-216.927350427346
659625695786.594017094469.405982905986
669560695265.2606837607340.739316239321
67108948109214.713675214-266.713675213673
68111223114078.547008547-2855.54700854701
69113142115325.213675214-2183.21367521367
70106078111179.047008547-5101.04700854701
71100992106147.380341880-5155.38034188034
7297413104593.380341880-7180.38034188034


Parameters (Session):
par1 = 1 ; par2 = Include Monthly Dummies ; par3 = No Linear Trend ;
Parameters (R input):
par1 = 1 ; par2 = Include Monthly Dummies ; par3 = No Linear Trend ;
R code (references can be found in the software module):
library(lattice)
par1 <- as.numeric(par1)
x <- t(y)
k <- length(x[1,])
n <- length(x[,1])
x1 <- cbind(x[,par1], x[,1:k!=par1])
mycolnames <- c(colnames(x)[par1], colnames(x)[1:k!=par1])
colnames(x1) <- mycolnames #colnames(x)[par1]
x <- x1
if (par3 == 'First Differences'){
x2 <- array(0, dim=c(n-1,k), dimnames=list(1:(n-1), paste('(1-B)',colnames(x),sep='')))
for (i in 1:n-1) {
for (j in 1:k) {
x2[i,j] <- x[i+1,j] - x[i,j]
}
}
x <- x2
}
if (par2 == 'Include Monthly Dummies'){
x2 <- array(0, dim=c(n,11), dimnames=list(1:n, paste('M', seq(1:11), sep ='')))
for (i in 1:11){
x2[seq(i,n,12),i] <- 1
}
x <- cbind(x, x2)
}
if (par2 == 'Include Quarterly Dummies'){
x2 <- array(0, dim=c(n,3), dimnames=list(1:n, paste('Q', seq(1:3), sep ='')))
for (i in 1:3){
x2[seq(i,n,4),i] <- 1
}
x <- cbind(x, x2)
}
k <- length(x[1,])
if (par3 == 'Linear Trend'){
x <- cbind(x, c(1:n))
colnames(x)[k+1] <- 't'
}
x
k <- length(x[1,])
df <- as.data.frame(x)
(mylm <- lm(df))
(mysum <- summary(mylm))
bitmap(file='test0.png')
plot(x[,1], type='l', main='Actuals and Interpolation', ylab='value of Actuals and Interpolation (dots)', xlab='time or index')
points(x[,1]-mysum$resid)
grid()
dev.off()
bitmap(file='test1.png')
plot(mysum$resid, type='b', pch=19, main='Residuals', ylab='value of Residuals', xlab='time or index')
grid()
dev.off()
bitmap(file='test2.png')
hist(mysum$resid, main='Residual Histogram', xlab='values of Residuals')
grid()
dev.off()
bitmap(file='test3.png')
densityplot(~mysum$resid,col='black',main='Residual Density Plot', xlab='values of Residuals')
dev.off()
bitmap(file='test4.png')
qqnorm(mysum$resid, main='Residual Normal Q-Q Plot')
grid()
dev.off()
(myerror <- as.ts(mysum$resid))
bitmap(file='test5.png')
dum <- cbind(lag(myerror,k=1),myerror)
dum
dum1 <- dum[2:length(myerror),]
dum1
z <- as.data.frame(dum1)
z
plot(z,main=paste('Residual Lag plot, lowess, and regression line'), ylab='values of Residuals', xlab='lagged values of Residuals')
lines(lowess(z))
abline(lm(z))
grid()
dev.off()
bitmap(file='test6.png')
acf(mysum$resid, lag.max=length(mysum$resid)/2, main='Residual Autocorrelation Function')
grid()
dev.off()
bitmap(file='test7.png')
pacf(mysum$resid, lag.max=length(mysum$resid)/2, main='Residual Partial Autocorrelation Function')
grid()
dev.off()
bitmap(file='test8.png')
opar <- par(mfrow = c(2,2), oma = c(0, 0, 1.1, 0))
plot(mylm, las = 1, sub='Residual Diagnostics')
par(opar)
dev.off()
load(file='createtable')
a<-table.start()
a<-table.row.start(a)
a<-table.element(a, 'Multiple Linear Regression - Estimated Regression Equation', 1, TRUE)
a<-table.row.end(a)
myeq <- colnames(x)[1]
myeq <- paste(myeq, '[t] = ', sep='')
for (i in 1:k){
if (mysum$coefficients[i,1] > 0) myeq <- paste(myeq, '+', '')
myeq <- paste(myeq, mysum$coefficients[i,1], sep=' ')
if (rownames(mysum$coefficients)[i] != '(Intercept)') {
myeq <- paste(myeq, rownames(mysum$coefficients)[i], sep='')
if (rownames(mysum$coefficients)[i] != 't') myeq <- paste(myeq, '[t]', sep='')
}
}
myeq <- paste(myeq, ' + e[t]')
a<-table.row.start(a)
a<-table.element(a, myeq)
a<-table.row.end(a)
a<-table.end(a)
table.save(a,file='mytable1.tab')
a<-table.start()
a<-table.row.start(a)
a<-table.element(a,hyperlink('ols1.htm','Multiple Linear Regression - Ordinary Least Squares',''), 6, TRUE)
a<-table.row.end(a)
a<-table.row.start(a)
a<-table.element(a,'Variable',header=TRUE)
a<-table.element(a,'Parameter',header=TRUE)
a<-table.element(a,'S.D.',header=TRUE)
a<-table.element(a,'T-STAT
H0: parameter = 0',header=TRUE)
a<-table.element(a,'2-tail p-value',header=TRUE)
a<-table.element(a,'1-tail p-value',header=TRUE)
a<-table.row.end(a)
for (i in 1:k){
a<-table.row.start(a)
a<-table.element(a,rownames(mysum$coefficients)[i],header=TRUE)
a<-table.element(a,mysum$coefficients[i,1])
a<-table.element(a, round(mysum$coefficients[i,2],6))
a<-table.element(a, round(mysum$coefficients[i,3],4))
a<-table.element(a, round(mysum$coefficients[i,4],6))
a<-table.element(a, round(mysum$coefficients[i,4]/2,6))
a<-table.row.end(a)
}
a<-table.end(a)
table.save(a,file='mytable2.tab')
a<-table.start()
a<-table.row.start(a)
a<-table.element(a, 'Multiple Linear Regression - Regression Statistics', 2, TRUE)
a<-table.row.end(a)
a<-table.row.start(a)
a<-table.element(a, 'Multiple R',1,TRUE)
a<-table.element(a, sqrt(mysum$r.squared))
a<-table.row.end(a)
a<-table.row.start(a)
a<-table.element(a, 'R-squared',1,TRUE)
a<-table.element(a, mysum$r.squared)
a<-table.row.end(a)
a<-table.row.start(a)
a<-table.element(a, 'Adjusted R-squared',1,TRUE)
a<-table.element(a, mysum$adj.r.squared)
a<-table.row.end(a)
a<-table.row.start(a)
a<-table.element(a, 'F-TEST (value)',1,TRUE)
a<-table.element(a, mysum$fstatistic[1])
a<-table.row.end(a)
a<-table.row.start(a)
a<-table.element(a, 'F-TEST (DF numerator)',1,TRUE)
a<-table.element(a, mysum$fstatistic[2])
a<-table.row.end(a)
a<-table.row.start(a)
a<-table.element(a, 'F-TEST (DF denominator)',1,TRUE)
a<-table.element(a, mysum$fstatistic[3])
a<-table.row.end(a)
a<-table.row.start(a)
a<-table.element(a, 'p-value',1,TRUE)
a<-table.element(a, 1-pf(mysum$fstatistic[1],mysum$fstatistic[2],mysum$fstatistic[3]))
a<-table.row.end(a)
a<-table.row.start(a)
a<-table.element(a, 'Multiple Linear Regression - Residual Statistics', 2, TRUE)
a<-table.row.end(a)
a<-table.row.start(a)
a<-table.element(a, 'Residual Standard Deviation',1,TRUE)
a<-table.element(a, mysum$sigma)
a<-table.row.end(a)
a<-table.row.start(a)
a<-table.element(a, 'Sum Squared Residuals',1,TRUE)
a<-table.element(a, sum(myerror*myerror))
a<-table.row.end(a)
a<-table.end(a)
table.save(a,file='mytable3.tab')
a<-table.start()
a<-table.row.start(a)
a<-table.element(a, 'Multiple Linear Regression - Actuals, Interpolation, and Residuals', 4, TRUE)
a<-table.row.end(a)
a<-table.row.start(a)
a<-table.element(a, 'Time or Index', 1, TRUE)
a<-table.element(a, 'Actuals', 1, TRUE)
a<-table.element(a, 'Interpolation
Forecast', 1, TRUE)
a<-table.element(a, 'Residuals
Prediction Error', 1, TRUE)
a<-table.row.end(a)
for (i in 1:n) {
a<-table.row.start(a)
a<-table.element(a,i, 1, TRUE)
a<-table.element(a,x[i])
a<-table.element(a,x[i]-mysum$resid[i])
a<-table.element(a,mysum$resid[i])
a<-table.row.end(a)
}
a<-table.end(a)
table.save(a,file='mytable4.tab')