Free Statistics

of Irreproducible Research!

Author's title

Author*Unverified author*
R Software Modulerwasp_autocorrelation.wasp
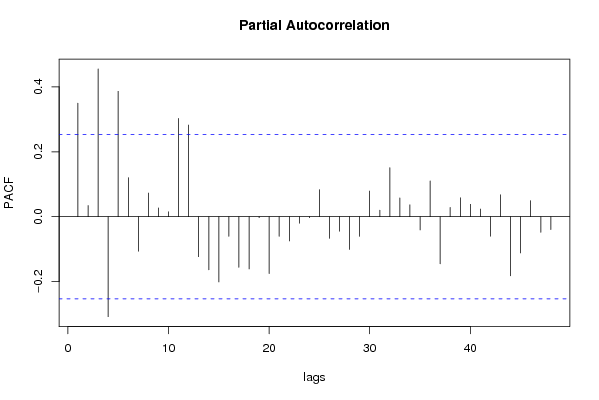
Title produced by software(Partial) Autocorrelation Function
Date of computationTue, 18 Dec 2007 00:45:57 -0700
Cite this page as followsStatistical Computations at FreeStatistics.org, Office for Research Development and Education, URL https://freestatistics.org/blog/index.php?v=date/2007/Dec/18/t1197963041i428omdz0tlr4fc.htm/, Retrieved Sat, 04 May 2024 07:18:39 +0000
Statistical Computations at FreeStatistics.org, Office for Research Development and Education, URL https://freestatistics.org/blog/index.php?pk=4452, Retrieved Sat, 04 May 2024 07:18:39 +0000
QR Codes:

Original text written by user:
IsPrivate?No (this computation is public)
User-defined keywords
Estimated Impact212
Family? (F = Feedback message, R = changed R code, M = changed R Module, P = changed Parameters, D = changed Data)
-       [(Partial) Autocorrelation Function] [ACF - Serie 4 - P...] [2007-12-18 07:45:57] [921757a21ec3444367392306fe4aab7f] [Current]
Feedback Forum

Post a new message
Dataseries X:
116,2
119,8
117,2
127,3
107,7
97,5
120,1
110,6
111,3
119,8
105,5
108,7
128,7
119,5
121,1
128,4
108,8
107,5
125,6
102,9
107,5
120,4
104,3
100,6
121,9
112,7
124,9
123,9
102,2
104,9
109,8
98,9
107,3
112,6
104
110,6
100,8
103,8
117
108,4
95,5
96,9
103,9
101,1
100,6
104,3
98
99,5
97,4
105,6
117,5
107,4
97,8
91,5
107,7
100,1
96,6
106,8
98
98,6


Summary of compuational transaction
Raw Inputview raw input (R code)
Raw Outputview raw output of R engine
Computing time1 seconds
R Server'Gwilym Jenkins' @ 72.249.127.135

\begin{tabular}{lllllllll}
\hline
Summary of compuational transaction \tabularnewline
Raw Input & view raw input (R code)  \tabularnewline
Raw Output & view raw output of R engine  \tabularnewline
Computing time & 1 seconds \tabularnewline
R Server & 'Gwilym Jenkins' @ 72.249.127.135 \tabularnewline
\hline
\end{tabular}
%Source: https://freestatistics.org/blog/index.php?pk=4452&T=0

[TABLE]
[ROW][C]Summary of compuational transaction[/C][/ROW]
[ROW][C]Raw Input[/C][C]view raw input (R code) [/C][/ROW]
[ROW][C]Raw Output[/C][C]view raw output of R engine [/C][/ROW]
[ROW][C]Computing time[/C][C]1 seconds[/C][/ROW]
[ROW][C]R Server[/C][C]'Gwilym Jenkins' @ 72.249.127.135[/C][/ROW]
[/TABLE]
Source: https://freestatistics.org/blog/index.php?pk=4452&T=0

Globally Unique Identifier (entire table): ba.freestatistics.org/blog/index.php?pk=4452&T=0

As an alternative you can also use a QR Code:  

The GUIDs for individual cells are displayed in the table below:

Summary of compuational transaction
Raw Inputview raw input (R code)
Raw Outputview raw output of R engine
Computing time1 seconds
R Server'Gwilym Jenkins' @ 72.249.127.135


Autocorrelation Function
Time lag kACF(k)T-STATP-value
017.7460
10.3495722.70780.004406
20.1522491.17930.121464
30.4624043.58180.000342
40.0758020.58720.27965
50.1826581.41490.081139
60.4875363.77640.000184
70.0745190.57720.282974
80.1250150.96840.168376
90.34042.63670.005321
100.0332350.25740.398861
110.292722.26740.01349
120.5860274.53931.4e-05
130.1341.0380.151728
140.1129640.8750.192526
150.2005751.55360.062764
16-0.093721-0.7260.764657
170.0642690.49780.310213
180.1493221.15660.126001
19-0.117045-0.90660.815885
20-0.046254-0.35830.639304
21-0.01333-0.10330.540948
22-0.164819-1.27670.896683
230.0545820.42280.33698
240.1527161.18290.120751
25-0.046416-0.35950.639771
26-0.067842-0.52550.699414
27-0.12683-0.98240.835081
28-0.263166-2.03850.977042
29-0.170912-1.32390.904718
30-0.116341-0.90120.81445
31-0.210528-1.63070.945908
32-0.17431-1.35020.908989
33-0.172062-1.33280.906179
34-0.228223-1.76780.958911
35-0.123199-0.95430.828119
36-0.001634-0.01270.505029
37-0.126459-0.97950.834378
38-0.181516-1.4060.917562
39-0.142871-1.10670.863574
40-0.239789-1.85740.965918
41-0.208492-1.6150.944218
42-0.099801-0.77310.778737
43-0.162158-1.25610.893021
44-0.192769-1.49320.929685
45-0.162984-1.26250.894167
46-0.161309-1.24950.891832
47-0.089768-0.69530.755238

\begin{tabular}{lllllllll}
\hline
Autocorrelation Function \tabularnewline
Time lag k & ACF(k) & T-STAT & P-value \tabularnewline
0 & 1 & 7.746 & 0 \tabularnewline
1 & 0.349572 & 2.7078 & 0.004406 \tabularnewline
2 & 0.152249 & 1.1793 & 0.121464 \tabularnewline
3 & 0.462404 & 3.5818 & 0.000342 \tabularnewline
4 & 0.075802 & 0.5872 & 0.27965 \tabularnewline
5 & 0.182658 & 1.4149 & 0.081139 \tabularnewline
6 & 0.487536 & 3.7764 & 0.000184 \tabularnewline
7 & 0.074519 & 0.5772 & 0.282974 \tabularnewline
8 & 0.125015 & 0.9684 & 0.168376 \tabularnewline
9 & 0.3404 & 2.6367 & 0.005321 \tabularnewline
10 & 0.033235 & 0.2574 & 0.398861 \tabularnewline
11 & 0.29272 & 2.2674 & 0.01349 \tabularnewline
12 & 0.586027 & 4.5393 & 1.4e-05 \tabularnewline
13 & 0.134 & 1.038 & 0.151728 \tabularnewline
14 & 0.112964 & 0.875 & 0.192526 \tabularnewline
15 & 0.200575 & 1.5536 & 0.062764 \tabularnewline
16 & -0.093721 & -0.726 & 0.764657 \tabularnewline
17 & 0.064269 & 0.4978 & 0.310213 \tabularnewline
18 & 0.149322 & 1.1566 & 0.126001 \tabularnewline
19 & -0.117045 & -0.9066 & 0.815885 \tabularnewline
20 & -0.046254 & -0.3583 & 0.639304 \tabularnewline
21 & -0.01333 & -0.1033 & 0.540948 \tabularnewline
22 & -0.164819 & -1.2767 & 0.896683 \tabularnewline
23 & 0.054582 & 0.4228 & 0.33698 \tabularnewline
24 & 0.152716 & 1.1829 & 0.120751 \tabularnewline
25 & -0.046416 & -0.3595 & 0.639771 \tabularnewline
26 & -0.067842 & -0.5255 & 0.699414 \tabularnewline
27 & -0.12683 & -0.9824 & 0.835081 \tabularnewline
28 & -0.263166 & -2.0385 & 0.977042 \tabularnewline
29 & -0.170912 & -1.3239 & 0.904718 \tabularnewline
30 & -0.116341 & -0.9012 & 0.81445 \tabularnewline
31 & -0.210528 & -1.6307 & 0.945908 \tabularnewline
32 & -0.17431 & -1.3502 & 0.908989 \tabularnewline
33 & -0.172062 & -1.3328 & 0.906179 \tabularnewline
34 & -0.228223 & -1.7678 & 0.958911 \tabularnewline
35 & -0.123199 & -0.9543 & 0.828119 \tabularnewline
36 & -0.001634 & -0.0127 & 0.505029 \tabularnewline
37 & -0.126459 & -0.9795 & 0.834378 \tabularnewline
38 & -0.181516 & -1.406 & 0.917562 \tabularnewline
39 & -0.142871 & -1.1067 & 0.863574 \tabularnewline
40 & -0.239789 & -1.8574 & 0.965918 \tabularnewline
41 & -0.208492 & -1.615 & 0.944218 \tabularnewline
42 & -0.099801 & -0.7731 & 0.778737 \tabularnewline
43 & -0.162158 & -1.2561 & 0.893021 \tabularnewline
44 & -0.192769 & -1.4932 & 0.929685 \tabularnewline
45 & -0.162984 & -1.2625 & 0.894167 \tabularnewline
46 & -0.161309 & -1.2495 & 0.891832 \tabularnewline
47 & -0.089768 & -0.6953 & 0.755238 \tabularnewline
\hline
\end{tabular}
%Source: https://freestatistics.org/blog/index.php?pk=4452&T=1

[TABLE]
[ROW][C]Autocorrelation Function[/C][/ROW]
[ROW][C]Time lag k[/C][C]ACF(k)[/C][C]T-STAT[/C][C]P-value[/C][/ROW]
[ROW][C]0[/C][C]1[/C][C]7.746[/C][C]0[/C][/ROW]
[ROW][C]1[/C][C]0.349572[/C][C]2.7078[/C][C]0.004406[/C][/ROW]
[ROW][C]2[/C][C]0.152249[/C][C]1.1793[/C][C]0.121464[/C][/ROW]
[ROW][C]3[/C][C]0.462404[/C][C]3.5818[/C][C]0.000342[/C][/ROW]
[ROW][C]4[/C][C]0.075802[/C][C]0.5872[/C][C]0.27965[/C][/ROW]
[ROW][C]5[/C][C]0.182658[/C][C]1.4149[/C][C]0.081139[/C][/ROW]
[ROW][C]6[/C][C]0.487536[/C][C]3.7764[/C][C]0.000184[/C][/ROW]
[ROW][C]7[/C][C]0.074519[/C][C]0.5772[/C][C]0.282974[/C][/ROW]
[ROW][C]8[/C][C]0.125015[/C][C]0.9684[/C][C]0.168376[/C][/ROW]
[ROW][C]9[/C][C]0.3404[/C][C]2.6367[/C][C]0.005321[/C][/ROW]
[ROW][C]10[/C][C]0.033235[/C][C]0.2574[/C][C]0.398861[/C][/ROW]
[ROW][C]11[/C][C]0.29272[/C][C]2.2674[/C][C]0.01349[/C][/ROW]
[ROW][C]12[/C][C]0.586027[/C][C]4.5393[/C][C]1.4e-05[/C][/ROW]
[ROW][C]13[/C][C]0.134[/C][C]1.038[/C][C]0.151728[/C][/ROW]
[ROW][C]14[/C][C]0.112964[/C][C]0.875[/C][C]0.192526[/C][/ROW]
[ROW][C]15[/C][C]0.200575[/C][C]1.5536[/C][C]0.062764[/C][/ROW]
[ROW][C]16[/C][C]-0.093721[/C][C]-0.726[/C][C]0.764657[/C][/ROW]
[ROW][C]17[/C][C]0.064269[/C][C]0.4978[/C][C]0.310213[/C][/ROW]
[ROW][C]18[/C][C]0.149322[/C][C]1.1566[/C][C]0.126001[/C][/ROW]
[ROW][C]19[/C][C]-0.117045[/C][C]-0.9066[/C][C]0.815885[/C][/ROW]
[ROW][C]20[/C][C]-0.046254[/C][C]-0.3583[/C][C]0.639304[/C][/ROW]
[ROW][C]21[/C][C]-0.01333[/C][C]-0.1033[/C][C]0.540948[/C][/ROW]
[ROW][C]22[/C][C]-0.164819[/C][C]-1.2767[/C][C]0.896683[/C][/ROW]
[ROW][C]23[/C][C]0.054582[/C][C]0.4228[/C][C]0.33698[/C][/ROW]
[ROW][C]24[/C][C]0.152716[/C][C]1.1829[/C][C]0.120751[/C][/ROW]
[ROW][C]25[/C][C]-0.046416[/C][C]-0.3595[/C][C]0.639771[/C][/ROW]
[ROW][C]26[/C][C]-0.067842[/C][C]-0.5255[/C][C]0.699414[/C][/ROW]
[ROW][C]27[/C][C]-0.12683[/C][C]-0.9824[/C][C]0.835081[/C][/ROW]
[ROW][C]28[/C][C]-0.263166[/C][C]-2.0385[/C][C]0.977042[/C][/ROW]
[ROW][C]29[/C][C]-0.170912[/C][C]-1.3239[/C][C]0.904718[/C][/ROW]
[ROW][C]30[/C][C]-0.116341[/C][C]-0.9012[/C][C]0.81445[/C][/ROW]
[ROW][C]31[/C][C]-0.210528[/C][C]-1.6307[/C][C]0.945908[/C][/ROW]
[ROW][C]32[/C][C]-0.17431[/C][C]-1.3502[/C][C]0.908989[/C][/ROW]
[ROW][C]33[/C][C]-0.172062[/C][C]-1.3328[/C][C]0.906179[/C][/ROW]
[ROW][C]34[/C][C]-0.228223[/C][C]-1.7678[/C][C]0.958911[/C][/ROW]
[ROW][C]35[/C][C]-0.123199[/C][C]-0.9543[/C][C]0.828119[/C][/ROW]
[ROW][C]36[/C][C]-0.001634[/C][C]-0.0127[/C][C]0.505029[/C][/ROW]
[ROW][C]37[/C][C]-0.126459[/C][C]-0.9795[/C][C]0.834378[/C][/ROW]
[ROW][C]38[/C][C]-0.181516[/C][C]-1.406[/C][C]0.917562[/C][/ROW]
[ROW][C]39[/C][C]-0.142871[/C][C]-1.1067[/C][C]0.863574[/C][/ROW]
[ROW][C]40[/C][C]-0.239789[/C][C]-1.8574[/C][C]0.965918[/C][/ROW]
[ROW][C]41[/C][C]-0.208492[/C][C]-1.615[/C][C]0.944218[/C][/ROW]
[ROW][C]42[/C][C]-0.099801[/C][C]-0.7731[/C][C]0.778737[/C][/ROW]
[ROW][C]43[/C][C]-0.162158[/C][C]-1.2561[/C][C]0.893021[/C][/ROW]
[ROW][C]44[/C][C]-0.192769[/C][C]-1.4932[/C][C]0.929685[/C][/ROW]
[ROW][C]45[/C][C]-0.162984[/C][C]-1.2625[/C][C]0.894167[/C][/ROW]
[ROW][C]46[/C][C]-0.161309[/C][C]-1.2495[/C][C]0.891832[/C][/ROW]
[ROW][C]47[/C][C]-0.089768[/C][C]-0.6953[/C][C]0.755238[/C][/ROW]
[/TABLE]
Source: https://freestatistics.org/blog/index.php?pk=4452&T=1

Globally Unique Identifier (entire table): ba.freestatistics.org/blog/index.php?pk=4452&T=1

As an alternative you can also use a QR Code:  

The GUIDs for individual cells are displayed in the table below:

Autocorrelation Function
Time lag kACF(k)T-STATP-value
017.7460
10.3495722.70780.004406
20.1522491.17930.121464
30.4624043.58180.000342
40.0758020.58720.27965
50.1826581.41490.081139
60.4875363.77640.000184
70.0745190.57720.282974
80.1250150.96840.168376
90.34042.63670.005321
100.0332350.25740.398861
110.292722.26740.01349
120.5860274.53931.4e-05
130.1341.0380.151728
140.1129640.8750.192526
150.2005751.55360.062764
16-0.093721-0.7260.764657
170.0642690.49780.310213
180.1493221.15660.126001
19-0.117045-0.90660.815885
20-0.046254-0.35830.639304
21-0.01333-0.10330.540948
22-0.164819-1.27670.896683
230.0545820.42280.33698
240.1527161.18290.120751
25-0.046416-0.35950.639771
26-0.067842-0.52550.699414
27-0.12683-0.98240.835081
28-0.263166-2.03850.977042
29-0.170912-1.32390.904718
30-0.116341-0.90120.81445
31-0.210528-1.63070.945908
32-0.17431-1.35020.908989
33-0.172062-1.33280.906179
34-0.228223-1.76780.958911
35-0.123199-0.95430.828119
36-0.001634-0.01270.505029
37-0.126459-0.97950.834378
38-0.181516-1.4060.917562
39-0.142871-1.10670.863574
40-0.239789-1.85740.965918
41-0.208492-1.6150.944218
42-0.099801-0.77310.778737
43-0.162158-1.25610.893021
44-0.192769-1.49320.929685
45-0.162984-1.26250.894167
46-0.161309-1.24950.891832
47-0.089768-0.69530.755238


Partial Autocorrelation Function
Time lag kPACF(k)T-STATP-value
00.3495722.70780.004406
10.0342310.26520.3959
20.4551223.52540.000408
3-0.307873-2.38480.989867
40.3862982.99230.002008
50.1200830.93020.178008
6-0.106135-0.82210.792867
70.0727640.56360.287555
80.0269440.20870.417692
90.0149740.1160.454025
100.3028482.34590.011153
110.2823642.18720.016319
12-0.123195-0.95430.82811
13-0.163565-1.2670.894968
14-0.200983-1.55680.937612
15-0.060435-0.46810.679305
16-0.155874-1.20740.883991
17-0.160931-1.24660.891299
18-0.003001-0.02320.509234
19-0.174999-1.35550.909836
20-0.060343-0.46740.679052
21-0.074778-0.57920.717697
22-0.019829-0.15360.560779
23-0.003138-0.02430.509656
240.0831480.64410.260995
25-0.06655-0.51550.695949
26-0.044536-0.3450.634339
27-0.100807-0.78080.781018
28-0.060462-0.46830.67938
290.0789490.61150.271576
300.020010.1550.438673
310.1510871.17030.123252
320.0579270.44870.327632
330.0366910.28420.388614
34-0.040849-0.31640.623607
350.1102220.85380.198311
36-0.145173-1.12450.867361
370.0284730.22060.413095
380.0581650.45050.32697
390.0381410.29540.384339
400.0234450.18160.428253
41-0.060222-0.46650.678717
420.067520.5230.301448
43-0.181936-1.40930.918041
44-0.111739-0.86550.804901
450.0492960.38180.351963
46-0.047931-0.37130.644128
47-0.039447-0.30560.619498

\begin{tabular}{lllllllll}
\hline
Partial Autocorrelation Function \tabularnewline
Time lag k & PACF(k) & T-STAT & P-value \tabularnewline
0 & 0.349572 & 2.7078 & 0.004406 \tabularnewline
1 & 0.034231 & 0.2652 & 0.3959 \tabularnewline
2 & 0.455122 & 3.5254 & 0.000408 \tabularnewline
3 & -0.307873 & -2.3848 & 0.989867 \tabularnewline
4 & 0.386298 & 2.9923 & 0.002008 \tabularnewline
5 & 0.120083 & 0.9302 & 0.178008 \tabularnewline
6 & -0.106135 & -0.8221 & 0.792867 \tabularnewline
7 & 0.072764 & 0.5636 & 0.287555 \tabularnewline
8 & 0.026944 & 0.2087 & 0.417692 \tabularnewline
9 & 0.014974 & 0.116 & 0.454025 \tabularnewline
10 & 0.302848 & 2.3459 & 0.011153 \tabularnewline
11 & 0.282364 & 2.1872 & 0.016319 \tabularnewline
12 & -0.123195 & -0.9543 & 0.82811 \tabularnewline
13 & -0.163565 & -1.267 & 0.894968 \tabularnewline
14 & -0.200983 & -1.5568 & 0.937612 \tabularnewline
15 & -0.060435 & -0.4681 & 0.679305 \tabularnewline
16 & -0.155874 & -1.2074 & 0.883991 \tabularnewline
17 & -0.160931 & -1.2466 & 0.891299 \tabularnewline
18 & -0.003001 & -0.0232 & 0.509234 \tabularnewline
19 & -0.174999 & -1.3555 & 0.909836 \tabularnewline
20 & -0.060343 & -0.4674 & 0.679052 \tabularnewline
21 & -0.074778 & -0.5792 & 0.717697 \tabularnewline
22 & -0.019829 & -0.1536 & 0.560779 \tabularnewline
23 & -0.003138 & -0.0243 & 0.509656 \tabularnewline
24 & 0.083148 & 0.6441 & 0.260995 \tabularnewline
25 & -0.06655 & -0.5155 & 0.695949 \tabularnewline
26 & -0.044536 & -0.345 & 0.634339 \tabularnewline
27 & -0.100807 & -0.7808 & 0.781018 \tabularnewline
28 & -0.060462 & -0.4683 & 0.67938 \tabularnewline
29 & 0.078949 & 0.6115 & 0.271576 \tabularnewline
30 & 0.02001 & 0.155 & 0.438673 \tabularnewline
31 & 0.151087 & 1.1703 & 0.123252 \tabularnewline
32 & 0.057927 & 0.4487 & 0.327632 \tabularnewline
33 & 0.036691 & 0.2842 & 0.388614 \tabularnewline
34 & -0.040849 & -0.3164 & 0.623607 \tabularnewline
35 & 0.110222 & 0.8538 & 0.198311 \tabularnewline
36 & -0.145173 & -1.1245 & 0.867361 \tabularnewline
37 & 0.028473 & 0.2206 & 0.413095 \tabularnewline
38 & 0.058165 & 0.4505 & 0.32697 \tabularnewline
39 & 0.038141 & 0.2954 & 0.384339 \tabularnewline
40 & 0.023445 & 0.1816 & 0.428253 \tabularnewline
41 & -0.060222 & -0.4665 & 0.678717 \tabularnewline
42 & 0.06752 & 0.523 & 0.301448 \tabularnewline
43 & -0.181936 & -1.4093 & 0.918041 \tabularnewline
44 & -0.111739 & -0.8655 & 0.804901 \tabularnewline
45 & 0.049296 & 0.3818 & 0.351963 \tabularnewline
46 & -0.047931 & -0.3713 & 0.644128 \tabularnewline
47 & -0.039447 & -0.3056 & 0.619498 \tabularnewline
\hline
\end{tabular}
%Source: https://freestatistics.org/blog/index.php?pk=4452&T=2

[TABLE]
[ROW][C]Partial Autocorrelation Function[/C][/ROW]
[ROW][C]Time lag k[/C][C]PACF(k)[/C][C]T-STAT[/C][C]P-value[/C][/ROW]
[ROW][C]0[/C][C]0.349572[/C][C]2.7078[/C][C]0.004406[/C][/ROW]
[ROW][C]1[/C][C]0.034231[/C][C]0.2652[/C][C]0.3959[/C][/ROW]
[ROW][C]2[/C][C]0.455122[/C][C]3.5254[/C][C]0.000408[/C][/ROW]
[ROW][C]3[/C][C]-0.307873[/C][C]-2.3848[/C][C]0.989867[/C][/ROW]
[ROW][C]4[/C][C]0.386298[/C][C]2.9923[/C][C]0.002008[/C][/ROW]
[ROW][C]5[/C][C]0.120083[/C][C]0.9302[/C][C]0.178008[/C][/ROW]
[ROW][C]6[/C][C]-0.106135[/C][C]-0.8221[/C][C]0.792867[/C][/ROW]
[ROW][C]7[/C][C]0.072764[/C][C]0.5636[/C][C]0.287555[/C][/ROW]
[ROW][C]8[/C][C]0.026944[/C][C]0.2087[/C][C]0.417692[/C][/ROW]
[ROW][C]9[/C][C]0.014974[/C][C]0.116[/C][C]0.454025[/C][/ROW]
[ROW][C]10[/C][C]0.302848[/C][C]2.3459[/C][C]0.011153[/C][/ROW]
[ROW][C]11[/C][C]0.282364[/C][C]2.1872[/C][C]0.016319[/C][/ROW]
[ROW][C]12[/C][C]-0.123195[/C][C]-0.9543[/C][C]0.82811[/C][/ROW]
[ROW][C]13[/C][C]-0.163565[/C][C]-1.267[/C][C]0.894968[/C][/ROW]
[ROW][C]14[/C][C]-0.200983[/C][C]-1.5568[/C][C]0.937612[/C][/ROW]
[ROW][C]15[/C][C]-0.060435[/C][C]-0.4681[/C][C]0.679305[/C][/ROW]
[ROW][C]16[/C][C]-0.155874[/C][C]-1.2074[/C][C]0.883991[/C][/ROW]
[ROW][C]17[/C][C]-0.160931[/C][C]-1.2466[/C][C]0.891299[/C][/ROW]
[ROW][C]18[/C][C]-0.003001[/C][C]-0.0232[/C][C]0.509234[/C][/ROW]
[ROW][C]19[/C][C]-0.174999[/C][C]-1.3555[/C][C]0.909836[/C][/ROW]
[ROW][C]20[/C][C]-0.060343[/C][C]-0.4674[/C][C]0.679052[/C][/ROW]
[ROW][C]21[/C][C]-0.074778[/C][C]-0.5792[/C][C]0.717697[/C][/ROW]
[ROW][C]22[/C][C]-0.019829[/C][C]-0.1536[/C][C]0.560779[/C][/ROW]
[ROW][C]23[/C][C]-0.003138[/C][C]-0.0243[/C][C]0.509656[/C][/ROW]
[ROW][C]24[/C][C]0.083148[/C][C]0.6441[/C][C]0.260995[/C][/ROW]
[ROW][C]25[/C][C]-0.06655[/C][C]-0.5155[/C][C]0.695949[/C][/ROW]
[ROW][C]26[/C][C]-0.044536[/C][C]-0.345[/C][C]0.634339[/C][/ROW]
[ROW][C]27[/C][C]-0.100807[/C][C]-0.7808[/C][C]0.781018[/C][/ROW]
[ROW][C]28[/C][C]-0.060462[/C][C]-0.4683[/C][C]0.67938[/C][/ROW]
[ROW][C]29[/C][C]0.078949[/C][C]0.6115[/C][C]0.271576[/C][/ROW]
[ROW][C]30[/C][C]0.02001[/C][C]0.155[/C][C]0.438673[/C][/ROW]
[ROW][C]31[/C][C]0.151087[/C][C]1.1703[/C][C]0.123252[/C][/ROW]
[ROW][C]32[/C][C]0.057927[/C][C]0.4487[/C][C]0.327632[/C][/ROW]
[ROW][C]33[/C][C]0.036691[/C][C]0.2842[/C][C]0.388614[/C][/ROW]
[ROW][C]34[/C][C]-0.040849[/C][C]-0.3164[/C][C]0.623607[/C][/ROW]
[ROW][C]35[/C][C]0.110222[/C][C]0.8538[/C][C]0.198311[/C][/ROW]
[ROW][C]36[/C][C]-0.145173[/C][C]-1.1245[/C][C]0.867361[/C][/ROW]
[ROW][C]37[/C][C]0.028473[/C][C]0.2206[/C][C]0.413095[/C][/ROW]
[ROW][C]38[/C][C]0.058165[/C][C]0.4505[/C][C]0.32697[/C][/ROW]
[ROW][C]39[/C][C]0.038141[/C][C]0.2954[/C][C]0.384339[/C][/ROW]
[ROW][C]40[/C][C]0.023445[/C][C]0.1816[/C][C]0.428253[/C][/ROW]
[ROW][C]41[/C][C]-0.060222[/C][C]-0.4665[/C][C]0.678717[/C][/ROW]
[ROW][C]42[/C][C]0.06752[/C][C]0.523[/C][C]0.301448[/C][/ROW]
[ROW][C]43[/C][C]-0.181936[/C][C]-1.4093[/C][C]0.918041[/C][/ROW]
[ROW][C]44[/C][C]-0.111739[/C][C]-0.8655[/C][C]0.804901[/C][/ROW]
[ROW][C]45[/C][C]0.049296[/C][C]0.3818[/C][C]0.351963[/C][/ROW]
[ROW][C]46[/C][C]-0.047931[/C][C]-0.3713[/C][C]0.644128[/C][/ROW]
[ROW][C]47[/C][C]-0.039447[/C][C]-0.3056[/C][C]0.619498[/C][/ROW]
[/TABLE]
Source: https://freestatistics.org/blog/index.php?pk=4452&T=2

Globally Unique Identifier (entire table): ba.freestatistics.org/blog/index.php?pk=4452&T=2

As an alternative you can also use a QR Code:  

The GUIDs for individual cells are displayed in the table below:

Partial Autocorrelation Function
Time lag kPACF(k)T-STATP-value
00.3495722.70780.004406
10.0342310.26520.3959
20.4551223.52540.000408
3-0.307873-2.38480.989867
40.3862982.99230.002008
50.1200830.93020.178008
6-0.106135-0.82210.792867
70.0727640.56360.287555
80.0269440.20870.417692
90.0149740.1160.454025
100.3028482.34590.011153
110.2823642.18720.016319
12-0.123195-0.95430.82811
13-0.163565-1.2670.894968
14-0.200983-1.55680.937612
15-0.060435-0.46810.679305
16-0.155874-1.20740.883991
17-0.160931-1.24660.891299
18-0.003001-0.02320.509234
19-0.174999-1.35550.909836
20-0.060343-0.46740.679052
21-0.074778-0.57920.717697
22-0.019829-0.15360.560779
23-0.003138-0.02430.509656
240.0831480.64410.260995
25-0.06655-0.51550.695949
26-0.044536-0.3450.634339
27-0.100807-0.78080.781018
28-0.060462-0.46830.67938
290.0789490.61150.271576
300.020010.1550.438673
310.1510871.17030.123252
320.0579270.44870.327632
330.0366910.28420.388614
34-0.040849-0.31640.623607
350.1102220.85380.198311
36-0.145173-1.12450.867361
370.0284730.22060.413095
380.0581650.45050.32697
390.0381410.29540.384339
400.0234450.18160.428253
41-0.060222-0.46650.678717
420.067520.5230.301448
43-0.181936-1.40930.918041
44-0.111739-0.86550.804901
450.0492960.38180.351963
46-0.047931-0.37130.644128
47-0.039447-0.30560.619498


Parameters (Session):
par1 = 48 ; par2 = 1 ; par3 = 0 ; par4 = 0 ; par5 = 12 ;
Parameters (R input):
par1 = 48 ; par2 = 1 ; par3 = 0 ; par4 = 0 ; par5 = 12 ;
R code (references can be found in the software module):
if (par1 == 'Default') {
par1 = 10*log10(length(x))
} else {
par1 <- as.numeric(par1)
}
par2 <- as.numeric(par2)
par3 <- as.numeric(par3)
par4 <- as.numeric(par4)
par5 <- as.numeric(par5)
if (par2 == 0) {
x <- log(x)
} else {
x <- (x ^ par2 - 1) / par2
}
if (par3 > 0) x <- diff(x,lag=1,difference=par3)
if (par4 > 0) x <- diff(x,lag=par5,difference=par4)
bitmap(file='pic1.png')
racf <- acf(x,par1,main='Autocorrelation',xlab='lags',ylab='ACF')
dev.off()
bitmap(file='pic2.png')
rpacf <- pacf(x,par1,main='Partial Autocorrelation',xlab='lags',ylab='PACF')
dev.off()
(myacf <- c(racf$acf))
(mypacf <- c(rpacf$acf))
lengthx <- length(x)
sqrtn <- sqrt(lengthx)
load(file='createtable')
a<-table.start()
a<-table.row.start(a)
a<-table.element(a,'Autocorrelation Function',4,TRUE)
a<-table.row.end(a)
a<-table.row.start(a)
a<-table.element(a,'Time lag k',header=TRUE)
a<-table.element(a,hyperlink('basics.htm','ACF(k)','click here for more information about the Autocorrelation Function'),header=TRUE)
a<-table.element(a,'T-STAT',header=TRUE)
a<-table.element(a,'P-value',header=TRUE)
a<-table.row.end(a)
for (i in 1:par1) {
a<-table.row.start(a)
a<-table.element(a,i-1,header=TRUE)
a<-table.element(a,round(myacf[i],6))
mytstat <- myacf[i]*sqrtn
a<-table.element(a,round(mytstat,4))
a<-table.element(a,round(1-pt(mytstat,lengthx),6))
a<-table.row.end(a)
}
a<-table.end(a)
table.save(a,file='mytable.tab')
a<-table.start()
a<-table.row.start(a)
a<-table.element(a,'Partial Autocorrelation Function',4,TRUE)
a<-table.row.end(a)
a<-table.row.start(a)
a<-table.element(a,'Time lag k',header=TRUE)
a<-table.element(a,hyperlink('basics.htm','PACF(k)','click here for more information about the Partial Autocorrelation Function'),header=TRUE)
a<-table.element(a,'T-STAT',header=TRUE)
a<-table.element(a,'P-value',header=TRUE)
a<-table.row.end(a)
for (i in 1:par1) {
a<-table.row.start(a)
a<-table.element(a,i-1,header=TRUE)
a<-table.element(a,round(mypacf[i],6))
mytstat <- mypacf[i]*sqrtn
a<-table.element(a,round(mytstat,4))
a<-table.element(a,round(1-pt(mytstat,lengthx),6))
a<-table.row.end(a)
}
a<-table.end(a)
table.save(a,file='mytable1.tab')