Free Statistics

of Irreproducible Research!

Author's title

Author*Unverified author*
R Software Modulerwasp_smp.wasp
Title produced by softwareStandard Deviation-Mean Plot
Date of computationMon, 17 Dec 2007 09:54:05 -0700
Cite this page as followsStatistical Computations at FreeStatistics.org, Office for Research Development and Education, URL https://freestatistics.org/blog/index.php?v=date/2007/Dec/17/t1197909438ura1eblbkev8e4h.htm/, Retrieved Sat, 04 May 2024 03:23:13 +0000
Statistical Computations at FreeStatistics.org, Office for Research Development and Education, URL https://freestatistics.org/blog/index.php?pk=4395, Retrieved Sat, 04 May 2024 03:23:13 +0000
QR Codes:

Original text written by user:
IsPrivate?No (this computation is public)
User-defined keywords
Estimated Impact175
Family? (F = Feedback message, R = changed R code, M = changed R Module, P = changed Parameters, D = changed Data)
-       [Standard Deviation-Mean Plot] [standaard deviati...] [2007-12-17 16:54:05] [d02236afd58a58d13a748bbf41a37c2e] [Current]
Feedback Forum

Post a new message
Dataseries X:
575
591
603
653
593
674
687
525
621
654
469
561
514
569
654
598
555
598
624
592
580
616
548
543
492
513
546
638
582
655
539
560
577
513
514
471
542
522
638
543
531
600
554
528
551
511
494
384
482
463
565
521
549
610
558
489
359
551
459
490


Summary of compuational transaction
Raw Inputview raw input (R code)
Raw Outputview raw output of R engine
Computing time1 seconds
R Server'Gwilym Jenkins' @ 72.249.127.135

\begin{tabular}{lllllllll}
\hline
Summary of compuational transaction \tabularnewline
Raw Input & view raw input (R code)  \tabularnewline
Raw Output & view raw output of R engine  \tabularnewline
Computing time & 1 seconds \tabularnewline
R Server & 'Gwilym Jenkins' @ 72.249.127.135 \tabularnewline
\hline
\end{tabular}
%Source: https://freestatistics.org/blog/index.php?pk=4395&T=0

[TABLE]
[ROW][C]Summary of compuational transaction[/C][/ROW]
[ROW][C]Raw Input[/C][C]view raw input (R code) [/C][/ROW]
[ROW][C]Raw Output[/C][C]view raw output of R engine [/C][/ROW]
[ROW][C]Computing time[/C][C]1 seconds[/C][/ROW]
[ROW][C]R Server[/C][C]'Gwilym Jenkins' @ 72.249.127.135[/C][/ROW]
[/TABLE]
Source: https://freestatistics.org/blog/index.php?pk=4395&T=0

Globally Unique Identifier (entire table): ba.freestatistics.org/blog/index.php?pk=4395&T=0

As an alternative you can also use a QR Code:  

The GUIDs for individual cells are displayed in the table below:

Summary of compuational transaction
Raw Inputview raw input (R code)
Raw Outputview raw output of R engine
Computing time1 seconds
R Server'Gwilym Jenkins' @ 72.249.127.135


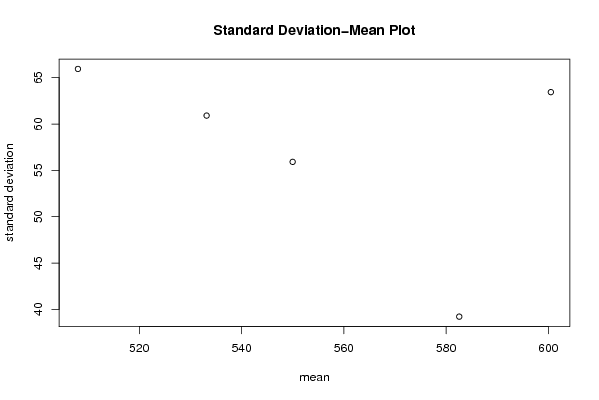
Standard Deviation-Mean Plot
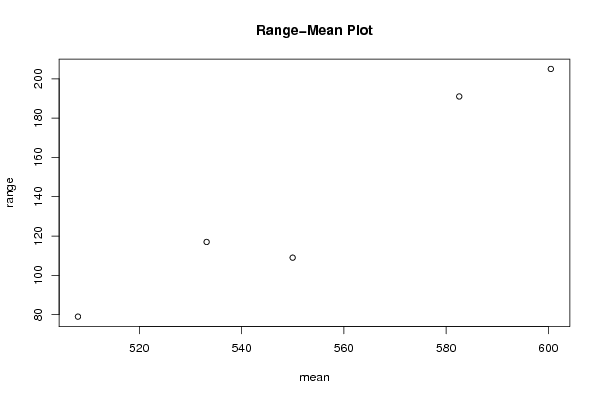
SectionMeanStandard DeviationRange
1600.563.4457534935447205
2582.58333333333339.2137692267614191
355055.9203979697115109
4533.16666666666760.9139979931965117
550865.947637630857679

\begin{tabular}{lllllllll}
\hline
Standard Deviation-Mean Plot \tabularnewline
Section & Mean & Standard Deviation & Range \tabularnewline
1 & 600.5 & 63.4457534935447 & 205 \tabularnewline
2 & 582.583333333333 & 39.2137692267614 & 191 \tabularnewline
3 & 550 & 55.9203979697115 & 109 \tabularnewline
4 & 533.166666666667 & 60.9139979931965 & 117 \tabularnewline
5 & 508 & 65.9476376308576 & 79 \tabularnewline
\hline
\end{tabular}
%Source: https://freestatistics.org/blog/index.php?pk=4395&T=1

[TABLE]
[ROW][C]Standard Deviation-Mean Plot[/C][/ROW]
[ROW][C]Section[/C][C]Mean[/C][C]Standard Deviation[/C][C]Range[/C][/ROW]
[ROW][C]1[/C][C]600.5[/C][C]63.4457534935447[/C][C]205[/C][/ROW]
[ROW][C]2[/C][C]582.583333333333[/C][C]39.2137692267614[/C][C]191[/C][/ROW]
[ROW][C]3[/C][C]550[/C][C]55.9203979697115[/C][C]109[/C][/ROW]
[ROW][C]4[/C][C]533.166666666667[/C][C]60.9139979931965[/C][C]117[/C][/ROW]
[ROW][C]5[/C][C]508[/C][C]65.9476376308576[/C][C]79[/C][/ROW]
[/TABLE]
Source: https://freestatistics.org/blog/index.php?pk=4395&T=1

Globally Unique Identifier (entire table): ba.freestatistics.org/blog/index.php?pk=4395&T=1

As an alternative you can also use a QR Code:  

The GUIDs for individual cells are displayed in the table below:

Standard Deviation-Mean Plot
SectionMeanStandard DeviationRange
1600.563.4457534935447205
2582.58333333333339.2137692267614191
355055.9203979697115109
4533.16666666666760.9139979931965117
550865.947637630857679


Regression: S.E.(k) = alpha + beta * Mean(k)
alpha126.959501762543
beta-0.125928071550381
S.D.0.148480899801425
T-STAT-0.848109566407494
p-value0.45868351200184

\begin{tabular}{lllllllll}
\hline
Regression: S.E.(k) = alpha + beta * Mean(k) \tabularnewline
alpha & 126.959501762543 \tabularnewline
beta & -0.125928071550381 \tabularnewline
S.D. & 0.148480899801425 \tabularnewline
T-STAT & -0.848109566407494 \tabularnewline
p-value & 0.45868351200184 \tabularnewline
\hline
\end{tabular}
%Source: https://freestatistics.org/blog/index.php?pk=4395&T=2

[TABLE]
[ROW][C]Regression: S.E.(k) = alpha + beta * Mean(k)[/C][/ROW]
[ROW][C]alpha[/C][C]126.959501762543[/C][/ROW]
[ROW][C]beta[/C][C]-0.125928071550381[/C][/ROW]
[ROW][C]S.D.[/C][C]0.148480899801425[/C][/ROW]
[ROW][C]T-STAT[/C][C]-0.848109566407494[/C][/ROW]
[ROW][C]p-value[/C][C]0.45868351200184[/C][/ROW]
[/TABLE]
Source: https://freestatistics.org/blog/index.php?pk=4395&T=2

Globally Unique Identifier (entire table): ba.freestatistics.org/blog/index.php?pk=4395&T=2

As an alternative you can also use a QR Code:  

The GUIDs for individual cells are displayed in the table below:

Regression: S.E.(k) = alpha + beta * Mean(k)
alpha126.959501762543
beta-0.125928071550381
S.D.0.148480899801425
T-STAT-0.848109566407494
p-value0.45868351200184


Regression: ln S.E.(k) = alpha + beta * ln Mean(k)
alpha12.8581548026165
beta-1.39781700900822
S.D.1.61326190057272
T-STAT-0.86645386499984
p-value0.449983318640933
Lambda2.39781700900822

\begin{tabular}{lllllllll}
\hline
Regression: ln S.E.(k) = alpha + beta * ln Mean(k) \tabularnewline
alpha & 12.8581548026165 \tabularnewline
beta & -1.39781700900822 \tabularnewline
S.D. & 1.61326190057272 \tabularnewline
T-STAT & -0.86645386499984 \tabularnewline
p-value & 0.449983318640933 \tabularnewline
Lambda & 2.39781700900822 \tabularnewline
\hline
\end{tabular}
%Source: https://freestatistics.org/blog/index.php?pk=4395&T=3

[TABLE]
[ROW][C]Regression: ln S.E.(k) = alpha + beta * ln Mean(k)[/C][/ROW]
[ROW][C]alpha[/C][C]12.8581548026165[/C][/ROW]
[ROW][C]beta[/C][C]-1.39781700900822[/C][/ROW]
[ROW][C]S.D.[/C][C]1.61326190057272[/C][/ROW]
[ROW][C]T-STAT[/C][C]-0.86645386499984[/C][/ROW]
[ROW][C]p-value[/C][C]0.449983318640933[/C][/ROW]
[ROW][C]Lambda[/C][C]2.39781700900822[/C][/ROW]
[/TABLE]
Source: https://freestatistics.org/blog/index.php?pk=4395&T=3

Globally Unique Identifier (entire table): ba.freestatistics.org/blog/index.php?pk=4395&T=3

As an alternative you can also use a QR Code:  

The GUIDs for individual cells are displayed in the table below:

Regression: ln S.E.(k) = alpha + beta * ln Mean(k)
alpha12.8581548026165
beta-1.39781700900822
S.D.1.61326190057272
T-STAT-0.86645386499984
p-value0.449983318640933
Lambda2.39781700900822


Parameters (Session):
Parameters (R input):
par1 = 12 ;
R code (references can be found in the software module):
par1 <- as.numeric(par1)
(n <- length(x))
(np <- floor(n / par1))
arr <- array(NA,dim=c(par1,np))
j <- 0
k <- 1
for (i in 1:(np*par1))
{
j = j + 1
arr[j,k] <- x[i]
if (j == par1) {
j = 0
k=k+1
}
}
arr
arr.mean <- array(NA,dim=np)
arr.sd <- array(NA,dim=np)
arr.range <- array(NA,dim=np)
for (j in 1:np)
{
arr.mean[j] <- mean(arr[,j],na.rm=TRUE)
arr.sd[j] <- sd(arr[,j],na.rm=TRUE)
arr.range[j] <- max(arr[,j],na.rm=TRUE) - min(arr[j,],na.rm=TRUE)
}
arr.mean
arr.sd
arr.range
(lm1 <- lm(arr.sd~arr.mean))
(lnlm1 <- lm(log(arr.sd)~log(arr.mean)))
(lm2 <- lm(arr.range~arr.mean))
bitmap(file='test1.png')
plot(arr.mean,arr.sd,main='Standard Deviation-Mean Plot',xlab='mean',ylab='standard deviation')
dev.off()
bitmap(file='test2.png')
plot(arr.mean,arr.range,main='Range-Mean Plot',xlab='mean',ylab='range')
dev.off()
load(file='createtable')
a<-table.start()
a<-table.row.start(a)
a<-table.element(a,'Standard Deviation-Mean Plot',4,TRUE)
a<-table.row.end(a)
a<-table.row.start(a)
a<-table.element(a,'Section',header=TRUE)
a<-table.element(a,'Mean',header=TRUE)
a<-table.element(a,'Standard Deviation',header=TRUE)
a<-table.element(a,'Range',header=TRUE)
a<-table.row.end(a)
for (j in 1:np) {
a<-table.row.start(a)
a<-table.element(a,j,header=TRUE)
a<-table.element(a,arr.mean[j])
a<-table.element(a,arr.sd[j] )
a<-table.element(a,arr.range[j] )
a<-table.row.end(a)
}
a<-table.end(a)
table.save(a,file='mytable.tab')
a<-table.start()
a<-table.row.start(a)
a<-table.element(a,'Regression: S.E.(k) = alpha + beta * Mean(k)',2,TRUE)
a<-table.row.end(a)
a<-table.row.start(a)
a<-table.element(a,'alpha',header=TRUE)
a<-table.element(a,lm1$coefficients[[1]])
a<-table.row.end(a)
a<-table.row.start(a)
a<-table.element(a,'beta',header=TRUE)
a<-table.element(a,lm1$coefficients[[2]])
a<-table.row.end(a)
a<-table.row.start(a)
a<-table.element(a,'S.D.',header=TRUE)
a<-table.element(a,summary(lm1)$coefficients[2,2])
a<-table.row.end(a)
a<-table.row.start(a)
a<-table.element(a,'T-STAT',header=TRUE)
a<-table.element(a,summary(lm1)$coefficients[2,3])
a<-table.row.end(a)
a<-table.row.start(a)
a<-table.element(a,'p-value',header=TRUE)
a<-table.element(a,summary(lm1)$coefficients[2,4])
a<-table.row.end(a)
a<-table.end(a)
table.save(a,file='mytable1.tab')
a<-table.start()
a<-table.row.start(a)
a<-table.element(a,'Regression: ln S.E.(k) = alpha + beta * ln Mean(k)',2,TRUE)
a<-table.row.end(a)
a<-table.row.start(a)
a<-table.element(a,'alpha',header=TRUE)
a<-table.element(a,lnlm1$coefficients[[1]])
a<-table.row.end(a)
a<-table.row.start(a)
a<-table.element(a,'beta',header=TRUE)
a<-table.element(a,lnlm1$coefficients[[2]])
a<-table.row.end(a)
a<-table.row.start(a)
a<-table.element(a,'S.D.',header=TRUE)
a<-table.element(a,summary(lnlm1)$coefficients[2,2])
a<-table.row.end(a)
a<-table.row.start(a)
a<-table.element(a,'T-STAT',header=TRUE)
a<-table.element(a,summary(lnlm1)$coefficients[2,3])
a<-table.row.end(a)
a<-table.row.start(a)
a<-table.element(a,'p-value',header=TRUE)
a<-table.element(a,summary(lnlm1)$coefficients[2,4])
a<-table.row.end(a)
a<-table.row.start(a)
a<-table.element(a,'Lambda',header=TRUE)
a<-table.element(a,1-lnlm1$coefficients[[2]])
a<-table.row.end(a)
a<-table.end(a)
table.save(a,file='mytable2.tab')