Free Statistics

of Irreproducible Research!

Author's title

Author*Unverified author*
R Software Modulerwasp_arimabackwardselection.wasp
Title produced by softwareARIMA Backward Selection
Date of computationMon, 17 Dec 2007 04:53:15 -0700
Cite this page as followsStatistical Computations at FreeStatistics.org, Office for Research Development and Education, URL https://freestatistics.org/blog/index.php?v=date/2007/Dec/17/t1197891378rbgzm60xwr57w17.htm/, Retrieved Fri, 03 May 2024 16:33:31 +0000
Statistical Computations at FreeStatistics.org, Office for Research Development and Education, URL https://freestatistics.org/blog/index.php?pk=4360, Retrieved Fri, 03 May 2024 16:33:31 +0000
QR Codes:

Original text written by user:
IsPrivate?No (this computation is public)
User-defined keywords
Estimated Impact162
Family? (F = Feedback message, R = changed R code, M = changed R Module, P = changed Parameters, D = changed Data)
-       [ARIMA Backward Selection] [] [2007-12-17 11:53:15] [6552dbdb87730106b738e8affc0d90fa] [Current]
Feedback Forum

Post a new message
Dataseries X:
41086
39690
43129
37863
35953
29133
24693
22205
21725
27192
21790
13253
37702
30364
32609
30212
29965
28352
25814
22414
20506
28806
22228
13971
36845
35338
35022
34777
26887
23970
22780
17351
21382
24561
17409
11514
31514
27071
29462
26105
22397
23843
21705
18089
20764
25316
17704
15548
28029
29383
36438
32034
22679
24319
18004
17537
20366
22782
19169
13807
29743
25591
29096
26482
22405
27044
17970
18730
19684
19785
18479
10698


Summary of compuational transaction
Raw Inputview raw input (R code)
Raw Outputview raw output of R engine
Computing time2 seconds
R Server'Gwilym Jenkins' @ 72.249.127.135

\begin{tabular}{lllllllll}
\hline
Summary of compuational transaction \tabularnewline
Raw Input & view raw input (R code)  \tabularnewline
Raw Output & view raw output of R engine  \tabularnewline
Computing time & 2 seconds \tabularnewline
R Server & 'Gwilym Jenkins' @ 72.249.127.135 \tabularnewline
\hline
\end{tabular}
%Source: https://freestatistics.org/blog/index.php?pk=4360&T=0

[TABLE]
[ROW][C]Summary of compuational transaction[/C][/ROW]
[ROW][C]Raw Input[/C][C]view raw input (R code) [/C][/ROW]
[ROW][C]Raw Output[/C][C]view raw output of R engine [/C][/ROW]
[ROW][C]Computing time[/C][C]2 seconds[/C][/ROW]
[ROW][C]R Server[/C][C]'Gwilym Jenkins' @ 72.249.127.135[/C][/ROW]
[/TABLE]
Source: https://freestatistics.org/blog/index.php?pk=4360&T=0

Globally Unique Identifier (entire table): ba.freestatistics.org/blog/index.php?pk=4360&T=0

As an alternative you can also use a QR Code:  

The GUIDs for individual cells are displayed in the table below:

Summary of compuational transaction
Raw Inputview raw input (R code)
Raw Outputview raw output of R engine
Computing time2 seconds
R Server'Gwilym Jenkins' @ 72.249.127.135


ARIMA Parameter Estimation and Backward Selection
Iterationar1ar2ar3ma1sma1
Estimates ( 1 )0.06710.62460.2660.61540.6034
(p-val)(0.9262 )(0.2865 )(0.1104 )(0.415 )(0 )
Estimates ( 2 )00.67810.27750.68290.6054
(p-val)(NA )(0 )(0.0112 )(0 )(0 )
Estimates ( 3 )NANANANANA
(p-val)(NA )(NA )(NA )(NA )(NA )
Estimates ( 4 )NANANANANA
(p-val)(NA )(NA )(NA )(NA )(NA )
Estimates ( 5 )NANANANANA
(p-val)(NA )(NA )(NA )(NA )(NA )
Estimates ( 6 )NANANANANA
(p-val)(NA )(NA )(NA )(NA )(NA )
Estimates ( 7 )NANANANANA
(p-val)(NA )(NA )(NA )(NA )(NA )
Estimates ( 8 )NANANANANA
(p-val)(NA )(NA )(NA )(NA )(NA )
Estimates ( 9 )NANANANANA
(p-val)(NA )(NA )(NA )(NA )(NA )

\begin{tabular}{lllllllll}
\hline
ARIMA Parameter Estimation and Backward Selection \tabularnewline
Iteration & ar1 & ar2 & ar3 & ma1 & sma1 \tabularnewline
Estimates ( 1 ) & 0.0671 & 0.6246 & 0.266 & 0.6154 & 0.6034 \tabularnewline
(p-val) & (0.9262 ) & (0.2865 ) & (0.1104 ) & (0.415 ) & (0 ) \tabularnewline
Estimates ( 2 ) & 0 & 0.6781 & 0.2775 & 0.6829 & 0.6054 \tabularnewline
(p-val) & (NA ) & (0 ) & (0.0112 ) & (0 ) & (0 ) \tabularnewline
Estimates ( 3 ) & NA & NA & NA & NA & NA \tabularnewline
(p-val) & (NA ) & (NA ) & (NA ) & (NA ) & (NA ) \tabularnewline
Estimates ( 4 ) & NA & NA & NA & NA & NA \tabularnewline
(p-val) & (NA ) & (NA ) & (NA ) & (NA ) & (NA ) \tabularnewline
Estimates ( 5 ) & NA & NA & NA & NA & NA \tabularnewline
(p-val) & (NA ) & (NA ) & (NA ) & (NA ) & (NA ) \tabularnewline
Estimates ( 6 ) & NA & NA & NA & NA & NA \tabularnewline
(p-val) & (NA ) & (NA ) & (NA ) & (NA ) & (NA ) \tabularnewline
Estimates ( 7 ) & NA & NA & NA & NA & NA \tabularnewline
(p-val) & (NA ) & (NA ) & (NA ) & (NA ) & (NA ) \tabularnewline
Estimates ( 8 ) & NA & NA & NA & NA & NA \tabularnewline
(p-val) & (NA ) & (NA ) & (NA ) & (NA ) & (NA ) \tabularnewline
Estimates ( 9 ) & NA & NA & NA & NA & NA \tabularnewline
(p-val) & (NA ) & (NA ) & (NA ) & (NA ) & (NA ) \tabularnewline
\hline
\end{tabular}
%Source: https://freestatistics.org/blog/index.php?pk=4360&T=1

[TABLE]
[ROW][C]ARIMA Parameter Estimation and Backward Selection[/C][/ROW]
[ROW][C]Iteration[/C][C]ar1[/C][C]ar2[/C][C]ar3[/C][C]ma1[/C][C]sma1[/C][/ROW]
[ROW][C]Estimates ( 1 )[/C][C]0.0671[/C][C]0.6246[/C][C]0.266[/C][C]0.6154[/C][C]0.6034[/C][/ROW]
[ROW][C](p-val)[/C][C](0.9262 )[/C][C](0.2865 )[/C][C](0.1104 )[/C][C](0.415 )[/C][C](0 )[/C][/ROW]
[ROW][C]Estimates ( 2 )[/C][C]0[/C][C]0.6781[/C][C]0.2775[/C][C]0.6829[/C][C]0.6054[/C][/ROW]
[ROW][C](p-val)[/C][C](NA )[/C][C](0 )[/C][C](0.0112 )[/C][C](0 )[/C][C](0 )[/C][/ROW]
[ROW][C]Estimates ( 3 )[/C][C]NA[/C][C]NA[/C][C]NA[/C][C]NA[/C][C]NA[/C][/ROW]
[ROW][C](p-val)[/C][C](NA )[/C][C](NA )[/C][C](NA )[/C][C](NA )[/C][C](NA )[/C][/ROW]
[ROW][C]Estimates ( 4 )[/C][C]NA[/C][C]NA[/C][C]NA[/C][C]NA[/C][C]NA[/C][/ROW]
[ROW][C](p-val)[/C][C](NA )[/C][C](NA )[/C][C](NA )[/C][C](NA )[/C][C](NA )[/C][/ROW]
[ROW][C]Estimates ( 5 )[/C][C]NA[/C][C]NA[/C][C]NA[/C][C]NA[/C][C]NA[/C][/ROW]
[ROW][C](p-val)[/C][C](NA )[/C][C](NA )[/C][C](NA )[/C][C](NA )[/C][C](NA )[/C][/ROW]
[ROW][C]Estimates ( 6 )[/C][C]NA[/C][C]NA[/C][C]NA[/C][C]NA[/C][C]NA[/C][/ROW]
[ROW][C](p-val)[/C][C](NA )[/C][C](NA )[/C][C](NA )[/C][C](NA )[/C][C](NA )[/C][/ROW]
[ROW][C]Estimates ( 7 )[/C][C]NA[/C][C]NA[/C][C]NA[/C][C]NA[/C][C]NA[/C][/ROW]
[ROW][C](p-val)[/C][C](NA )[/C][C](NA )[/C][C](NA )[/C][C](NA )[/C][C](NA )[/C][/ROW]
[ROW][C]Estimates ( 8 )[/C][C]NA[/C][C]NA[/C][C]NA[/C][C]NA[/C][C]NA[/C][/ROW]
[ROW][C](p-val)[/C][C](NA )[/C][C](NA )[/C][C](NA )[/C][C](NA )[/C][C](NA )[/C][/ROW]
[ROW][C]Estimates ( 9 )[/C][C]NA[/C][C]NA[/C][C]NA[/C][C]NA[/C][C]NA[/C][/ROW]
[ROW][C](p-val)[/C][C](NA )[/C][C](NA )[/C][C](NA )[/C][C](NA )[/C][C](NA )[/C][/ROW]
[/TABLE]
Source: https://freestatistics.org/blog/index.php?pk=4360&T=1

Globally Unique Identifier (entire table): ba.freestatistics.org/blog/index.php?pk=4360&T=1

As an alternative you can also use a QR Code:  

The GUIDs for individual cells are displayed in the table below:

ARIMA Parameter Estimation and Backward Selection
Iterationar1ar2ar3ma1sma1
Estimates ( 1 )0.06710.62460.2660.61540.6034
(p-val)(0.9262 )(0.2865 )(0.1104 )(0.415 )(0 )
Estimates ( 2 )00.67810.27750.68290.6054
(p-val)(NA )(0 )(0.0112 )(0 )(0 )
Estimates ( 3 )NANANANANA
(p-val)(NA )(NA )(NA )(NA )(NA )
Estimates ( 4 )NANANANANA
(p-val)(NA )(NA )(NA )(NA )(NA )
Estimates ( 5 )NANANANANA
(p-val)(NA )(NA )(NA )(NA )(NA )
Estimates ( 6 )NANANANANA
(p-val)(NA )(NA )(NA )(NA )(NA )
Estimates ( 7 )NANANANANA
(p-val)(NA )(NA )(NA )(NA )(NA )
Estimates ( 8 )NANANANANA
(p-val)(NA )(NA )(NA )(NA )(NA )
Estimates ( 9 )NANANANANA
(p-val)(NA )(NA )(NA )(NA )(NA )


Estimated ARIMA Residuals
Value
7103.78250843282
-375.767467656900
3137.67508858975
-3172.73691945459
-2196.84551043602
-6521.1149290969
-5088.90879103967
-3825.61905151615
-921.121346460611
4222.86318222971
-2917.98685061096
-8523.76429492803
18135.7448225945
-506.373313044225
1136.25770365324
-1001.51714070690
2169.09952117885
1383.42448885279
901.005554864605
-1947.35266424985
-1673.26588746986
5416.37180603755
-1758.63669934839
-4328.24608454709
9930.42739222411
5996.83386552182
1474.84797532562
-203.719424532394
-7385.35708373907
-5744.77496558197
-2272.30463476592
-4031.51974107734
3705.51348267378
1348.43508831468
-3922.27713513198
-5055.52905143796
12151.5233596317
-1571.10464438759
2726.54051757193
-3251.01740573421
1505.10312501545
3355.70419823421
538.043337407411
-1323.50847255090
-258.442204996739
4820.44068246018
-2907.39542887716
-739.224002095901
4246.87420323186
6920.10094518997
7472.22451085658
113.511096909397
-9801.89392329293
-3425.51596881118
-5755.83284241603
-749.979529471005
2572.22393747018
1284.56003984352
-574.895345105302
-5248.70055462156
11727.5022893812
-3095.13209113457
-38.5868126136648
-2180.7714911044
2846.69252572868
5196.21698403126
-3347.59531956846
-682.915467724065
-842.72429246952
774.4191584025
-733.639441548127
-4308.48688528394

\begin{tabular}{lllllllll}
\hline
Estimated ARIMA Residuals \tabularnewline
Value \tabularnewline
 \tabularnewline
7103.78250843282 \tabularnewline
-375.767467656900 \tabularnewline
3137.67508858975 \tabularnewline
-3172.73691945459 \tabularnewline
-2196.84551043602 \tabularnewline
-6521.1149290969 \tabularnewline
-5088.90879103967 \tabularnewline
-3825.61905151615 \tabularnewline
-921.121346460611 \tabularnewline
4222.86318222971 \tabularnewline
-2917.98685061096 \tabularnewline
-8523.76429492803 \tabularnewline
18135.7448225945 \tabularnewline
-506.373313044225 \tabularnewline
1136.25770365324 \tabularnewline
-1001.51714070690 \tabularnewline
2169.09952117885 \tabularnewline
1383.42448885279 \tabularnewline
901.005554864605 \tabularnewline
-1947.35266424985 \tabularnewline
-1673.26588746986 \tabularnewline
5416.37180603755 \tabularnewline
-1758.63669934839 \tabularnewline
-4328.24608454709 \tabularnewline
9930.42739222411 \tabularnewline
5996.83386552182 \tabularnewline
1474.84797532562 \tabularnewline
-203.719424532394 \tabularnewline
-7385.35708373907 \tabularnewline
-5744.77496558197 \tabularnewline
-2272.30463476592 \tabularnewline
-4031.51974107734 \tabularnewline
3705.51348267378 \tabularnewline
1348.43508831468 \tabularnewline
-3922.27713513198 \tabularnewline
-5055.52905143796 \tabularnewline
12151.5233596317 \tabularnewline
-1571.10464438759 \tabularnewline
2726.54051757193 \tabularnewline
-3251.01740573421 \tabularnewline
1505.10312501545 \tabularnewline
3355.70419823421 \tabularnewline
538.043337407411 \tabularnewline
-1323.50847255090 \tabularnewline
-258.442204996739 \tabularnewline
4820.44068246018 \tabularnewline
-2907.39542887716 \tabularnewline
-739.224002095901 \tabularnewline
4246.87420323186 \tabularnewline
6920.10094518997 \tabularnewline
7472.22451085658 \tabularnewline
113.511096909397 \tabularnewline
-9801.89392329293 \tabularnewline
-3425.51596881118 \tabularnewline
-5755.83284241603 \tabularnewline
-749.979529471005 \tabularnewline
2572.22393747018 \tabularnewline
1284.56003984352 \tabularnewline
-574.895345105302 \tabularnewline
-5248.70055462156 \tabularnewline
11727.5022893812 \tabularnewline
-3095.13209113457 \tabularnewline
-38.5868126136648 \tabularnewline
-2180.7714911044 \tabularnewline
2846.69252572868 \tabularnewline
5196.21698403126 \tabularnewline
-3347.59531956846 \tabularnewline
-682.915467724065 \tabularnewline
-842.72429246952 \tabularnewline
774.4191584025 \tabularnewline
-733.639441548127 \tabularnewline
-4308.48688528394 \tabularnewline
\hline
\end{tabular}
%Source: https://freestatistics.org/blog/index.php?pk=4360&T=2

[TABLE]
[ROW][C]Estimated ARIMA Residuals[/C][/ROW]
[ROW][C]Value[/C][/ROW]
[ROW][C][/C][/ROW]
[ROW][C]7103.78250843282[/C][/ROW]
[ROW][C]-375.767467656900[/C][/ROW]
[ROW][C]3137.67508858975[/C][/ROW]
[ROW][C]-3172.73691945459[/C][/ROW]
[ROW][C]-2196.84551043602[/C][/ROW]
[ROW][C]-6521.1149290969[/C][/ROW]
[ROW][C]-5088.90879103967[/C][/ROW]
[ROW][C]-3825.61905151615[/C][/ROW]
[ROW][C]-921.121346460611[/C][/ROW]
[ROW][C]4222.86318222971[/C][/ROW]
[ROW][C]-2917.98685061096[/C][/ROW]
[ROW][C]-8523.76429492803[/C][/ROW]
[ROW][C]18135.7448225945[/C][/ROW]
[ROW][C]-506.373313044225[/C][/ROW]
[ROW][C]1136.25770365324[/C][/ROW]
[ROW][C]-1001.51714070690[/C][/ROW]
[ROW][C]2169.09952117885[/C][/ROW]
[ROW][C]1383.42448885279[/C][/ROW]
[ROW][C]901.005554864605[/C][/ROW]
[ROW][C]-1947.35266424985[/C][/ROW]
[ROW][C]-1673.26588746986[/C][/ROW]
[ROW][C]5416.37180603755[/C][/ROW]
[ROW][C]-1758.63669934839[/C][/ROW]
[ROW][C]-4328.24608454709[/C][/ROW]
[ROW][C]9930.42739222411[/C][/ROW]
[ROW][C]5996.83386552182[/C][/ROW]
[ROW][C]1474.84797532562[/C][/ROW]
[ROW][C]-203.719424532394[/C][/ROW]
[ROW][C]-7385.35708373907[/C][/ROW]
[ROW][C]-5744.77496558197[/C][/ROW]
[ROW][C]-2272.30463476592[/C][/ROW]
[ROW][C]-4031.51974107734[/C][/ROW]
[ROW][C]3705.51348267378[/C][/ROW]
[ROW][C]1348.43508831468[/C][/ROW]
[ROW][C]-3922.27713513198[/C][/ROW]
[ROW][C]-5055.52905143796[/C][/ROW]
[ROW][C]12151.5233596317[/C][/ROW]
[ROW][C]-1571.10464438759[/C][/ROW]
[ROW][C]2726.54051757193[/C][/ROW]
[ROW][C]-3251.01740573421[/C][/ROW]
[ROW][C]1505.10312501545[/C][/ROW]
[ROW][C]3355.70419823421[/C][/ROW]
[ROW][C]538.043337407411[/C][/ROW]
[ROW][C]-1323.50847255090[/C][/ROW]
[ROW][C]-258.442204996739[/C][/ROW]
[ROW][C]4820.44068246018[/C][/ROW]
[ROW][C]-2907.39542887716[/C][/ROW]
[ROW][C]-739.224002095901[/C][/ROW]
[ROW][C]4246.87420323186[/C][/ROW]
[ROW][C]6920.10094518997[/C][/ROW]
[ROW][C]7472.22451085658[/C][/ROW]
[ROW][C]113.511096909397[/C][/ROW]
[ROW][C]-9801.89392329293[/C][/ROW]
[ROW][C]-3425.51596881118[/C][/ROW]
[ROW][C]-5755.83284241603[/C][/ROW]
[ROW][C]-749.979529471005[/C][/ROW]
[ROW][C]2572.22393747018[/C][/ROW]
[ROW][C]1284.56003984352[/C][/ROW]
[ROW][C]-574.895345105302[/C][/ROW]
[ROW][C]-5248.70055462156[/C][/ROW]
[ROW][C]11727.5022893812[/C][/ROW]
[ROW][C]-3095.13209113457[/C][/ROW]
[ROW][C]-38.5868126136648[/C][/ROW]
[ROW][C]-2180.7714911044[/C][/ROW]
[ROW][C]2846.69252572868[/C][/ROW]
[ROW][C]5196.21698403126[/C][/ROW]
[ROW][C]-3347.59531956846[/C][/ROW]
[ROW][C]-682.915467724065[/C][/ROW]
[ROW][C]-842.72429246952[/C][/ROW]
[ROW][C]774.4191584025[/C][/ROW]
[ROW][C]-733.639441548127[/C][/ROW]
[ROW][C]-4308.48688528394[/C][/ROW]
[/TABLE]
Source: https://freestatistics.org/blog/index.php?pk=4360&T=2

Globally Unique Identifier (entire table): ba.freestatistics.org/blog/index.php?pk=4360&T=2

As an alternative you can also use a QR Code:  

The GUIDs for individual cells are displayed in the table below:

Estimated ARIMA Residuals
Value
7103.78250843282
-375.767467656900
3137.67508858975
-3172.73691945459
-2196.84551043602
-6521.1149290969
-5088.90879103967
-3825.61905151615
-921.121346460611
4222.86318222971
-2917.98685061096
-8523.76429492803
18135.7448225945
-506.373313044225
1136.25770365324
-1001.51714070690
2169.09952117885
1383.42448885279
901.005554864605
-1947.35266424985
-1673.26588746986
5416.37180603755
-1758.63669934839
-4328.24608454709
9930.42739222411
5996.83386552182
1474.84797532562
-203.719424532394
-7385.35708373907
-5744.77496558197
-2272.30463476592
-4031.51974107734
3705.51348267378
1348.43508831468
-3922.27713513198
-5055.52905143796
12151.5233596317
-1571.10464438759
2726.54051757193
-3251.01740573421
1505.10312501545
3355.70419823421
538.043337407411
-1323.50847255090
-258.442204996739
4820.44068246018
-2907.39542887716
-739.224002095901
4246.87420323186
6920.10094518997
7472.22451085658
113.511096909397
-9801.89392329293
-3425.51596881118
-5755.83284241603
-749.979529471005
2572.22393747018
1284.56003984352
-574.895345105302
-5248.70055462156
11727.5022893812
-3095.13209113457
-38.5868126136648
-2180.7714911044
2846.69252572868
5196.21698403126
-3347.59531956846
-682.915467724065
-842.72429246952
774.4191584025
-733.639441548127
-4308.48688528394


Parameters (Session):
par1 = FALSE ; par2 = 1 ; par3 = 0 ; par4 = 0 ; par5 = 12 ; par6 = 3 ; par7 = 1 ; par8 = 0 ; par9 = 1 ;
Parameters (R input):
par1 = FALSE ; par2 = 1 ; par3 = 0 ; par4 = 0 ; par5 = 12 ; par6 = 3 ; par7 = 1 ; par8 = 0 ; par9 = 1 ;
R code (references can be found in the software module):
library(lattice)
if (par1 == 'TRUE') par1 <- TRUE
if (par1 == 'FALSE') par1 <- FALSE
par2 <- as.numeric(par2) #Box-Cox lambda transformation parameter
par3 <- as.numeric(par3) #degree of non-seasonal differencing
par4 <- as.numeric(par4) #degree of seasonal differencing
par5 <- as.numeric(par5) #seasonal period
par6 <- as.numeric(par6) #degree (p) of the non-seasonal AR(p) polynomial
par7 <- as.numeric(par7) #degree (q) of the non-seasonal MA(q) polynomial
par8 <- as.numeric(par8) #degree (P) of the seasonal AR(P) polynomial
par9 <- as.numeric(par9) #degree (Q) of the seasonal MA(Q) polynomial
armaGR <- function(arima.out, names, n){
try1 <- arima.out$coef
try2 <- sqrt(diag(arima.out$var.coef))
try.data.frame <- data.frame(matrix(NA,ncol=4,nrow=length(names)))
dimnames(try.data.frame) <- list(names,c('coef','std','tstat','pv'))
try.data.frame[,1] <- try1
for(i in 1:length(try2)) try.data.frame[which(rownames(try.data.frame)==names(try2)[i]),2] <- try2[i]
try.data.frame[,3] <- try.data.frame[,1] / try.data.frame[,2]
try.data.frame[,4] <- round((1-pt(abs(try.data.frame[,3]),df=n-(length(try2)+1)))*2,5)
vector <- rep(NA,length(names))
vector[is.na(try.data.frame[,4])] <- 0
maxi <- which.max(try.data.frame[,4])
continue <- max(try.data.frame[,4],na.rm=TRUE) > .05
vector[maxi] <- 0
list(summary=try.data.frame,next.vector=vector,continue=continue)
}
arimaSelect <- function(series, order=c(13,0,0), seasonal=list(order=c(2,0,0),period=12), include.mean=F){
nrc <- order[1]+order[3]+seasonal$order[1]+seasonal$order[3]
coeff <- matrix(NA, nrow=nrc*2, ncol=nrc)
pval <- matrix(NA, nrow=nrc*2, ncol=nrc)
mylist <- rep(list(NULL), nrc)
names <- NULL
if(order[1] > 0) names <- paste('ar',1:order[1],sep='')
if(order[3] > 0) names <- c( names , paste('ma',1:order[3],sep='') )
if(seasonal$order[1] > 0) names <- c(names, paste('sar',1:seasonal$order[1],sep=''))
if(seasonal$order[3] > 0) names <- c(names, paste('sma',1:seasonal$order[3],sep=''))
arima.out <- arima(series, order=order, seasonal=seasonal, include.mean=include.mean, method='ML')
mylist[[1]] <- arima.out
last.arma <- armaGR(arima.out, names, length(series))
mystop <- FALSE
i <- 1
coeff[i,] <- last.arma[[1]][,1]
pval [i,] <- last.arma[[1]][,4]
i <- 2
aic <- arima.out$aic
while(!mystop){
mylist[[i]] <- arima.out
arima.out <- arima(series, order=order, seasonal=seasonal, include.mean=include.mean, method='ML', fixed=last.arma$next.vector)
aic <- c(aic, arima.out$aic)
last.arma <- armaGR(arima.out, names, length(series))
mystop <- !last.arma$continue
coeff[i,] <- last.arma[[1]][,1]
pval [i,] <- last.arma[[1]][,4]
i <- i+1
}
list(coeff, pval, mylist, aic=aic)
}
arimaSelectplot <- function(arimaSelect.out,noms,choix){
noms <- names(arimaSelect.out[[3]][[1]]$coef)
coeff <- arimaSelect.out[[1]]
k <- min(which(is.na(coeff[,1])))-1
coeff <- coeff[1:k,]
pval <- arimaSelect.out[[2]][1:k,]
aic <- arimaSelect.out$aic[1:k]
coeff[coeff==0] <- NA
n <- ncol(coeff)
if(missing(choix)) choix <- k
layout(matrix(c(1,1,1,2,
3,3,3,2,
3,3,3,4,
5,6,7,7),nr=4),
widths=c(10,35,45,15),
heights=c(30,30,15,15))
couleurs <- rainbow(75)[1:50]#(50)
ticks <- pretty(coeff)
par(mar=c(1,1,3,1))
plot(aic,k:1-.5,type='o',pch=21,bg='blue',cex=2,axes=F,lty=2,xpd=NA)
points(aic[choix],k-choix+.5,pch=21,cex=4,bg=2,xpd=NA)
title('aic',line=2)
par(mar=c(3,0,0,0))
plot(0,axes=F,xlab='',ylab='',xlim=range(ticks),ylim=c(.1,1))
rect(xleft = min(ticks) + (0:49)/50*(max(ticks)-min(ticks)),
xright = min(ticks) + (1:50)/50*(max(ticks)-min(ticks)),
ytop = rep(1,50),
ybottom= rep(0,50),col=couleurs,border=NA)
axis(1,ticks)
rect(xleft=min(ticks),xright=max(ticks),ytop=1,ybottom=0)
text(mean(coeff,na.rm=T),.5,'coefficients',cex=2,font=2)
par(mar=c(1,1,3,1))
image(1:n,1:k,t(coeff[k:1,]),axes=F,col=couleurs,zlim=range(ticks))
for(i in 1:n) for(j in 1:k) if(!is.na(coeff[j,i])) {
if(pval[j,i]<.01) symb = 'green'
else if( (pval[j,i]<.05) & (pval[j,i]>=.01)) symb = 'orange'
else if( (pval[j,i]<.1) & (pval[j,i]>=.05)) symb = 'red'
else symb = 'black'
polygon(c(i+.5 ,i+.2 ,i+.5 ,i+.5),
c(k-j+0.5,k-j+0.5,k-j+0.8,k-j+0.5),
col=symb)
if(j==choix) {
rect(xleft=i-.5,
xright=i+.5,
ybottom=k-j+1.5,
ytop=k-j+.5,
lwd=4)
text(i,
k-j+1,
round(coeff[j,i],2),
cex=1.2,
font=2)
}
else{
rect(xleft=i-.5,xright=i+.5,ybottom=k-j+1.5,ytop=k-j+.5)
text(i,k-j+1,round(coeff[j,i],2),cex=1.2,font=1)
}
}
axis(3,1:n,noms)
par(mar=c(0.5,0,0,0.5))
plot(0,axes=F,xlab='',ylab='',type='n',xlim=c(0,8),ylim=c(-.2,.8))
cols <- c('green','orange','red','black')
niv <- c('0','0.01','0.05','0.1')
for(i in 0:3){
polygon(c(1+2*i ,1+2*i ,1+2*i-.5 ,1+2*i),
c(.4 ,.7 , .4 , .4),
col=cols[i+1])
text(2*i,0.5,niv[i+1],cex=1.5)
}
text(8,.5,1,cex=1.5)
text(4,0,'p-value',cex=2)
box()
residus <- arimaSelect.out[[3]][[choix]]$res
par(mar=c(1,2,4,1))
acf(residus,main='')
title('acf',line=.5)
par(mar=c(1,2,4,1))
pacf(residus,main='')
title('pacf',line=.5)
par(mar=c(2,2,4,1))
qqnorm(residus,main='')
title('qq-norm',line=.5)
residus
}
if (par2 == 0) x <- log(x)
if (par2 != 0) x <- x^par2
(selection <- arimaSelect(x, order=c(par6,par3,par7), seasonal=list(order=c(par8,par4,par9), period=par5)))
bitmap(file='test1.png')
resid <- arimaSelectplot(selection)
dev.off()
resid
bitmap(file='test2.png')
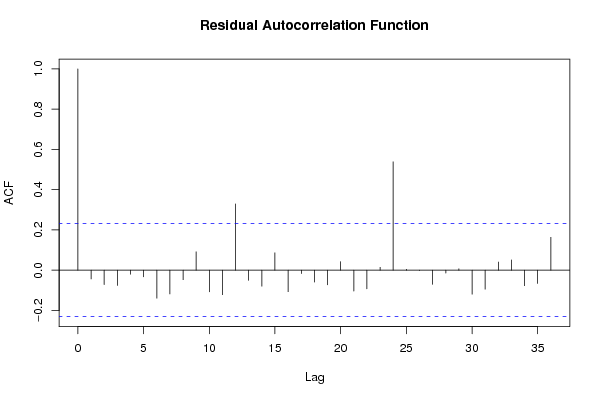
acf(resid,length(resid)/2, main='Residual Autocorrelation Function')
dev.off()
bitmap(file='test3.png')
pacf(resid,length(resid)/2, main='Residual Partial Autocorrelation Function')
dev.off()
bitmap(file='test4.png')
cpgram(resid, main='Residual Cumulative Periodogram')
dev.off()
bitmap(file='test5.png')
hist(resid, main='Residual Histogram', xlab='values of Residuals')
dev.off()
bitmap(file='test6.png')
densityplot(~resid,col='black',main='Residual Density Plot', xlab='values of Residuals')
dev.off()
bitmap(file='test7.png')
qqnorm(resid, main='Residual Normal Q-Q Plot')
dev.off()
ncols <- length(selection[[1]][1,])
nrows <- length(selection[[2]][,1])-1
load(file='createtable')
a<-table.start()
a<-table.row.start(a)
a<-table.element(a,'ARIMA Parameter Estimation and Backward Selection', ncols+1,TRUE)
a<-table.row.end(a)
a<-table.row.start(a)
a<-table.element(a,'Iteration', header=TRUE)
for (i in 1:ncols) {
a<-table.element(a,names(selection[[3]][[1]]$coef)[i],header=TRUE)
}
a<-table.row.end(a)
for (j in 1:nrows) {
a<-table.row.start(a)
mydum <- 'Estimates ('
mydum <- paste(mydum,j)
mydum <- paste(mydum,')')
a<-table.element(a,mydum, header=TRUE)
for (i in 1:ncols) {
a<-table.element(a,round(selection[[1]][j,i],4))
}
a<-table.row.end(a)
a<-table.row.start(a)
a<-table.element(a,'(p-val)', header=TRUE)
for (i in 1:ncols) {
mydum <- '('
mydum <- paste(mydum,round(selection[[2]][j,i],4),sep='')
mydum <- paste(mydum,')')
a<-table.element(a,mydum)
}
a<-table.row.end(a)
}
a<-table.end(a)
table.save(a,file='mytable.tab')
a<-table.start()
a<-table.row.start(a)
a<-table.element(a,'Estimated ARIMA Residuals', 1,TRUE)
a<-table.row.end(a)
a<-table.row.start(a)
a<-table.element(a,'Value', 1,TRUE)
a<-table.row.end(a)
for (i in (par4*par5+par3):length(resid)) {
a<-table.row.start(a)
a<-table.element(a,resid[i])
a<-table.row.end(a)
}
a<-table.end(a)
table.save(a,file='mytable1.tab')