Free Statistics

of Irreproducible Research!

Author's title

Author*Unverified author*
R Software Modulerwasp_multipleregression.wasp
Title produced by softwareMultiple Regression
Date of computationSun, 16 Dec 2007 10:59:10 -0700
Cite this page as followsStatistical Computations at FreeStatistics.org, Office for Research Development and Education, URL https://freestatistics.org/blog/index.php?v=date/2007/Dec/16/t1197827063oqot0jp14xv2uek.htm/, Retrieved Thu, 02 May 2024 06:13:27 +0000
Statistical Computations at FreeStatistics.org, Office for Research Development and Education, URL https://freestatistics.org/blog/index.php?pk=4228, Retrieved Thu, 02 May 2024 06:13:27 +0000
QR Codes:

Original text written by user:
IsPrivate?No (this computation is public)
User-defined keywords
Estimated Impact203
Family? (F = Feedback message, R = changed R code, M = changed R Module, P = changed Parameters, D = changed Data)
-       [Multiple Regression] [Paper] [2007-12-16 17:59:10] [3463f71ebce131edf0c83e066f45702c] [Current]
- RMPD    [Multiple Regression] [paper19] [2011-12-20 10:57:46] [f7a862281046b7153543b12c78921b36]
- RM D    [Multiple Regression] [] [2012-12-20 11:59:16] [74be16979710d4c4e7c6647856088456]
Feedback Forum

Post a new message
Dataseries X:
99.8	108.4	1.7
96.8	117	1.4
87.0	103.8	1.3
96.3	100.8	1.4
107.1	110.6	1.3
115.2	104.0	1.3
106.1	112.6	1.4
89.5	107.3	2.0
91.3	98.9	1.7
97.6	109.8	1.8
100.7	104.9	1.7
104.6	102.2	1.6
94.7	123.9	1.7
101.8	124.9	1.9
102.5	112.7	1.8
105.3	121.9	1.7
110.3	100.6	1.6
109.8	104.3	1.8
117.3	120.4	1.6
118.8	107.5	1.5
131.3	102.9	1.5
125.9	125.6	1.3
133.1	107.5	1.4
147.0	108.8	1.4
145.8	128.4	1.3
164.4	121.1	1.3
149.8	119.5	1.2
137.7	128.7	1.1
151.7	108.7	1.4
156.8	105.5	1.2
180.0	119.8	1.5
180.4	111.3	1.1
170.4	110.6	1.3
191.6	120.1	1.5
199.5	97.5	1.1
218.2	107.7	1.4
217.5	127.3	1.3
205.0	117.2	1.5
194.0	119.8	1.6
199.3	116.2	1.7
219.3	111.0	1.1
211.1	112.4	1.6
215.2	130.6	1.3
240.2	109.1	1.7
242.2	118.8	1.6
240.7	123.9	1.7
255.4	101.6	1.9
253.0	112.8	1.8
218.2	128.0	1.9
203.7	129.6	1.6
205.6	125.8	1.5
215.6	119.5	1.6
188.5	115.7	1.6
202.9	113.6	1.7
214.0	129.7	2.0
230.3	112.0	2.0
230.0	116.8	1.9
241.0	127.0	1.7
259.6	112.9	1.8
247.8	113.3	1.9
270.3	121.7	1.7


Summary of compuational transaction
Raw Inputview raw input (R code)
Raw Outputview raw output of R engine
Computing time6 seconds
R Server'Herman Ole Andreas Wold' @ 193.190.124.10:1001

\begin{tabular}{lllllllll}
\hline
Summary of compuational transaction \tabularnewline
Raw Input & view raw input (R code)  \tabularnewline
Raw Output & view raw output of R engine  \tabularnewline
Computing time & 6 seconds \tabularnewline
R Server & 'Herman Ole Andreas Wold' @ 193.190.124.10:1001 \tabularnewline
\hline
\end{tabular}
%Source: https://freestatistics.org/blog/index.php?pk=4228&T=0

[TABLE]
[ROW][C]Summary of compuational transaction[/C][/ROW]
[ROW][C]Raw Input[/C][C]view raw input (R code) [/C][/ROW]
[ROW][C]Raw Output[/C][C]view raw output of R engine [/C][/ROW]
[ROW][C]Computing time[/C][C]6 seconds[/C][/ROW]
[ROW][C]R Server[/C][C]'Herman Ole Andreas Wold' @ 193.190.124.10:1001[/C][/ROW]
[/TABLE]
Source: https://freestatistics.org/blog/index.php?pk=4228&T=0

Globally Unique Identifier (entire table): ba.freestatistics.org/blog/index.php?pk=4228&T=0

As an alternative you can also use a QR Code:  

The GUIDs for individual cells are displayed in the table below:

Summary of compuational transaction
Raw Inputview raw input (R code)
Raw Outputview raw output of R engine
Computing time6 seconds
R Server'Herman Ole Andreas Wold' @ 193.190.124.10:1001


Multiple Linear Regression - Estimated Regression Equation
Grondstoffen[t] = -387.887879955373 + 5.0179992167185Consumptiegoederen[t] + 21.7572131492128`Inflatie `[t] -89.5033314455744M1[t] -103.273412765404M2[t] -80.2264643941584M3[t] -83.121407795533M4[t] -35.7598928251919M5[t] -27.7662794683602M6[t] -94.840436511422M7[t] -25.5589281499934M8[t] -23.8563752357156M9[t] -76.1466060869877M10[t] + 16.88372533018M11[t] + e[t]

\begin{tabular}{lllllllll}
\hline
Multiple Linear Regression - Estimated Regression Equation \tabularnewline
Grondstoffen[t] =  -387.887879955373 +  5.0179992167185Consumptiegoederen[t] +  21.7572131492128`Inflatie
`[t] -89.5033314455744M1[t] -103.273412765404M2[t] -80.2264643941584M3[t] -83.121407795533M4[t] -35.7598928251919M5[t] -27.7662794683602M6[t] -94.840436511422M7[t] -25.5589281499934M8[t] -23.8563752357156M9[t] -76.1466060869877M10[t] +  16.88372533018M11[t]  + e[t] \tabularnewline
\hline
\end{tabular}
%Source: https://freestatistics.org/blog/index.php?pk=4228&T=1

[TABLE]
[ROW][C]Multiple Linear Regression - Estimated Regression Equation[/C][/ROW]
[ROW][C]Grondstoffen[t] =  -387.887879955373 +  5.0179992167185Consumptiegoederen[t] +  21.7572131492128`Inflatie
`[t] -89.5033314455744M1[t] -103.273412765404M2[t] -80.2264643941584M3[t] -83.121407795533M4[t] -35.7598928251919M5[t] -27.7662794683602M6[t] -94.840436511422M7[t] -25.5589281499934M8[t] -23.8563752357156M9[t] -76.1466060869877M10[t] +  16.88372533018M11[t]  + e[t][/C][/ROW]
[/TABLE]
Source: https://freestatistics.org/blog/index.php?pk=4228&T=1

Globally Unique Identifier (entire table): ba.freestatistics.org/blog/index.php?pk=4228&T=1

As an alternative you can also use a QR Code:  

The GUIDs for individual cells are displayed in the table below:

Multiple Linear Regression - Estimated Regression Equation
Grondstoffen[t] = -387.887879955373 + 5.0179992167185Consumptiegoederen[t] + 21.7572131492128`Inflatie `[t] -89.5033314455744M1[t] -103.273412765404M2[t] -80.2264643941584M3[t] -83.121407795533M4[t] -35.7598928251919M5[t] -27.7662794683602M6[t] -94.840436511422M7[t] -25.5589281499934M8[t] -23.8563752357156M9[t] -76.1466060869877M10[t] + 16.88372533018M11[t] + e[t]


Multiple Linear Regression - Ordinary Least Squares
VariableParameterS.D.T-STATH0: parameter = 02-tail p-value1-tail p-value
(Intercept)-387.887879955373122.186803-3.17450.0026480.001324
Consumptiegoederen5.01799921671851.0541954.761.9e-059e-06
`Inflatie `21.757213149212827.639640.78720.4351320.217566
M1-89.503331445574433.770412-2.65030.0109220.005461
M2-103.27341276540434.675896-2.97820.0045740.002287
M3-80.226464394158432.936999-2.43580.0187070.009353
M4-83.12140779553333.168451-2.5060.0157290.007865
M5-35.759892825191932.289816-1.10750.2737280.136864
M6-27.766279468360231.835204-0.87220.387540.19377
M7-94.84043651142234.91231-2.71650.0092040.004602
M8-25.558928149993431.726347-0.80560.4245270.212264
M9-23.856375235715631.717242-0.75220.4557070.227853
M10-76.146606086987734.28162-2.22120.0311920.015596
M1116.8837253301832.0027340.52760.6002790.300139

\begin{tabular}{lllllllll}
\hline
Multiple Linear Regression - Ordinary Least Squares \tabularnewline
Variable & Parameter & S.D. & T-STATH0: parameter = 0 & 2-tail p-value & 1-tail p-value \tabularnewline
(Intercept) & -387.887879955373 & 122.186803 & -3.1745 & 0.002648 & 0.001324 \tabularnewline
Consumptiegoederen & 5.0179992167185 & 1.054195 & 4.76 & 1.9e-05 & 9e-06 \tabularnewline
`Inflatie
` & 21.7572131492128 & 27.63964 & 0.7872 & 0.435132 & 0.217566 \tabularnewline
M1 & -89.5033314455744 & 33.770412 & -2.6503 & 0.010922 & 0.005461 \tabularnewline
M2 & -103.273412765404 & 34.675896 & -2.9782 & 0.004574 & 0.002287 \tabularnewline
M3 & -80.2264643941584 & 32.936999 & -2.4358 & 0.018707 & 0.009353 \tabularnewline
M4 & -83.121407795533 & 33.168451 & -2.506 & 0.015729 & 0.007865 \tabularnewline
M5 & -35.7598928251919 & 32.289816 & -1.1075 & 0.273728 & 0.136864 \tabularnewline
M6 & -27.7662794683602 & 31.835204 & -0.8722 & 0.38754 & 0.19377 \tabularnewline
M7 & -94.840436511422 & 34.91231 & -2.7165 & 0.009204 & 0.004602 \tabularnewline
M8 & -25.5589281499934 & 31.726347 & -0.8056 & 0.424527 & 0.212264 \tabularnewline
M9 & -23.8563752357156 & 31.717242 & -0.7522 & 0.455707 & 0.227853 \tabularnewline
M10 & -76.1466060869877 & 34.28162 & -2.2212 & 0.031192 & 0.015596 \tabularnewline
M11 & 16.88372533018 & 32.002734 & 0.5276 & 0.600279 & 0.300139 \tabularnewline
\hline
\end{tabular}
%Source: https://freestatistics.org/blog/index.php?pk=4228&T=2

[TABLE]
[ROW][C]Multiple Linear Regression - Ordinary Least Squares[/C][/ROW]
[ROW][C]Variable[/C][C]Parameter[/C][C]S.D.[/C][C]T-STATH0: parameter = 0[/C][C]2-tail p-value[/C][C]1-tail p-value[/C][/ROW]
[ROW][C](Intercept)[/C][C]-387.887879955373[/C][C]122.186803[/C][C]-3.1745[/C][C]0.002648[/C][C]0.001324[/C][/ROW]
[ROW][C]Consumptiegoederen[/C][C]5.0179992167185[/C][C]1.054195[/C][C]4.76[/C][C]1.9e-05[/C][C]9e-06[/C][/ROW]
[ROW][C]`Inflatie
`[/C][C]21.7572131492128[/C][C]27.63964[/C][C]0.7872[/C][C]0.435132[/C][C]0.217566[/C][/ROW]
[ROW][C]M1[/C][C]-89.5033314455744[/C][C]33.770412[/C][C]-2.6503[/C][C]0.010922[/C][C]0.005461[/C][/ROW]
[ROW][C]M2[/C][C]-103.273412765404[/C][C]34.675896[/C][C]-2.9782[/C][C]0.004574[/C][C]0.002287[/C][/ROW]
[ROW][C]M3[/C][C]-80.2264643941584[/C][C]32.936999[/C][C]-2.4358[/C][C]0.018707[/C][C]0.009353[/C][/ROW]
[ROW][C]M4[/C][C]-83.121407795533[/C][C]33.168451[/C][C]-2.506[/C][C]0.015729[/C][C]0.007865[/C][/ROW]
[ROW][C]M5[/C][C]-35.7598928251919[/C][C]32.289816[/C][C]-1.1075[/C][C]0.273728[/C][C]0.136864[/C][/ROW]
[ROW][C]M6[/C][C]-27.7662794683602[/C][C]31.835204[/C][C]-0.8722[/C][C]0.38754[/C][C]0.19377[/C][/ROW]
[ROW][C]M7[/C][C]-94.840436511422[/C][C]34.91231[/C][C]-2.7165[/C][C]0.009204[/C][C]0.004602[/C][/ROW]
[ROW][C]M8[/C][C]-25.5589281499934[/C][C]31.726347[/C][C]-0.8056[/C][C]0.424527[/C][C]0.212264[/C][/ROW]
[ROW][C]M9[/C][C]-23.8563752357156[/C][C]31.717242[/C][C]-0.7522[/C][C]0.455707[/C][C]0.227853[/C][/ROW]
[ROW][C]M10[/C][C]-76.1466060869877[/C][C]34.28162[/C][C]-2.2212[/C][C]0.031192[/C][C]0.015596[/C][/ROW]
[ROW][C]M11[/C][C]16.88372533018[/C][C]32.002734[/C][C]0.5276[/C][C]0.600279[/C][C]0.300139[/C][/ROW]
[/TABLE]
Source: https://freestatistics.org/blog/index.php?pk=4228&T=2

Globally Unique Identifier (entire table): ba.freestatistics.org/blog/index.php?pk=4228&T=2

As an alternative you can also use a QR Code:  

The GUIDs for individual cells are displayed in the table below:

Multiple Linear Regression - Ordinary Least Squares
VariableParameterS.D.T-STATH0: parameter = 02-tail p-value1-tail p-value
(Intercept)-387.887879955373122.186803-3.17450.0026480.001324
Consumptiegoederen5.01799921671851.0541954.761.9e-059e-06
`Inflatie `21.757213149212827.639640.78720.4351320.217566
M1-89.503331445574433.770412-2.65030.0109220.005461
M2-103.27341276540434.675896-2.97820.0045740.002287
M3-80.226464394158432.936999-2.43580.0187070.009353
M4-83.12140779553333.168451-2.5060.0157290.007865
M5-35.759892825191932.289816-1.10750.2737280.136864
M6-27.766279468360231.835204-0.87220.387540.19377
M7-94.84043651142234.91231-2.71650.0092040.004602
M8-25.558928149993431.726347-0.80560.4245270.212264
M9-23.856375235715631.717242-0.75220.4557070.227853
M10-76.146606086987734.28162-2.22120.0311920.015596
M1116.8837253301832.0027340.52760.6002790.300139


Multiple Linear Regression - Regression Statistics
Multiple R0.617369451014282
R-squared0.381145039045675
Adjusted R-squared0.209972390271075
F-TEST (value)2.22667021731705
F-TEST (DF numerator)13
F-TEST (DF denominator)47
p-value0.0229053679323996
Multiple Linear Regression - Residual Statistics
Residual Standard Deviation50.1290009306576
Sum Squared Residuals118107.086512376

\begin{tabular}{lllllllll}
\hline
Multiple Linear Regression - Regression Statistics \tabularnewline
Multiple R & 0.617369451014282 \tabularnewline
R-squared & 0.381145039045675 \tabularnewline
Adjusted R-squared & 0.209972390271075 \tabularnewline
F-TEST (value) & 2.22667021731705 \tabularnewline
F-TEST (DF numerator) & 13 \tabularnewline
F-TEST (DF denominator) & 47 \tabularnewline
p-value & 0.0229053679323996 \tabularnewline
Multiple Linear Regression - Residual Statistics \tabularnewline
Residual Standard Deviation & 50.1290009306576 \tabularnewline
Sum Squared Residuals & 118107.086512376 \tabularnewline
\hline
\end{tabular}
%Source: https://freestatistics.org/blog/index.php?pk=4228&T=3

[TABLE]
[ROW][C]Multiple Linear Regression - Regression Statistics[/C][/ROW]
[ROW][C]Multiple R[/C][C]0.617369451014282[/C][/ROW]
[ROW][C]R-squared[/C][C]0.381145039045675[/C][/ROW]
[ROW][C]Adjusted R-squared[/C][C]0.209972390271075[/C][/ROW]
[ROW][C]F-TEST (value)[/C][C]2.22667021731705[/C][/ROW]
[ROW][C]F-TEST (DF numerator)[/C][C]13[/C][/ROW]
[ROW][C]F-TEST (DF denominator)[/C][C]47[/C][/ROW]
[ROW][C]p-value[/C][C]0.0229053679323996[/C][/ROW]
[ROW][C]Multiple Linear Regression - Residual Statistics[/C][/ROW]
[ROW][C]Residual Standard Deviation[/C][C]50.1290009306576[/C][/ROW]
[ROW][C]Sum Squared Residuals[/C][C]118107.086512376[/C][/ROW]
[/TABLE]
Source: https://freestatistics.org/blog/index.php?pk=4228&T=3

Globally Unique Identifier (entire table): ba.freestatistics.org/blog/index.php?pk=4228&T=3

As an alternative you can also use a QR Code:  

The GUIDs for individual cells are displayed in the table below:

Multiple Linear Regression - Regression Statistics
Multiple R0.617369451014282
R-squared0.381145039045675
Adjusted R-squared0.209972390271075
F-TEST (value)2.22667021731705
F-TEST (DF numerator)13
F-TEST (DF denominator)47
p-value0.0229053679323996
Multiple Linear Regression - Residual Statistics
Residual Standard Deviation50.1290009306576
Sum Squared Residuals118107.086512376


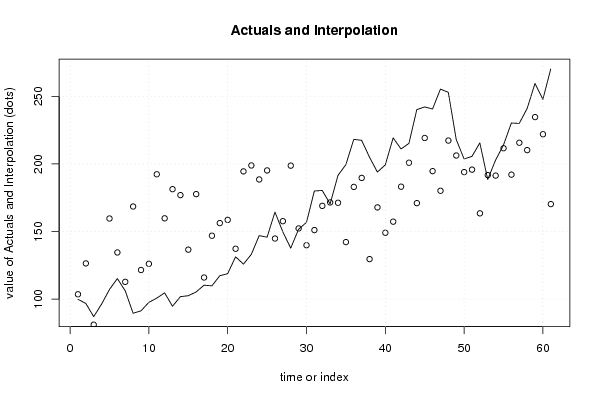
Multiple Linear Regression - Actuals, Interpolation, and Residuals
Time or IndexActualsInterpolationForecastResidualsPrediction Error
199.8103.547166045001-3.74716604500073
296.8126.404714044186-29.6047140441865
38781.0383514398265.96164856017397
496.365.265131703217231.0348682967828
5107.1159.627317682478-52.5273176824784
6115.2134.502136208968-19.3021362089679
7106.1112.758493744607-6.65849374460653
889.5168.498934146955-78.9989341469548
991.3121.523129696033-30.2231296960333
1097.6126.104811621914-28.5048116219141
11100.7192.37122556224-91.67122556224
12104.6159.763181031999-55.1631810319987
1394.7181.326153904137-86.626153904137
14101.8176.925514430869-75.125514430869
15102.5136.577151043227-34.0771510432271
16105.3177.672079120742-72.3720791207415
17110.3115.974489460057-5.67448946005715
18109.8146.886142548590-37.0861425485898
19117.3156.250330264853-38.9503302648535
20118.8158.623927415692-39.8239274156921
21131.3137.243683933065-5.94368393306475
22125.9194.51059267146-68.61059267146
23133.1198.890859580944-65.7908595809442
24147188.530533232498-41.5305332324982
25145.8195.204265119685-49.4042651196853
26164.4144.80278951781119.5972104821890
27149.8157.645217827385-7.84521782738527
28137.7198.740145904900-61.0401459048996
29151.7152.268840485635-0.568840485634559
30156.8139.85341371912416.9465862808756
31180151.06380941990128.9361905800989
32180.4168.98943917953711.4105608204627
33170.4171.530835271955-1.13083527195464
34191.6171.26303960935120.3369603906492
35199.5142.18370346899557.3162965310047
36218.2183.01073409410835.1892659058921
37217.5189.68446598129527.8155340187051
38205129.58403520245175.4159647975486
39194167.85350285208626.1464971479141
40199.3149.06948358544650.230516414554
41219.3157.28307473932362.0169252606768
42211.1183.18049357416727.9195064258328
43215.2200.90675833061814.2932416693816
44240.2171.00416879228469.1958312077158
45242.2219.20559279381022.9944072061897
46240.7194.68287926272446.0171207372762
47255.4180.16327077691175.2367292230887
48253217.30541535905735.6945846409426
49218.2206.25139332252611.9486066774744
50203.7193.9829468046829.71705319531788
51205.6195.7857768374769.81422316252433
52215.6163.45315968569652.1468403143042
53188.5191.746277632507-3.24627763250664
54202.9191.37781394915111.5221860508494
55214211.6206082400212.37939175997943
56230.3192.08353046553238.2164695344683
57230215.69675830513714.3032416948629
58241210.23867683455130.7613231654489
59259.6234.69094061090924.9090593890908
60247.8221.99013628233825.8098637176621
61270.3170.286555627356100.013444372644

\begin{tabular}{lllllllll}
\hline
Multiple Linear Regression - Actuals, Interpolation, and Residuals \tabularnewline
Time or Index & Actuals & InterpolationForecast & ResidualsPrediction Error \tabularnewline
1 & 99.8 & 103.547166045001 & -3.74716604500073 \tabularnewline
2 & 96.8 & 126.404714044186 & -29.6047140441865 \tabularnewline
3 & 87 & 81.038351439826 & 5.96164856017397 \tabularnewline
4 & 96.3 & 65.2651317032172 & 31.0348682967828 \tabularnewline
5 & 107.1 & 159.627317682478 & -52.5273176824784 \tabularnewline
6 & 115.2 & 134.502136208968 & -19.3021362089679 \tabularnewline
7 & 106.1 & 112.758493744607 & -6.65849374460653 \tabularnewline
8 & 89.5 & 168.498934146955 & -78.9989341469548 \tabularnewline
9 & 91.3 & 121.523129696033 & -30.2231296960333 \tabularnewline
10 & 97.6 & 126.104811621914 & -28.5048116219141 \tabularnewline
11 & 100.7 & 192.37122556224 & -91.67122556224 \tabularnewline
12 & 104.6 & 159.763181031999 & -55.1631810319987 \tabularnewline
13 & 94.7 & 181.326153904137 & -86.626153904137 \tabularnewline
14 & 101.8 & 176.925514430869 & -75.125514430869 \tabularnewline
15 & 102.5 & 136.577151043227 & -34.0771510432271 \tabularnewline
16 & 105.3 & 177.672079120742 & -72.3720791207415 \tabularnewline
17 & 110.3 & 115.974489460057 & -5.67448946005715 \tabularnewline
18 & 109.8 & 146.886142548590 & -37.0861425485898 \tabularnewline
19 & 117.3 & 156.250330264853 & -38.9503302648535 \tabularnewline
20 & 118.8 & 158.623927415692 & -39.8239274156921 \tabularnewline
21 & 131.3 & 137.243683933065 & -5.94368393306475 \tabularnewline
22 & 125.9 & 194.51059267146 & -68.61059267146 \tabularnewline
23 & 133.1 & 198.890859580944 & -65.7908595809442 \tabularnewline
24 & 147 & 188.530533232498 & -41.5305332324982 \tabularnewline
25 & 145.8 & 195.204265119685 & -49.4042651196853 \tabularnewline
26 & 164.4 & 144.802789517811 & 19.5972104821890 \tabularnewline
27 & 149.8 & 157.645217827385 & -7.84521782738527 \tabularnewline
28 & 137.7 & 198.740145904900 & -61.0401459048996 \tabularnewline
29 & 151.7 & 152.268840485635 & -0.568840485634559 \tabularnewline
30 & 156.8 & 139.853413719124 & 16.9465862808756 \tabularnewline
31 & 180 & 151.063809419901 & 28.9361905800989 \tabularnewline
32 & 180.4 & 168.989439179537 & 11.4105608204627 \tabularnewline
33 & 170.4 & 171.530835271955 & -1.13083527195464 \tabularnewline
34 & 191.6 & 171.263039609351 & 20.3369603906492 \tabularnewline
35 & 199.5 & 142.183703468995 & 57.3162965310047 \tabularnewline
36 & 218.2 & 183.010734094108 & 35.1892659058921 \tabularnewline
37 & 217.5 & 189.684465981295 & 27.8155340187051 \tabularnewline
38 & 205 & 129.584035202451 & 75.4159647975486 \tabularnewline
39 & 194 & 167.853502852086 & 26.1464971479141 \tabularnewline
40 & 199.3 & 149.069483585446 & 50.230516414554 \tabularnewline
41 & 219.3 & 157.283074739323 & 62.0169252606768 \tabularnewline
42 & 211.1 & 183.180493574167 & 27.9195064258328 \tabularnewline
43 & 215.2 & 200.906758330618 & 14.2932416693816 \tabularnewline
44 & 240.2 & 171.004168792284 & 69.1958312077158 \tabularnewline
45 & 242.2 & 219.205592793810 & 22.9944072061897 \tabularnewline
46 & 240.7 & 194.682879262724 & 46.0171207372762 \tabularnewline
47 & 255.4 & 180.163270776911 & 75.2367292230887 \tabularnewline
48 & 253 & 217.305415359057 & 35.6945846409426 \tabularnewline
49 & 218.2 & 206.251393322526 & 11.9486066774744 \tabularnewline
50 & 203.7 & 193.982946804682 & 9.71705319531788 \tabularnewline
51 & 205.6 & 195.785776837476 & 9.81422316252433 \tabularnewline
52 & 215.6 & 163.453159685696 & 52.1468403143042 \tabularnewline
53 & 188.5 & 191.746277632507 & -3.24627763250664 \tabularnewline
54 & 202.9 & 191.377813949151 & 11.5221860508494 \tabularnewline
55 & 214 & 211.620608240021 & 2.37939175997943 \tabularnewline
56 & 230.3 & 192.083530465532 & 38.2164695344683 \tabularnewline
57 & 230 & 215.696758305137 & 14.3032416948629 \tabularnewline
58 & 241 & 210.238676834551 & 30.7613231654489 \tabularnewline
59 & 259.6 & 234.690940610909 & 24.9090593890908 \tabularnewline
60 & 247.8 & 221.990136282338 & 25.8098637176621 \tabularnewline
61 & 270.3 & 170.286555627356 & 100.013444372644 \tabularnewline
\hline
\end{tabular}
%Source: https://freestatistics.org/blog/index.php?pk=4228&T=4

[TABLE]
[ROW][C]Multiple Linear Regression - Actuals, Interpolation, and Residuals[/C][/ROW]
[ROW][C]Time or Index[/C][C]Actuals[/C][C]InterpolationForecast[/C][C]ResidualsPrediction Error[/C][/ROW]
[ROW][C]1[/C][C]99.8[/C][C]103.547166045001[/C][C]-3.74716604500073[/C][/ROW]
[ROW][C]2[/C][C]96.8[/C][C]126.404714044186[/C][C]-29.6047140441865[/C][/ROW]
[ROW][C]3[/C][C]87[/C][C]81.038351439826[/C][C]5.96164856017397[/C][/ROW]
[ROW][C]4[/C][C]96.3[/C][C]65.2651317032172[/C][C]31.0348682967828[/C][/ROW]
[ROW][C]5[/C][C]107.1[/C][C]159.627317682478[/C][C]-52.5273176824784[/C][/ROW]
[ROW][C]6[/C][C]115.2[/C][C]134.502136208968[/C][C]-19.3021362089679[/C][/ROW]
[ROW][C]7[/C][C]106.1[/C][C]112.758493744607[/C][C]-6.65849374460653[/C][/ROW]
[ROW][C]8[/C][C]89.5[/C][C]168.498934146955[/C][C]-78.9989341469548[/C][/ROW]
[ROW][C]9[/C][C]91.3[/C][C]121.523129696033[/C][C]-30.2231296960333[/C][/ROW]
[ROW][C]10[/C][C]97.6[/C][C]126.104811621914[/C][C]-28.5048116219141[/C][/ROW]
[ROW][C]11[/C][C]100.7[/C][C]192.37122556224[/C][C]-91.67122556224[/C][/ROW]
[ROW][C]12[/C][C]104.6[/C][C]159.763181031999[/C][C]-55.1631810319987[/C][/ROW]
[ROW][C]13[/C][C]94.7[/C][C]181.326153904137[/C][C]-86.626153904137[/C][/ROW]
[ROW][C]14[/C][C]101.8[/C][C]176.925514430869[/C][C]-75.125514430869[/C][/ROW]
[ROW][C]15[/C][C]102.5[/C][C]136.577151043227[/C][C]-34.0771510432271[/C][/ROW]
[ROW][C]16[/C][C]105.3[/C][C]177.672079120742[/C][C]-72.3720791207415[/C][/ROW]
[ROW][C]17[/C][C]110.3[/C][C]115.974489460057[/C][C]-5.67448946005715[/C][/ROW]
[ROW][C]18[/C][C]109.8[/C][C]146.886142548590[/C][C]-37.0861425485898[/C][/ROW]
[ROW][C]19[/C][C]117.3[/C][C]156.250330264853[/C][C]-38.9503302648535[/C][/ROW]
[ROW][C]20[/C][C]118.8[/C][C]158.623927415692[/C][C]-39.8239274156921[/C][/ROW]
[ROW][C]21[/C][C]131.3[/C][C]137.243683933065[/C][C]-5.94368393306475[/C][/ROW]
[ROW][C]22[/C][C]125.9[/C][C]194.51059267146[/C][C]-68.61059267146[/C][/ROW]
[ROW][C]23[/C][C]133.1[/C][C]198.890859580944[/C][C]-65.7908595809442[/C][/ROW]
[ROW][C]24[/C][C]147[/C][C]188.530533232498[/C][C]-41.5305332324982[/C][/ROW]
[ROW][C]25[/C][C]145.8[/C][C]195.204265119685[/C][C]-49.4042651196853[/C][/ROW]
[ROW][C]26[/C][C]164.4[/C][C]144.802789517811[/C][C]19.5972104821890[/C][/ROW]
[ROW][C]27[/C][C]149.8[/C][C]157.645217827385[/C][C]-7.84521782738527[/C][/ROW]
[ROW][C]28[/C][C]137.7[/C][C]198.740145904900[/C][C]-61.0401459048996[/C][/ROW]
[ROW][C]29[/C][C]151.7[/C][C]152.268840485635[/C][C]-0.568840485634559[/C][/ROW]
[ROW][C]30[/C][C]156.8[/C][C]139.853413719124[/C][C]16.9465862808756[/C][/ROW]
[ROW][C]31[/C][C]180[/C][C]151.063809419901[/C][C]28.9361905800989[/C][/ROW]
[ROW][C]32[/C][C]180.4[/C][C]168.989439179537[/C][C]11.4105608204627[/C][/ROW]
[ROW][C]33[/C][C]170.4[/C][C]171.530835271955[/C][C]-1.13083527195464[/C][/ROW]
[ROW][C]34[/C][C]191.6[/C][C]171.263039609351[/C][C]20.3369603906492[/C][/ROW]
[ROW][C]35[/C][C]199.5[/C][C]142.183703468995[/C][C]57.3162965310047[/C][/ROW]
[ROW][C]36[/C][C]218.2[/C][C]183.010734094108[/C][C]35.1892659058921[/C][/ROW]
[ROW][C]37[/C][C]217.5[/C][C]189.684465981295[/C][C]27.8155340187051[/C][/ROW]
[ROW][C]38[/C][C]205[/C][C]129.584035202451[/C][C]75.4159647975486[/C][/ROW]
[ROW][C]39[/C][C]194[/C][C]167.853502852086[/C][C]26.1464971479141[/C][/ROW]
[ROW][C]40[/C][C]199.3[/C][C]149.069483585446[/C][C]50.230516414554[/C][/ROW]
[ROW][C]41[/C][C]219.3[/C][C]157.283074739323[/C][C]62.0169252606768[/C][/ROW]
[ROW][C]42[/C][C]211.1[/C][C]183.180493574167[/C][C]27.9195064258328[/C][/ROW]
[ROW][C]43[/C][C]215.2[/C][C]200.906758330618[/C][C]14.2932416693816[/C][/ROW]
[ROW][C]44[/C][C]240.2[/C][C]171.004168792284[/C][C]69.1958312077158[/C][/ROW]
[ROW][C]45[/C][C]242.2[/C][C]219.205592793810[/C][C]22.9944072061897[/C][/ROW]
[ROW][C]46[/C][C]240.7[/C][C]194.682879262724[/C][C]46.0171207372762[/C][/ROW]
[ROW][C]47[/C][C]255.4[/C][C]180.163270776911[/C][C]75.2367292230887[/C][/ROW]
[ROW][C]48[/C][C]253[/C][C]217.305415359057[/C][C]35.6945846409426[/C][/ROW]
[ROW][C]49[/C][C]218.2[/C][C]206.251393322526[/C][C]11.9486066774744[/C][/ROW]
[ROW][C]50[/C][C]203.7[/C][C]193.982946804682[/C][C]9.71705319531788[/C][/ROW]
[ROW][C]51[/C][C]205.6[/C][C]195.785776837476[/C][C]9.81422316252433[/C][/ROW]
[ROW][C]52[/C][C]215.6[/C][C]163.453159685696[/C][C]52.1468403143042[/C][/ROW]
[ROW][C]53[/C][C]188.5[/C][C]191.746277632507[/C][C]-3.24627763250664[/C][/ROW]
[ROW][C]54[/C][C]202.9[/C][C]191.377813949151[/C][C]11.5221860508494[/C][/ROW]
[ROW][C]55[/C][C]214[/C][C]211.620608240021[/C][C]2.37939175997943[/C][/ROW]
[ROW][C]56[/C][C]230.3[/C][C]192.083530465532[/C][C]38.2164695344683[/C][/ROW]
[ROW][C]57[/C][C]230[/C][C]215.696758305137[/C][C]14.3032416948629[/C][/ROW]
[ROW][C]58[/C][C]241[/C][C]210.238676834551[/C][C]30.7613231654489[/C][/ROW]
[ROW][C]59[/C][C]259.6[/C][C]234.690940610909[/C][C]24.9090593890908[/C][/ROW]
[ROW][C]60[/C][C]247.8[/C][C]221.990136282338[/C][C]25.8098637176621[/C][/ROW]
[ROW][C]61[/C][C]270.3[/C][C]170.286555627356[/C][C]100.013444372644[/C][/ROW]
[/TABLE]
Source: https://freestatistics.org/blog/index.php?pk=4228&T=4

Globally Unique Identifier (entire table): ba.freestatistics.org/blog/index.php?pk=4228&T=4

As an alternative you can also use a QR Code:  

The GUIDs for individual cells are displayed in the table below:

Multiple Linear Regression - Actuals, Interpolation, and Residuals
Time or IndexActualsInterpolationForecastResidualsPrediction Error
199.8103.547166045001-3.74716604500073
296.8126.404714044186-29.6047140441865
38781.0383514398265.96164856017397
496.365.265131703217231.0348682967828
5107.1159.627317682478-52.5273176824784
6115.2134.502136208968-19.3021362089679
7106.1112.758493744607-6.65849374460653
889.5168.498934146955-78.9989341469548
991.3121.523129696033-30.2231296960333
1097.6126.104811621914-28.5048116219141
11100.7192.37122556224-91.67122556224
12104.6159.763181031999-55.1631810319987
1394.7181.326153904137-86.626153904137
14101.8176.925514430869-75.125514430869
15102.5136.577151043227-34.0771510432271
16105.3177.672079120742-72.3720791207415
17110.3115.974489460057-5.67448946005715
18109.8146.886142548590-37.0861425485898
19117.3156.250330264853-38.9503302648535
20118.8158.623927415692-39.8239274156921
21131.3137.243683933065-5.94368393306475
22125.9194.51059267146-68.61059267146
23133.1198.890859580944-65.7908595809442
24147188.530533232498-41.5305332324982
25145.8195.204265119685-49.4042651196853
26164.4144.80278951781119.5972104821890
27149.8157.645217827385-7.84521782738527
28137.7198.740145904900-61.0401459048996
29151.7152.268840485635-0.568840485634559
30156.8139.85341371912416.9465862808756
31180151.06380941990128.9361905800989
32180.4168.98943917953711.4105608204627
33170.4171.530835271955-1.13083527195464
34191.6171.26303960935120.3369603906492
35199.5142.18370346899557.3162965310047
36218.2183.01073409410835.1892659058921
37217.5189.68446598129527.8155340187051
38205129.58403520245175.4159647975486
39194167.85350285208626.1464971479141
40199.3149.06948358544650.230516414554
41219.3157.28307473932362.0169252606768
42211.1183.18049357416727.9195064258328
43215.2200.90675833061814.2932416693816
44240.2171.00416879228469.1958312077158
45242.2219.20559279381022.9944072061897
46240.7194.68287926272446.0171207372762
47255.4180.16327077691175.2367292230887
48253217.30541535905735.6945846409426
49218.2206.25139332252611.9486066774744
50203.7193.9829468046829.71705319531788
51205.6195.7857768374769.81422316252433
52215.6163.45315968569652.1468403143042
53188.5191.746277632507-3.24627763250664
54202.9191.37781394915111.5221860508494
55214211.6206082400212.37939175997943
56230.3192.08353046553238.2164695344683
57230215.69675830513714.3032416948629
58241210.23867683455130.7613231654489
59259.6234.69094061090924.9090593890908
60247.8221.99013628233825.8098637176621
61270.3170.286555627356100.013444372644


Parameters (Session):
par1 = 1 ; par2 = Include Monthly Dummies ; par3 = No Linear Trend ;
Parameters (R input):
par1 = 1 ; par2 = Include Monthly Dummies ; par3 = No Linear Trend ;
R code (references can be found in the software module):
library(lattice)
par1 <- as.numeric(par1)
x <- t(y)
k <- length(x[1,])
n <- length(x[,1])
x1 <- cbind(x[,par1], x[,1:k!=par1])
mycolnames <- c(colnames(x)[par1], colnames(x)[1:k!=par1])
colnames(x1) <- mycolnames #colnames(x)[par1]
x <- x1
if (par3 == 'First Differences'){
x2 <- array(0, dim=c(n-1,k), dimnames=list(1:(n-1), paste('(1-B)',colnames(x),sep='')))
for (i in 1:n-1) {
for (j in 1:k) {
x2[i,j] <- x[i+1,j] - x[i,j]
}
}
x <- x2
}
if (par2 == 'Include Monthly Dummies'){
x2 <- array(0, dim=c(n,11), dimnames=list(1:n, paste('M', seq(1:11), sep ='')))
for (i in 1:11){
x2[seq(i,n,12),i] <- 1
}
x <- cbind(x, x2)
}
if (par2 == 'Include Quarterly Dummies'){
x2 <- array(0, dim=c(n,3), dimnames=list(1:n, paste('Q', seq(1:3), sep ='')))
for (i in 1:3){
x2[seq(i,n,4),i] <- 1
}
x <- cbind(x, x2)
}
k <- length(x[1,])
if (par3 == 'Linear Trend'){
x <- cbind(x, c(1:n))
colnames(x)[k+1] <- 't'
}
x
k <- length(x[1,])
df <- as.data.frame(x)
(mylm <- lm(df))
(mysum <- summary(mylm))
bitmap(file='test0.png')
plot(x[,1], type='l', main='Actuals and Interpolation', ylab='value of Actuals and Interpolation (dots)', xlab='time or index')
points(x[,1]-mysum$resid)
grid()
dev.off()
bitmap(file='test1.png')
plot(mysum$resid, type='b', pch=19, main='Residuals', ylab='value of Residuals', xlab='time or index')
grid()
dev.off()
bitmap(file='test2.png')
hist(mysum$resid, main='Residual Histogram', xlab='values of Residuals')
grid()
dev.off()
bitmap(file='test3.png')
densityplot(~mysum$resid,col='black',main='Residual Density Plot', xlab='values of Residuals')
dev.off()
bitmap(file='test4.png')
qqnorm(mysum$resid, main='Residual Normal Q-Q Plot')
grid()
dev.off()
(myerror <- as.ts(mysum$resid))
bitmap(file='test5.png')
dum <- cbind(lag(myerror,k=1),myerror)
dum
dum1 <- dum[2:length(myerror),]
dum1
z <- as.data.frame(dum1)
z
plot(z,main=paste('Residual Lag plot, lowess, and regression line'), ylab='values of Residuals', xlab='lagged values of Residuals')
lines(lowess(z))
abline(lm(z))
grid()
dev.off()
bitmap(file='test6.png')
acf(mysum$resid, lag.max=length(mysum$resid)/2, main='Residual Autocorrelation Function')
grid()
dev.off()
bitmap(file='test7.png')
pacf(mysum$resid, lag.max=length(mysum$resid)/2, main='Residual Partial Autocorrelation Function')
grid()
dev.off()
bitmap(file='test8.png')
opar <- par(mfrow = c(2,2), oma = c(0, 0, 1.1, 0))
plot(mylm, las = 1, sub='Residual Diagnostics')
par(opar)
dev.off()
load(file='createtable')
a<-table.start()
a<-table.row.start(a)
a<-table.element(a, 'Multiple Linear Regression - Estimated Regression Equation', 1, TRUE)
a<-table.row.end(a)
myeq <- colnames(x)[1]
myeq <- paste(myeq, '[t] = ', sep='')
for (i in 1:k){
if (mysum$coefficients[i,1] > 0) myeq <- paste(myeq, '+', '')
myeq <- paste(myeq, mysum$coefficients[i,1], sep=' ')
if (rownames(mysum$coefficients)[i] != '(Intercept)') {
myeq <- paste(myeq, rownames(mysum$coefficients)[i], sep='')
if (rownames(mysum$coefficients)[i] != 't') myeq <- paste(myeq, '[t]', sep='')
}
}
myeq <- paste(myeq, ' + e[t]')
a<-table.row.start(a)
a<-table.element(a, myeq)
a<-table.row.end(a)
a<-table.end(a)
table.save(a,file='mytable1.tab')
a<-table.start()
a<-table.row.start(a)
a<-table.element(a,hyperlink('ols1.htm','Multiple Linear Regression - Ordinary Least Squares',''), 6, TRUE)
a<-table.row.end(a)
a<-table.row.start(a)
a<-table.element(a,'Variable',header=TRUE)
a<-table.element(a,'Parameter',header=TRUE)
a<-table.element(a,'S.D.',header=TRUE)
a<-table.element(a,'T-STAT
H0: parameter = 0',header=TRUE)
a<-table.element(a,'2-tail p-value',header=TRUE)
a<-table.element(a,'1-tail p-value',header=TRUE)
a<-table.row.end(a)
for (i in 1:k){
a<-table.row.start(a)
a<-table.element(a,rownames(mysum$coefficients)[i],header=TRUE)
a<-table.element(a,mysum$coefficients[i,1])
a<-table.element(a, round(mysum$coefficients[i,2],6))
a<-table.element(a, round(mysum$coefficients[i,3],4))
a<-table.element(a, round(mysum$coefficients[i,4],6))
a<-table.element(a, round(mysum$coefficients[i,4]/2,6))
a<-table.row.end(a)
}
a<-table.end(a)
table.save(a,file='mytable2.tab')
a<-table.start()
a<-table.row.start(a)
a<-table.element(a, 'Multiple Linear Regression - Regression Statistics', 2, TRUE)
a<-table.row.end(a)
a<-table.row.start(a)
a<-table.element(a, 'Multiple R',1,TRUE)
a<-table.element(a, sqrt(mysum$r.squared))
a<-table.row.end(a)
a<-table.row.start(a)
a<-table.element(a, 'R-squared',1,TRUE)
a<-table.element(a, mysum$r.squared)
a<-table.row.end(a)
a<-table.row.start(a)
a<-table.element(a, 'Adjusted R-squared',1,TRUE)
a<-table.element(a, mysum$adj.r.squared)
a<-table.row.end(a)
a<-table.row.start(a)
a<-table.element(a, 'F-TEST (value)',1,TRUE)
a<-table.element(a, mysum$fstatistic[1])
a<-table.row.end(a)
a<-table.row.start(a)
a<-table.element(a, 'F-TEST (DF numerator)',1,TRUE)
a<-table.element(a, mysum$fstatistic[2])
a<-table.row.end(a)
a<-table.row.start(a)
a<-table.element(a, 'F-TEST (DF denominator)',1,TRUE)
a<-table.element(a, mysum$fstatistic[3])
a<-table.row.end(a)
a<-table.row.start(a)
a<-table.element(a, 'p-value',1,TRUE)
a<-table.element(a, 1-pf(mysum$fstatistic[1],mysum$fstatistic[2],mysum$fstatistic[3]))
a<-table.row.end(a)
a<-table.row.start(a)
a<-table.element(a, 'Multiple Linear Regression - Residual Statistics', 2, TRUE)
a<-table.row.end(a)
a<-table.row.start(a)
a<-table.element(a, 'Residual Standard Deviation',1,TRUE)
a<-table.element(a, mysum$sigma)
a<-table.row.end(a)
a<-table.row.start(a)
a<-table.element(a, 'Sum Squared Residuals',1,TRUE)
a<-table.element(a, sum(myerror*myerror))
a<-table.row.end(a)
a<-table.end(a)
table.save(a,file='mytable3.tab')
a<-table.start()
a<-table.row.start(a)
a<-table.element(a, 'Multiple Linear Regression - Actuals, Interpolation, and Residuals', 4, TRUE)
a<-table.row.end(a)
a<-table.row.start(a)
a<-table.element(a, 'Time or Index', 1, TRUE)
a<-table.element(a, 'Actuals', 1, TRUE)
a<-table.element(a, 'Interpolation
Forecast', 1, TRUE)
a<-table.element(a, 'Residuals
Prediction Error', 1, TRUE)
a<-table.row.end(a)
for (i in 1:n) {
a<-table.row.start(a)
a<-table.element(a,i, 1, TRUE)
a<-table.element(a,x[i])
a<-table.element(a,x[i]-mysum$resid[i])
a<-table.element(a,mysum$resid[i])
a<-table.row.end(a)
}
a<-table.end(a)
table.save(a,file='mytable4.tab')