Free Statistics

of Irreproducible Research!

Author's title

Author*Unverified author*
R Software Modulerwasp_multipleregression.wasp
Title produced by softwareMultiple Regression
Date of computationSat, 15 Dec 2007 15:45:06 -0700
Cite this page as followsStatistical Computations at FreeStatistics.org, Office for Research Development and Education, URL https://freestatistics.org/blog/index.php?v=date/2007/Dec/15/t1197758034etvzemokz475bzu.htm/, Retrieved Fri, 03 May 2024 02:45:23 +0000
Statistical Computations at FreeStatistics.org, Office for Research Development and Education, URL https://freestatistics.org/blog/index.php?pk=14383, Retrieved Fri, 03 May 2024 02:45:23 +0000
QR Codes:

Original text written by user:
IsPrivate?No (this computation is public)
User-defined keywords
Estimated Impact191
Family? (F = Feedback message, R = changed R code, M = changed R Module, P = changed Parameters, D = changed Data)
-       [Multiple Regression] [] [2007-12-15 22:45:06] [14a24f40f593a2435c566261e270069c] [Current]
Feedback Forum

Post a new message
Dataseries X:
85.6	92.81	88	75.6
89	59.04	88.4	48.7
97.5	72.81	95	111.7
104	91.81	101.8	119.5
99.4	68.07	107.6	103.4
103.2	49.16	118.9	96.3
103	124.61	126.9	96.6
91.2	109.89	106.3	110.4
85.9	110.51	109.2	104.4
80.7	114.77	104.6	110.7
86.7	92.37	100.8	93.6
80.7	103.63	92.1	114.8
81.5	90.43	86.4	74.9
83.4	65.86	96	69.8
83.5	83.33	98.5	104.2
89.5	94.49	112	109.3
85.8	68.98	113.9	92.7
77.4	55.46	120	91.7
67.5	132.89	126.7	84.4
63.7	121.71	112.8	94.5
59.4	127.01	116.2	103.6
62	134.04	110.6	105.9
62.4	106.48	105	108
58.1	117.55	101.2	119.9
58	101.61	99.3	84.5
56.3	82.66	101.9	76.7
61.4	89.28	106.4	120.5
59.8	109.24	118.9	119.6
54.3	88.16	121.9	102.3
47	59.23	132	101.7
50.5	164.21	121.4	86.9
48.1	125.13	117	93.6
58.8	152.68	122.7	113.6
70.4	132.96	113	106.7
71.9	112.42	104	96.1
73.3	136.43	101.2	124.6
83.5	107.32	100.8	72.5
90.1	87.61	98.9	89
101.3	97.86	103	115.3
98.3	106.60	117.8	119.1
106.7	92.17	126.6	104.4
109.9	65.31	127.6	104.9
111.1	161.49	115.8	76.9
119	162.25	114.8	95.3
120.7	175.13	119.2	114.9
104.5	147.28	109.9	98.9
121.6	144.48	98.9	102.9
129.6	122.67	98.6	90
124.5	102.27	96.6	81
130.1	88.64	96.7	66.2
142.3	89.59	103.5	86.7
140	112.20	115.3	86.7
143.3	91.98	122.5	103.4
113.4	57.85	125.3	89.5
113.8	160.49	111.2	113.7
120.7	128.33	110.7	120.2
112.9	140.69	114.2	137.8
115.5	126.61	105.6	99.1
121.9	129.27	95.5	110.4
119.3	124.27	97.3	112.3
111	112.90	95.5	82.2
114.2	92.54	96.3	72.2
113.5	85.70	100.2	106.7
94	116.72	113.4	106.4
83.2	92.08	121.4	110
82.8	58.98	122.1	87.5
85.8	154.50	119.3	79.7
88.7	145.55	110.8	83.3
105.3	146.60	110.1	91.8
113.1	143.51	99.7	89.2
113.8	113.52	104.8	90.6
109.4	104.80	105.4	92.6


Summary of compuational transaction
Raw Inputview raw input (R code)
Raw Outputview raw output of R engine
Computing time3 seconds
R Server'Gwilym Jenkins' @ 72.249.127.135

\begin{tabular}{lllllllll}
\hline
Summary of compuational transaction \tabularnewline
Raw Input & view raw input (R code)  \tabularnewline
Raw Output & view raw output of R engine  \tabularnewline
Computing time & 3 seconds \tabularnewline
R Server & 'Gwilym Jenkins' @ 72.249.127.135 \tabularnewline
\hline
\end{tabular}
%Source: https://freestatistics.org/blog/index.php?pk=14383&T=0

[TABLE]
[ROW][C]Summary of compuational transaction[/C][/ROW]
[ROW][C]Raw Input[/C][C]view raw input (R code) [/C][/ROW]
[ROW][C]Raw Output[/C][C]view raw output of R engine [/C][/ROW]
[ROW][C]Computing time[/C][C]3 seconds[/C][/ROW]
[ROW][C]R Server[/C][C]'Gwilym Jenkins' @ 72.249.127.135[/C][/ROW]
[/TABLE]
Source: https://freestatistics.org/blog/index.php?pk=14383&T=0

Globally Unique Identifier (entire table): ba.freestatistics.org/blog/index.php?pk=14383&T=0

As an alternative you can also use a QR Code:  

The GUIDs for individual cells are displayed in the table below:

Summary of compuational transaction
Raw Inputview raw input (R code)
Raw Outputview raw output of R engine
Computing time3 seconds
R Server'Gwilym Jenkins' @ 72.249.127.135


Multiple Linear Regression - Estimated Regression Equation
olie[t] = + 266.990447890280 + 0.0738268262780373auto[t] -1.94100985624765electric[t] -0.140847432036701vervoer[t] -9.69338508432732M1[t] -2.94497280317953M2[t] + 16.3592288303806M3[t] + 35.8549981526060M4[t] + 44.8296305047298M5[t] + 48.893937994268M6[t] + 32.3703754437297M7[t] + 18.5310130663871M8[t] + 26.9018041142079M9[t] + 10.5413368531085M10[t] + 5.13864638469737M11[t] + 0.653509189796642t + e[t]

\begin{tabular}{lllllllll}
\hline
Multiple Linear Regression - Estimated Regression Equation \tabularnewline
olie[t] =  +  266.990447890280 +  0.0738268262780373auto[t] -1.94100985624765electric[t] -0.140847432036701vervoer[t] -9.69338508432732M1[t] -2.94497280317953M2[t] +  16.3592288303806M3[t] +  35.8549981526060M4[t] +  44.8296305047298M5[t] +  48.893937994268M6[t] +  32.3703754437297M7[t] +  18.5310130663871M8[t] +  26.9018041142079M9[t] +  10.5413368531085M10[t] +  5.13864638469737M11[t] +  0.653509189796642t  + e[t] \tabularnewline
\hline
\end{tabular}
%Source: https://freestatistics.org/blog/index.php?pk=14383&T=1

[TABLE]
[ROW][C]Multiple Linear Regression - Estimated Regression Equation[/C][/ROW]
[ROW][C]olie[t] =  +  266.990447890280 +  0.0738268262780373auto[t] -1.94100985624765electric[t] -0.140847432036701vervoer[t] -9.69338508432732M1[t] -2.94497280317953M2[t] +  16.3592288303806M3[t] +  35.8549981526060M4[t] +  44.8296305047298M5[t] +  48.893937994268M6[t] +  32.3703754437297M7[t] +  18.5310130663871M8[t] +  26.9018041142079M9[t] +  10.5413368531085M10[t] +  5.13864638469737M11[t] +  0.653509189796642t  + e[t][/C][/ROW]
[/TABLE]
Source: https://freestatistics.org/blog/index.php?pk=14383&T=1

Globally Unique Identifier (entire table): ba.freestatistics.org/blog/index.php?pk=14383&T=1

As an alternative you can also use a QR Code:  

The GUIDs for individual cells are displayed in the table below:

Multiple Linear Regression - Estimated Regression Equation
olie[t] = + 266.990447890280 + 0.0738268262780373auto[t] -1.94100985624765electric[t] -0.140847432036701vervoer[t] -9.69338508432732M1[t] -2.94497280317953M2[t] + 16.3592288303806M3[t] + 35.8549981526060M4[t] + 44.8296305047298M5[t] + 48.893937994268M6[t] + 32.3703754437297M7[t] + 18.5310130663871M8[t] + 26.9018041142079M9[t] + 10.5413368531085M10[t] + 5.13864638469737M11[t] + 0.653509189796642t + e[t]


Multiple Linear Regression - Ordinary Least Squares
VariableParameterS.D.T-STATH0: parameter = 02-tail p-value1-tail p-value
(Intercept)266.99044789028059.3743464.49673.5e-051.8e-05
auto0.07382682627803730.2629540.28080.779930.389965
electric-1.941009856247650.55603-3.49080.0009470.000473
vervoer-0.1408474320367010.254161-0.55420.5816720.290836
M1-9.6933850843273214.705934-0.65910.5125020.256251
M2-2.9449728031795317.124992-0.1720.8640820.432041
M316.359228830380614.5079541.12760.2642950.132148
M435.854998152606015.1172732.37180.0211650.010582
M544.829630504729819.4030662.31040.0245720.012286
M648.89393799426825.5325011.9150.0606090.030305
M732.370375443729719.6190871.64990.1045530.052277
M818.531013066387114.9268311.24150.2196120.109806
M926.901804114207915.9170391.69010.0965640.048282
M1010.541336853108513.7769770.76510.44740.2237
M115.1386463846973712.554530.40930.6838760.341938
t0.6535091897966420.1629064.01160.0001819e-05

\begin{tabular}{lllllllll}
\hline
Multiple Linear Regression - Ordinary Least Squares \tabularnewline
Variable & Parameter & S.D. & T-STATH0: parameter = 0 & 2-tail p-value & 1-tail p-value \tabularnewline
(Intercept) & 266.990447890280 & 59.374346 & 4.4967 & 3.5e-05 & 1.8e-05 \tabularnewline
auto & 0.0738268262780373 & 0.262954 & 0.2808 & 0.77993 & 0.389965 \tabularnewline
electric & -1.94100985624765 & 0.55603 & -3.4908 & 0.000947 & 0.000473 \tabularnewline
vervoer & -0.140847432036701 & 0.254161 & -0.5542 & 0.581672 & 0.290836 \tabularnewline
M1 & -9.69338508432732 & 14.705934 & -0.6591 & 0.512502 & 0.256251 \tabularnewline
M2 & -2.94497280317953 & 17.124992 & -0.172 & 0.864082 & 0.432041 \tabularnewline
M3 & 16.3592288303806 & 14.507954 & 1.1276 & 0.264295 & 0.132148 \tabularnewline
M4 & 35.8549981526060 & 15.117273 & 2.3718 & 0.021165 & 0.010582 \tabularnewline
M5 & 44.8296305047298 & 19.403066 & 2.3104 & 0.024572 & 0.012286 \tabularnewline
M6 & 48.893937994268 & 25.532501 & 1.915 & 0.060609 & 0.030305 \tabularnewline
M7 & 32.3703754437297 & 19.619087 & 1.6499 & 0.104553 & 0.052277 \tabularnewline
M8 & 18.5310130663871 & 14.926831 & 1.2415 & 0.219612 & 0.109806 \tabularnewline
M9 & 26.9018041142079 & 15.917039 & 1.6901 & 0.096564 & 0.048282 \tabularnewline
M10 & 10.5413368531085 & 13.776977 & 0.7651 & 0.4474 & 0.2237 \tabularnewline
M11 & 5.13864638469737 & 12.55453 & 0.4093 & 0.683876 & 0.341938 \tabularnewline
t & 0.653509189796642 & 0.162906 & 4.0116 & 0.000181 & 9e-05 \tabularnewline
\hline
\end{tabular}
%Source: https://freestatistics.org/blog/index.php?pk=14383&T=2

[TABLE]
[ROW][C]Multiple Linear Regression - Ordinary Least Squares[/C][/ROW]
[ROW][C]Variable[/C][C]Parameter[/C][C]S.D.[/C][C]T-STATH0: parameter = 0[/C][C]2-tail p-value[/C][C]1-tail p-value[/C][/ROW]
[ROW][C](Intercept)[/C][C]266.990447890280[/C][C]59.374346[/C][C]4.4967[/C][C]3.5e-05[/C][C]1.8e-05[/C][/ROW]
[ROW][C]auto[/C][C]0.0738268262780373[/C][C]0.262954[/C][C]0.2808[/C][C]0.77993[/C][C]0.389965[/C][/ROW]
[ROW][C]electric[/C][C]-1.94100985624765[/C][C]0.55603[/C][C]-3.4908[/C][C]0.000947[/C][C]0.000473[/C][/ROW]
[ROW][C]vervoer[/C][C]-0.140847432036701[/C][C]0.254161[/C][C]-0.5542[/C][C]0.581672[/C][C]0.290836[/C][/ROW]
[ROW][C]M1[/C][C]-9.69338508432732[/C][C]14.705934[/C][C]-0.6591[/C][C]0.512502[/C][C]0.256251[/C][/ROW]
[ROW][C]M2[/C][C]-2.94497280317953[/C][C]17.124992[/C][C]-0.172[/C][C]0.864082[/C][C]0.432041[/C][/ROW]
[ROW][C]M3[/C][C]16.3592288303806[/C][C]14.507954[/C][C]1.1276[/C][C]0.264295[/C][C]0.132148[/C][/ROW]
[ROW][C]M4[/C][C]35.8549981526060[/C][C]15.117273[/C][C]2.3718[/C][C]0.021165[/C][C]0.010582[/C][/ROW]
[ROW][C]M5[/C][C]44.8296305047298[/C][C]19.403066[/C][C]2.3104[/C][C]0.024572[/C][C]0.012286[/C][/ROW]
[ROW][C]M6[/C][C]48.893937994268[/C][C]25.532501[/C][C]1.915[/C][C]0.060609[/C][C]0.030305[/C][/ROW]
[ROW][C]M7[/C][C]32.3703754437297[/C][C]19.619087[/C][C]1.6499[/C][C]0.104553[/C][C]0.052277[/C][/ROW]
[ROW][C]M8[/C][C]18.5310130663871[/C][C]14.926831[/C][C]1.2415[/C][C]0.219612[/C][C]0.109806[/C][/ROW]
[ROW][C]M9[/C][C]26.9018041142079[/C][C]15.917039[/C][C]1.6901[/C][C]0.096564[/C][C]0.048282[/C][/ROW]
[ROW][C]M10[/C][C]10.5413368531085[/C][C]13.776977[/C][C]0.7651[/C][C]0.4474[/C][C]0.2237[/C][/ROW]
[ROW][C]M11[/C][C]5.13864638469737[/C][C]12.55453[/C][C]0.4093[/C][C]0.683876[/C][C]0.341938[/C][/ROW]
[ROW][C]t[/C][C]0.653509189796642[/C][C]0.162906[/C][C]4.0116[/C][C]0.000181[/C][C]9e-05[/C][/ROW]
[/TABLE]
Source: https://freestatistics.org/blog/index.php?pk=14383&T=2

Globally Unique Identifier (entire table): ba.freestatistics.org/blog/index.php?pk=14383&T=2

As an alternative you can also use a QR Code:  

The GUIDs for individual cells are displayed in the table below:

Multiple Linear Regression - Ordinary Least Squares
VariableParameterS.D.T-STATH0: parameter = 02-tail p-value1-tail p-value
(Intercept)266.99044789028059.3743464.49673.5e-051.8e-05
auto0.07382682627803730.2629540.28080.779930.389965
electric-1.941009856247650.55603-3.49080.0009470.000473
vervoer-0.1408474320367010.254161-0.55420.5816720.290836
M1-9.6933850843273214.705934-0.65910.5125020.256251
M2-2.9449728031795317.124992-0.1720.8640820.432041
M316.359228830380614.5079541.12760.2642950.132148
M435.854998152606015.1172732.37180.0211650.010582
M544.829630504729819.4030662.31040.0245720.012286
M648.89393799426825.5325011.9150.0606090.030305
M732.370375443729719.6190871.64990.1045530.052277
M818.531013066387114.9268311.24150.2196120.109806
M926.901804114207915.9170391.69010.0965640.048282
M1010.541336853108513.7769770.76510.44740.2237
M115.1386463846973712.554530.40930.6838760.341938
t0.6535091897966420.1629064.01160.0001819e-05


Multiple Linear Regression - Regression Statistics
Multiple R0.640211545029573
R-squared0.409870822389154
Adjusted R-squared0.251800506957677
F-TEST (value)2.59296517040755
F-TEST (DF numerator)15
F-TEST (DF denominator)56
p-value0.00510596940206898
Multiple Linear Regression - Residual Statistics
Residual Standard Deviation21.2585706020548
Sum Squared Residuals25307.9021463827

\begin{tabular}{lllllllll}
\hline
Multiple Linear Regression - Regression Statistics \tabularnewline
Multiple R & 0.640211545029573 \tabularnewline
R-squared & 0.409870822389154 \tabularnewline
Adjusted R-squared & 0.251800506957677 \tabularnewline
F-TEST (value) & 2.59296517040755 \tabularnewline
F-TEST (DF numerator) & 15 \tabularnewline
F-TEST (DF denominator) & 56 \tabularnewline
p-value & 0.00510596940206898 \tabularnewline
Multiple Linear Regression - Residual Statistics \tabularnewline
Residual Standard Deviation & 21.2585706020548 \tabularnewline
Sum Squared Residuals & 25307.9021463827 \tabularnewline
\hline
\end{tabular}
%Source: https://freestatistics.org/blog/index.php?pk=14383&T=3

[TABLE]
[ROW][C]Multiple Linear Regression - Regression Statistics[/C][/ROW]
[ROW][C]Multiple R[/C][C]0.640211545029573[/C][/ROW]
[ROW][C]R-squared[/C][C]0.409870822389154[/C][/ROW]
[ROW][C]Adjusted R-squared[/C][C]0.251800506957677[/C][/ROW]
[ROW][C]F-TEST (value)[/C][C]2.59296517040755[/C][/ROW]
[ROW][C]F-TEST (DF numerator)[/C][C]15[/C][/ROW]
[ROW][C]F-TEST (DF denominator)[/C][C]56[/C][/ROW]
[ROW][C]p-value[/C][C]0.00510596940206898[/C][/ROW]
[ROW][C]Multiple Linear Regression - Residual Statistics[/C][/ROW]
[ROW][C]Residual Standard Deviation[/C][C]21.2585706020548[/C][/ROW]
[ROW][C]Sum Squared Residuals[/C][C]25307.9021463827[/C][/ROW]
[/TABLE]
Source: https://freestatistics.org/blog/index.php?pk=14383&T=3

Globally Unique Identifier (entire table): ba.freestatistics.org/blog/index.php?pk=14383&T=3

As an alternative you can also use a QR Code:  

The GUIDs for individual cells are displayed in the table below:

Multiple Linear Regression - Regression Statistics
Multiple R0.640211545029573
R-squared0.409870822389154
Adjusted R-squared0.251800506957677
F-TEST (value)2.59296517040755
F-TEST (DF numerator)15
F-TEST (DF denominator)56
p-value0.00510596940206898
Multiple Linear Regression - Residual Statistics
Residual Standard Deviation21.2585706020548
Sum Squared Residuals25307.9021463827


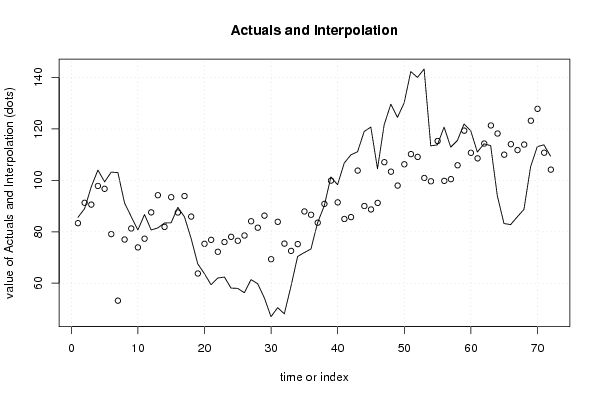
Multiple Linear Regression - Actuals, Interpolation, and Residuals
Time or IndexActualsInterpolationForecastResidualsPrediction Error
185.683.34550653084512.25449346915486
28991.2666880576695-2.26668805766948
397.590.55694100932826.9430589906718
410497.81145222826266.18854777173742
599.496.6967314038972.70326859610300
6103.279.085088190176224.1149118098238
710353.214935792520249.7850642074798
891.276.983460198756814.2165398012432
985.981.26968907776854.63031092223150
1080.773.91853980331826.78146019668178
1186.777.29996615764449.4000338423556
1280.787.546939216811-6.84693921681092
1381.594.2161179342861-12.7161179342861
1483.481.88874156698891.51125843301116
1583.593.4385307427412-9.93853074274125
1689.587.48976167329572.01023832670432
1785.893.8847295218022-8.0847295218022
1877.485.905094818784-8.50509481878397
1967.563.77487283375933.72512716624068
2063.775.3211136666966-11.6211136666966
2159.476.8555509408117-17.4555509408117
226272.213301559546-10.2133015595460
2362.476.0033285364186-13.6033285364185
2458.178.03520732092-19.9352073209200
255876.4924496364872-18.4924496364872
2656.378.5473370931052-22.2473370931052
2761.484.0901196301006-22.6901196301006
2859.881.5771210803696-21.7771210803696
2954.386.2626241298411-31.9626241298411
304769.324939636073-22.3249396360730
3150.583.864472968368-33.364472968368
3248.175.3902329827201-27.2902329827201
3358.872.5677574629518-13.7677574629518
3470.475.2045772641017-4.80457726410166
3571.987.9010644595542-16.0010644595542
3673.386.6091851480366-13.3091851480366
3783.583.5347654921634-0.0347654921634399
3890.190.8454963154327-0.745496315432724
39101.399.89750423495881.40249576504123
4098.391.4298630944466.87013690555391
41106.784.982254049134721.7177459508653
42109.985.705648602375424.1943513976246
43111.1103.7839037938057.3160962061947
4411990.00357610100328.996423898997
45120.788.677712825672632.0222871743274
46104.591.219628218216913.2803717817831
47121.6107.05145051660114.5485494833988
48129.6103.35538507072426.2446149292757
49124.597.959088520947226.5409114790528
50130.1106.24519135824023.8548086417596
51142.3110.18679828732532.1132017126751
52140109.10138503777130.8986149622290
53143.3100.90932507235442.3906749276463
54113.499.630383878635813.7696161213642
55113.8115.297647084876-1.49764708487557
56120.799.792519784113220.9074802158868
57112.9100.45687029381412.4431297061856
58115.5105.8539108920679.64608910793288
59121.9119.3137325374392.58626746256124
60119.3110.6980333490328.60196665096763
61111108.5520718852712.44792811472914
62114.2114.306545608563-0.106545608563337
63113.5121.330106095546-7.83010609554628
6494118.190416885855-24.190416885855
6583.2109.964335822971-26.7643358229713
6682.8114.048844873956-31.2488448739556
6785.8111.764167526672-25.9641675266717
6888.7113.909097266710-25.2090972667102
69105.3123.172419398981-17.872419398981
70113.1127.79004226275-14.6900422627501
71113.8110.7304577923433.06954220765711
72109.4104.1552498944765.24475010552434

\begin{tabular}{lllllllll}
\hline
Multiple Linear Regression - Actuals, Interpolation, and Residuals \tabularnewline
Time or Index & Actuals & InterpolationForecast & ResidualsPrediction Error \tabularnewline
1 & 85.6 & 83.3455065308451 & 2.25449346915486 \tabularnewline
2 & 89 & 91.2666880576695 & -2.26668805766948 \tabularnewline
3 & 97.5 & 90.5569410093282 & 6.9430589906718 \tabularnewline
4 & 104 & 97.8114522282626 & 6.18854777173742 \tabularnewline
5 & 99.4 & 96.696731403897 & 2.70326859610300 \tabularnewline
6 & 103.2 & 79.0850881901762 & 24.1149118098238 \tabularnewline
7 & 103 & 53.2149357925202 & 49.7850642074798 \tabularnewline
8 & 91.2 & 76.9834601987568 & 14.2165398012432 \tabularnewline
9 & 85.9 & 81.2696890777685 & 4.63031092223150 \tabularnewline
10 & 80.7 & 73.9185398033182 & 6.78146019668178 \tabularnewline
11 & 86.7 & 77.2999661576444 & 9.4000338423556 \tabularnewline
12 & 80.7 & 87.546939216811 & -6.84693921681092 \tabularnewline
13 & 81.5 & 94.2161179342861 & -12.7161179342861 \tabularnewline
14 & 83.4 & 81.8887415669889 & 1.51125843301116 \tabularnewline
15 & 83.5 & 93.4385307427412 & -9.93853074274125 \tabularnewline
16 & 89.5 & 87.4897616732957 & 2.01023832670432 \tabularnewline
17 & 85.8 & 93.8847295218022 & -8.0847295218022 \tabularnewline
18 & 77.4 & 85.905094818784 & -8.50509481878397 \tabularnewline
19 & 67.5 & 63.7748728337593 & 3.72512716624068 \tabularnewline
20 & 63.7 & 75.3211136666966 & -11.6211136666966 \tabularnewline
21 & 59.4 & 76.8555509408117 & -17.4555509408117 \tabularnewline
22 & 62 & 72.213301559546 & -10.2133015595460 \tabularnewline
23 & 62.4 & 76.0033285364186 & -13.6033285364185 \tabularnewline
24 & 58.1 & 78.03520732092 & -19.9352073209200 \tabularnewline
25 & 58 & 76.4924496364872 & -18.4924496364872 \tabularnewline
26 & 56.3 & 78.5473370931052 & -22.2473370931052 \tabularnewline
27 & 61.4 & 84.0901196301006 & -22.6901196301006 \tabularnewline
28 & 59.8 & 81.5771210803696 & -21.7771210803696 \tabularnewline
29 & 54.3 & 86.2626241298411 & -31.9626241298411 \tabularnewline
30 & 47 & 69.324939636073 & -22.3249396360730 \tabularnewline
31 & 50.5 & 83.864472968368 & -33.364472968368 \tabularnewline
32 & 48.1 & 75.3902329827201 & -27.2902329827201 \tabularnewline
33 & 58.8 & 72.5677574629518 & -13.7677574629518 \tabularnewline
34 & 70.4 & 75.2045772641017 & -4.80457726410166 \tabularnewline
35 & 71.9 & 87.9010644595542 & -16.0010644595542 \tabularnewline
36 & 73.3 & 86.6091851480366 & -13.3091851480366 \tabularnewline
37 & 83.5 & 83.5347654921634 & -0.0347654921634399 \tabularnewline
38 & 90.1 & 90.8454963154327 & -0.745496315432724 \tabularnewline
39 & 101.3 & 99.8975042349588 & 1.40249576504123 \tabularnewline
40 & 98.3 & 91.429863094446 & 6.87013690555391 \tabularnewline
41 & 106.7 & 84.9822540491347 & 21.7177459508653 \tabularnewline
42 & 109.9 & 85.7056486023754 & 24.1943513976246 \tabularnewline
43 & 111.1 & 103.783903793805 & 7.3160962061947 \tabularnewline
44 & 119 & 90.003576101003 & 28.996423898997 \tabularnewline
45 & 120.7 & 88.6777128256726 & 32.0222871743274 \tabularnewline
46 & 104.5 & 91.2196282182169 & 13.2803717817831 \tabularnewline
47 & 121.6 & 107.051450516601 & 14.5485494833988 \tabularnewline
48 & 129.6 & 103.355385070724 & 26.2446149292757 \tabularnewline
49 & 124.5 & 97.9590885209472 & 26.5409114790528 \tabularnewline
50 & 130.1 & 106.245191358240 & 23.8548086417596 \tabularnewline
51 & 142.3 & 110.186798287325 & 32.1132017126751 \tabularnewline
52 & 140 & 109.101385037771 & 30.8986149622290 \tabularnewline
53 & 143.3 & 100.909325072354 & 42.3906749276463 \tabularnewline
54 & 113.4 & 99.6303838786358 & 13.7696161213642 \tabularnewline
55 & 113.8 & 115.297647084876 & -1.49764708487557 \tabularnewline
56 & 120.7 & 99.7925197841132 & 20.9074802158868 \tabularnewline
57 & 112.9 & 100.456870293814 & 12.4431297061856 \tabularnewline
58 & 115.5 & 105.853910892067 & 9.64608910793288 \tabularnewline
59 & 121.9 & 119.313732537439 & 2.58626746256124 \tabularnewline
60 & 119.3 & 110.698033349032 & 8.60196665096763 \tabularnewline
61 & 111 & 108.552071885271 & 2.44792811472914 \tabularnewline
62 & 114.2 & 114.306545608563 & -0.106545608563337 \tabularnewline
63 & 113.5 & 121.330106095546 & -7.83010609554628 \tabularnewline
64 & 94 & 118.190416885855 & -24.190416885855 \tabularnewline
65 & 83.2 & 109.964335822971 & -26.7643358229713 \tabularnewline
66 & 82.8 & 114.048844873956 & -31.2488448739556 \tabularnewline
67 & 85.8 & 111.764167526672 & -25.9641675266717 \tabularnewline
68 & 88.7 & 113.909097266710 & -25.2090972667102 \tabularnewline
69 & 105.3 & 123.172419398981 & -17.872419398981 \tabularnewline
70 & 113.1 & 127.79004226275 & -14.6900422627501 \tabularnewline
71 & 113.8 & 110.730457792343 & 3.06954220765711 \tabularnewline
72 & 109.4 & 104.155249894476 & 5.24475010552434 \tabularnewline
\hline
\end{tabular}
%Source: https://freestatistics.org/blog/index.php?pk=14383&T=4

[TABLE]
[ROW][C]Multiple Linear Regression - Actuals, Interpolation, and Residuals[/C][/ROW]
[ROW][C]Time or Index[/C][C]Actuals[/C][C]InterpolationForecast[/C][C]ResidualsPrediction Error[/C][/ROW]
[ROW][C]1[/C][C]85.6[/C][C]83.3455065308451[/C][C]2.25449346915486[/C][/ROW]
[ROW][C]2[/C][C]89[/C][C]91.2666880576695[/C][C]-2.26668805766948[/C][/ROW]
[ROW][C]3[/C][C]97.5[/C][C]90.5569410093282[/C][C]6.9430589906718[/C][/ROW]
[ROW][C]4[/C][C]104[/C][C]97.8114522282626[/C][C]6.18854777173742[/C][/ROW]
[ROW][C]5[/C][C]99.4[/C][C]96.696731403897[/C][C]2.70326859610300[/C][/ROW]
[ROW][C]6[/C][C]103.2[/C][C]79.0850881901762[/C][C]24.1149118098238[/C][/ROW]
[ROW][C]7[/C][C]103[/C][C]53.2149357925202[/C][C]49.7850642074798[/C][/ROW]
[ROW][C]8[/C][C]91.2[/C][C]76.9834601987568[/C][C]14.2165398012432[/C][/ROW]
[ROW][C]9[/C][C]85.9[/C][C]81.2696890777685[/C][C]4.63031092223150[/C][/ROW]
[ROW][C]10[/C][C]80.7[/C][C]73.9185398033182[/C][C]6.78146019668178[/C][/ROW]
[ROW][C]11[/C][C]86.7[/C][C]77.2999661576444[/C][C]9.4000338423556[/C][/ROW]
[ROW][C]12[/C][C]80.7[/C][C]87.546939216811[/C][C]-6.84693921681092[/C][/ROW]
[ROW][C]13[/C][C]81.5[/C][C]94.2161179342861[/C][C]-12.7161179342861[/C][/ROW]
[ROW][C]14[/C][C]83.4[/C][C]81.8887415669889[/C][C]1.51125843301116[/C][/ROW]
[ROW][C]15[/C][C]83.5[/C][C]93.4385307427412[/C][C]-9.93853074274125[/C][/ROW]
[ROW][C]16[/C][C]89.5[/C][C]87.4897616732957[/C][C]2.01023832670432[/C][/ROW]
[ROW][C]17[/C][C]85.8[/C][C]93.8847295218022[/C][C]-8.0847295218022[/C][/ROW]
[ROW][C]18[/C][C]77.4[/C][C]85.905094818784[/C][C]-8.50509481878397[/C][/ROW]
[ROW][C]19[/C][C]67.5[/C][C]63.7748728337593[/C][C]3.72512716624068[/C][/ROW]
[ROW][C]20[/C][C]63.7[/C][C]75.3211136666966[/C][C]-11.6211136666966[/C][/ROW]
[ROW][C]21[/C][C]59.4[/C][C]76.8555509408117[/C][C]-17.4555509408117[/C][/ROW]
[ROW][C]22[/C][C]62[/C][C]72.213301559546[/C][C]-10.2133015595460[/C][/ROW]
[ROW][C]23[/C][C]62.4[/C][C]76.0033285364186[/C][C]-13.6033285364185[/C][/ROW]
[ROW][C]24[/C][C]58.1[/C][C]78.03520732092[/C][C]-19.9352073209200[/C][/ROW]
[ROW][C]25[/C][C]58[/C][C]76.4924496364872[/C][C]-18.4924496364872[/C][/ROW]
[ROW][C]26[/C][C]56.3[/C][C]78.5473370931052[/C][C]-22.2473370931052[/C][/ROW]
[ROW][C]27[/C][C]61.4[/C][C]84.0901196301006[/C][C]-22.6901196301006[/C][/ROW]
[ROW][C]28[/C][C]59.8[/C][C]81.5771210803696[/C][C]-21.7771210803696[/C][/ROW]
[ROW][C]29[/C][C]54.3[/C][C]86.2626241298411[/C][C]-31.9626241298411[/C][/ROW]
[ROW][C]30[/C][C]47[/C][C]69.324939636073[/C][C]-22.3249396360730[/C][/ROW]
[ROW][C]31[/C][C]50.5[/C][C]83.864472968368[/C][C]-33.364472968368[/C][/ROW]
[ROW][C]32[/C][C]48.1[/C][C]75.3902329827201[/C][C]-27.2902329827201[/C][/ROW]
[ROW][C]33[/C][C]58.8[/C][C]72.5677574629518[/C][C]-13.7677574629518[/C][/ROW]
[ROW][C]34[/C][C]70.4[/C][C]75.2045772641017[/C][C]-4.80457726410166[/C][/ROW]
[ROW][C]35[/C][C]71.9[/C][C]87.9010644595542[/C][C]-16.0010644595542[/C][/ROW]
[ROW][C]36[/C][C]73.3[/C][C]86.6091851480366[/C][C]-13.3091851480366[/C][/ROW]
[ROW][C]37[/C][C]83.5[/C][C]83.5347654921634[/C][C]-0.0347654921634399[/C][/ROW]
[ROW][C]38[/C][C]90.1[/C][C]90.8454963154327[/C][C]-0.745496315432724[/C][/ROW]
[ROW][C]39[/C][C]101.3[/C][C]99.8975042349588[/C][C]1.40249576504123[/C][/ROW]
[ROW][C]40[/C][C]98.3[/C][C]91.429863094446[/C][C]6.87013690555391[/C][/ROW]
[ROW][C]41[/C][C]106.7[/C][C]84.9822540491347[/C][C]21.7177459508653[/C][/ROW]
[ROW][C]42[/C][C]109.9[/C][C]85.7056486023754[/C][C]24.1943513976246[/C][/ROW]
[ROW][C]43[/C][C]111.1[/C][C]103.783903793805[/C][C]7.3160962061947[/C][/ROW]
[ROW][C]44[/C][C]119[/C][C]90.003576101003[/C][C]28.996423898997[/C][/ROW]
[ROW][C]45[/C][C]120.7[/C][C]88.6777128256726[/C][C]32.0222871743274[/C][/ROW]
[ROW][C]46[/C][C]104.5[/C][C]91.2196282182169[/C][C]13.2803717817831[/C][/ROW]
[ROW][C]47[/C][C]121.6[/C][C]107.051450516601[/C][C]14.5485494833988[/C][/ROW]
[ROW][C]48[/C][C]129.6[/C][C]103.355385070724[/C][C]26.2446149292757[/C][/ROW]
[ROW][C]49[/C][C]124.5[/C][C]97.9590885209472[/C][C]26.5409114790528[/C][/ROW]
[ROW][C]50[/C][C]130.1[/C][C]106.245191358240[/C][C]23.8548086417596[/C][/ROW]
[ROW][C]51[/C][C]142.3[/C][C]110.186798287325[/C][C]32.1132017126751[/C][/ROW]
[ROW][C]52[/C][C]140[/C][C]109.101385037771[/C][C]30.8986149622290[/C][/ROW]
[ROW][C]53[/C][C]143.3[/C][C]100.909325072354[/C][C]42.3906749276463[/C][/ROW]
[ROW][C]54[/C][C]113.4[/C][C]99.6303838786358[/C][C]13.7696161213642[/C][/ROW]
[ROW][C]55[/C][C]113.8[/C][C]115.297647084876[/C][C]-1.49764708487557[/C][/ROW]
[ROW][C]56[/C][C]120.7[/C][C]99.7925197841132[/C][C]20.9074802158868[/C][/ROW]
[ROW][C]57[/C][C]112.9[/C][C]100.456870293814[/C][C]12.4431297061856[/C][/ROW]
[ROW][C]58[/C][C]115.5[/C][C]105.853910892067[/C][C]9.64608910793288[/C][/ROW]
[ROW][C]59[/C][C]121.9[/C][C]119.313732537439[/C][C]2.58626746256124[/C][/ROW]
[ROW][C]60[/C][C]119.3[/C][C]110.698033349032[/C][C]8.60196665096763[/C][/ROW]
[ROW][C]61[/C][C]111[/C][C]108.552071885271[/C][C]2.44792811472914[/C][/ROW]
[ROW][C]62[/C][C]114.2[/C][C]114.306545608563[/C][C]-0.106545608563337[/C][/ROW]
[ROW][C]63[/C][C]113.5[/C][C]121.330106095546[/C][C]-7.83010609554628[/C][/ROW]
[ROW][C]64[/C][C]94[/C][C]118.190416885855[/C][C]-24.190416885855[/C][/ROW]
[ROW][C]65[/C][C]83.2[/C][C]109.964335822971[/C][C]-26.7643358229713[/C][/ROW]
[ROW][C]66[/C][C]82.8[/C][C]114.048844873956[/C][C]-31.2488448739556[/C][/ROW]
[ROW][C]67[/C][C]85.8[/C][C]111.764167526672[/C][C]-25.9641675266717[/C][/ROW]
[ROW][C]68[/C][C]88.7[/C][C]113.909097266710[/C][C]-25.2090972667102[/C][/ROW]
[ROW][C]69[/C][C]105.3[/C][C]123.172419398981[/C][C]-17.872419398981[/C][/ROW]
[ROW][C]70[/C][C]113.1[/C][C]127.79004226275[/C][C]-14.6900422627501[/C][/ROW]
[ROW][C]71[/C][C]113.8[/C][C]110.730457792343[/C][C]3.06954220765711[/C][/ROW]
[ROW][C]72[/C][C]109.4[/C][C]104.155249894476[/C][C]5.24475010552434[/C][/ROW]
[/TABLE]
Source: https://freestatistics.org/blog/index.php?pk=14383&T=4

Globally Unique Identifier (entire table): ba.freestatistics.org/blog/index.php?pk=14383&T=4

As an alternative you can also use a QR Code:  

The GUIDs for individual cells are displayed in the table below:

Multiple Linear Regression - Actuals, Interpolation, and Residuals
Time or IndexActualsInterpolationForecastResidualsPrediction Error
185.683.34550653084512.25449346915486
28991.2666880576695-2.26668805766948
397.590.55694100932826.9430589906718
410497.81145222826266.18854777173742
599.496.6967314038972.70326859610300
6103.279.085088190176224.1149118098238
710353.214935792520249.7850642074798
891.276.983460198756814.2165398012432
985.981.26968907776854.63031092223150
1080.773.91853980331826.78146019668178
1186.777.29996615764449.4000338423556
1280.787.546939216811-6.84693921681092
1381.594.2161179342861-12.7161179342861
1483.481.88874156698891.51125843301116
1583.593.4385307427412-9.93853074274125
1689.587.48976167329572.01023832670432
1785.893.8847295218022-8.0847295218022
1877.485.905094818784-8.50509481878397
1967.563.77487283375933.72512716624068
2063.775.3211136666966-11.6211136666966
2159.476.8555509408117-17.4555509408117
226272.213301559546-10.2133015595460
2362.476.0033285364186-13.6033285364185
2458.178.03520732092-19.9352073209200
255876.4924496364872-18.4924496364872
2656.378.5473370931052-22.2473370931052
2761.484.0901196301006-22.6901196301006
2859.881.5771210803696-21.7771210803696
2954.386.2626241298411-31.9626241298411
304769.324939636073-22.3249396360730
3150.583.864472968368-33.364472968368
3248.175.3902329827201-27.2902329827201
3358.872.5677574629518-13.7677574629518
3470.475.2045772641017-4.80457726410166
3571.987.9010644595542-16.0010644595542
3673.386.6091851480366-13.3091851480366
3783.583.5347654921634-0.0347654921634399
3890.190.8454963154327-0.745496315432724
39101.399.89750423495881.40249576504123
4098.391.4298630944466.87013690555391
41106.784.982254049134721.7177459508653
42109.985.705648602375424.1943513976246
43111.1103.7839037938057.3160962061947
4411990.00357610100328.996423898997
45120.788.677712825672632.0222871743274
46104.591.219628218216913.2803717817831
47121.6107.05145051660114.5485494833988
48129.6103.35538507072426.2446149292757
49124.597.959088520947226.5409114790528
50130.1106.24519135824023.8548086417596
51142.3110.18679828732532.1132017126751
52140109.10138503777130.8986149622290
53143.3100.90932507235442.3906749276463
54113.499.630383878635813.7696161213642
55113.8115.297647084876-1.49764708487557
56120.799.792519784113220.9074802158868
57112.9100.45687029381412.4431297061856
58115.5105.8539108920679.64608910793288
59121.9119.3137325374392.58626746256124
60119.3110.6980333490328.60196665096763
61111108.5520718852712.44792811472914
62114.2114.306545608563-0.106545608563337
63113.5121.330106095546-7.83010609554628
6494118.190416885855-24.190416885855
6583.2109.964335822971-26.7643358229713
6682.8114.048844873956-31.2488448739556
6785.8111.764167526672-25.9641675266717
6888.7113.909097266710-25.2090972667102
69105.3123.172419398981-17.872419398981
70113.1127.79004226275-14.6900422627501
71113.8110.7304577923433.06954220765711
72109.4104.1552498944765.24475010552434


Parameters (Session):
Parameters (R input):
par1 = 1 ; par2 = Include Monthly Dummies ; par3 = Linear Trend ;
R code (references can be found in the software module):
library(lattice)
par1 <- as.numeric(par1)
x <- t(y)
k <- length(x[1,])
n <- length(x[,1])
x1 <- cbind(x[,par1], x[,1:k!=par1])
mycolnames <- c(colnames(x)[par1], colnames(x)[1:k!=par1])
colnames(x1) <- mycolnames #colnames(x)[par1]
x <- x1
if (par3 == 'First Differences'){
x2 <- array(0, dim=c(n-1,k), dimnames=list(1:(n-1), paste('(1-B)',colnames(x),sep='')))
for (i in 1:n-1) {
for (j in 1:k) {
x2[i,j] <- x[i+1,j] - x[i,j]
}
}
x <- x2
}
if (par2 == 'Include Monthly Dummies'){
x2 <- array(0, dim=c(n,11), dimnames=list(1:n, paste('M', seq(1:11), sep ='')))
for (i in 1:11){
x2[seq(i,n,12),i] <- 1
}
x <- cbind(x, x2)
}
if (par2 == 'Include Quarterly Dummies'){
x2 <- array(0, dim=c(n,3), dimnames=list(1:n, paste('Q', seq(1:3), sep ='')))
for (i in 1:3){
x2[seq(i,n,4),i] <- 1
}
x <- cbind(x, x2)
}
k <- length(x[1,])
if (par3 == 'Linear Trend'){
x <- cbind(x, c(1:n))
colnames(x)[k+1] <- 't'
}
x
k <- length(x[1,])
df <- as.data.frame(x)
(mylm <- lm(df))
(mysum <- summary(mylm))
bitmap(file='test0.png')
plot(x[,1], type='l', main='Actuals and Interpolation', ylab='value of Actuals and Interpolation (dots)', xlab='time or index')
points(x[,1]-mysum$resid)
grid()
dev.off()
bitmap(file='test1.png')
plot(mysum$resid, type='b', pch=19, main='Residuals', ylab='value of Residuals', xlab='time or index')
grid()
dev.off()
bitmap(file='test2.png')
hist(mysum$resid, main='Residual Histogram', xlab='values of Residuals')
grid()
dev.off()
bitmap(file='test3.png')
densityplot(~mysum$resid,col='black',main='Residual Density Plot', xlab='values of Residuals')
dev.off()
bitmap(file='test4.png')
qqnorm(mysum$resid, main='Residual Normal Q-Q Plot')
grid()
dev.off()
(myerror <- as.ts(mysum$resid))
bitmap(file='test5.png')
dum <- cbind(lag(myerror,k=1),myerror)
dum
dum1 <- dum[2:length(myerror),]
dum1
z <- as.data.frame(dum1)
z
plot(z,main=paste('Residual Lag plot, lowess, and regression line'), ylab='values of Residuals', xlab='lagged values of Residuals')
lines(lowess(z))
abline(lm(z))
grid()
dev.off()
bitmap(file='test6.png')
acf(mysum$resid, lag.max=length(mysum$resid)/2, main='Residual Autocorrelation Function')
grid()
dev.off()
bitmap(file='test7.png')
pacf(mysum$resid, lag.max=length(mysum$resid)/2, main='Residual Partial Autocorrelation Function')
grid()
dev.off()
bitmap(file='test8.png')
opar <- par(mfrow = c(2,2), oma = c(0, 0, 1.1, 0))
plot(mylm, las = 1, sub='Residual Diagnostics')
par(opar)
dev.off()
load(file='createtable')
a<-table.start()
a<-table.row.start(a)
a<-table.element(a, 'Multiple Linear Regression - Estimated Regression Equation', 1, TRUE)
a<-table.row.end(a)
myeq <- colnames(x)[1]
myeq <- paste(myeq, '[t] = ', sep='')
for (i in 1:k){
if (mysum$coefficients[i,1] > 0) myeq <- paste(myeq, '+', '')
myeq <- paste(myeq, mysum$coefficients[i,1], sep=' ')
if (rownames(mysum$coefficients)[i] != '(Intercept)') {
myeq <- paste(myeq, rownames(mysum$coefficients)[i], sep='')
if (rownames(mysum$coefficients)[i] != 't') myeq <- paste(myeq, '[t]', sep='')
}
}
myeq <- paste(myeq, ' + e[t]')
a<-table.row.start(a)
a<-table.element(a, myeq)
a<-table.row.end(a)
a<-table.end(a)
table.save(a,file='mytable1.tab')
a<-table.start()
a<-table.row.start(a)
a<-table.element(a,hyperlink('ols1.htm','Multiple Linear Regression - Ordinary Least Squares',''), 6, TRUE)
a<-table.row.end(a)
a<-table.row.start(a)
a<-table.element(a,'Variable',header=TRUE)
a<-table.element(a,'Parameter',header=TRUE)
a<-table.element(a,'S.D.',header=TRUE)
a<-table.element(a,'T-STAT
H0: parameter = 0',header=TRUE)
a<-table.element(a,'2-tail p-value',header=TRUE)
a<-table.element(a,'1-tail p-value',header=TRUE)
a<-table.row.end(a)
for (i in 1:k){
a<-table.row.start(a)
a<-table.element(a,rownames(mysum$coefficients)[i],header=TRUE)
a<-table.element(a,mysum$coefficients[i,1])
a<-table.element(a, round(mysum$coefficients[i,2],6))
a<-table.element(a, round(mysum$coefficients[i,3],4))
a<-table.element(a, round(mysum$coefficients[i,4],6))
a<-table.element(a, round(mysum$coefficients[i,4]/2,6))
a<-table.row.end(a)
}
a<-table.end(a)
table.save(a,file='mytable2.tab')
a<-table.start()
a<-table.row.start(a)
a<-table.element(a, 'Multiple Linear Regression - Regression Statistics', 2, TRUE)
a<-table.row.end(a)
a<-table.row.start(a)
a<-table.element(a, 'Multiple R',1,TRUE)
a<-table.element(a, sqrt(mysum$r.squared))
a<-table.row.end(a)
a<-table.row.start(a)
a<-table.element(a, 'R-squared',1,TRUE)
a<-table.element(a, mysum$r.squared)
a<-table.row.end(a)
a<-table.row.start(a)
a<-table.element(a, 'Adjusted R-squared',1,TRUE)
a<-table.element(a, mysum$adj.r.squared)
a<-table.row.end(a)
a<-table.row.start(a)
a<-table.element(a, 'F-TEST (value)',1,TRUE)
a<-table.element(a, mysum$fstatistic[1])
a<-table.row.end(a)
a<-table.row.start(a)
a<-table.element(a, 'F-TEST (DF numerator)',1,TRUE)
a<-table.element(a, mysum$fstatistic[2])
a<-table.row.end(a)
a<-table.row.start(a)
a<-table.element(a, 'F-TEST (DF denominator)',1,TRUE)
a<-table.element(a, mysum$fstatistic[3])
a<-table.row.end(a)
a<-table.row.start(a)
a<-table.element(a, 'p-value',1,TRUE)
a<-table.element(a, 1-pf(mysum$fstatistic[1],mysum$fstatistic[2],mysum$fstatistic[3]))
a<-table.row.end(a)
a<-table.row.start(a)
a<-table.element(a, 'Multiple Linear Regression - Residual Statistics', 2, TRUE)
a<-table.row.end(a)
a<-table.row.start(a)
a<-table.element(a, 'Residual Standard Deviation',1,TRUE)
a<-table.element(a, mysum$sigma)
a<-table.row.end(a)
a<-table.row.start(a)
a<-table.element(a, 'Sum Squared Residuals',1,TRUE)
a<-table.element(a, sum(myerror*myerror))
a<-table.row.end(a)
a<-table.end(a)
table.save(a,file='mytable3.tab')
a<-table.start()
a<-table.row.start(a)
a<-table.element(a, 'Multiple Linear Regression - Actuals, Interpolation, and Residuals', 4, TRUE)
a<-table.row.end(a)
a<-table.row.start(a)
a<-table.element(a, 'Time or Index', 1, TRUE)
a<-table.element(a, 'Actuals', 1, TRUE)
a<-table.element(a, 'Interpolation
Forecast', 1, TRUE)
a<-table.element(a, 'Residuals
Prediction Error', 1, TRUE)
a<-table.row.end(a)
for (i in 1:n) {
a<-table.row.start(a)
a<-table.element(a,i, 1, TRUE)
a<-table.element(a,x[i])
a<-table.element(a,x[i]-mysum$resid[i])
a<-table.element(a,mysum$resid[i])
a<-table.row.end(a)
}
a<-table.end(a)
table.save(a,file='mytable4.tab')