Free Statistics

of Irreproducible Research!

Author's title

Author*Unverified author*
R Software Modulerwasp_cross.wasp
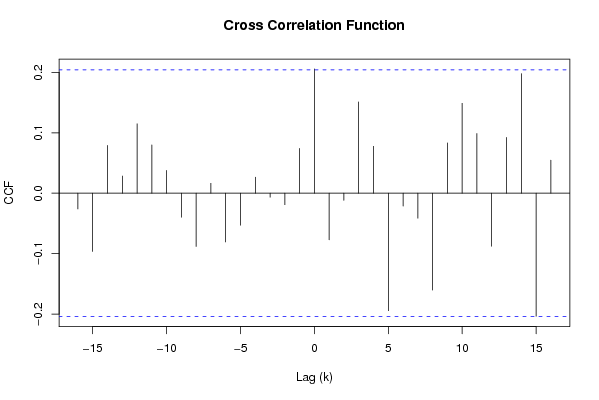
Title produced by softwareCross Correlation Function
Date of computationSat, 15 Dec 2007 04:51:19 -0700
Cite this page as followsStatistical Computations at FreeStatistics.org, Office for Research Development and Education, URL https://freestatistics.org/blog/index.php?v=date/2007/Dec/15/t1197718577ucwcwgqjtyqrjm3.htm/, Retrieved Fri, 03 May 2024 02:47:44 +0000
Statistical Computations at FreeStatistics.org, Office for Research Development and Education, URL https://freestatistics.org/blog/index.php?pk=4021, Retrieved Fri, 03 May 2024 02:47:44 +0000
QR Codes:

Original text written by user:
IsPrivate?No (this computation is public)
User-defined keywords
Estimated Impact224
Family? (F = Feedback message, R = changed R code, M = changed R Module, P = changed Parameters, D = changed Data)
-       [Cross Correlation Function] [graan d] [2007-12-15 11:51:19] [a98121933c09d0d44a9f89053acd1df1] [Current]
Feedback Forum

Post a new message
Dataseries X:
102.7
103.2
105.6
103.9
107.2
100.7
92.1
90.3
93.4
98.5
100.8
102.3
104.7
101.1
101.4
99.5
98.4
96.3
100.7
101.2
100.3
97.8
97.4
98.6
99.7
99
98.1
97
98.5
103.8
114.4
124.5
134.2
131.8
125.6
119.9
114.9
115.5
112.5
111.4
115.3
110.8
103.7
111.1
113
111.2
117.6
121.7
127.3
129.8
137.1
141.4
137.4
130.7
117.2
110.8
111.4
108.2
108.8
110.2
109.5
109.5
116
111.2
112.1
114
119.1
114.1
115.1
115.4
110.8
116
119.2
126.5
127.8
131.3
140.3
137.3
143
134.5
139.9
159.3
170.4
175
175.8
180.9
180.3
169.6
172.3
184.8
177.7
184.6
211.4
Dataseries Y:
112.1
104.2
102.4
100.3
102.6
101.5
103.4
99.4
97.9
98
90.2
87.1
91.8
94.8
91.8
89.3
91.7
86.2
82.8
82.3
79.8
79.4
85.3
87.5
88.3
88.6
94.9
94.7
92.6
91.8
96.4
96.4
107.1
111.9
107.8
109.2
115.3
119.2
107.8
106.8
104.2
94.8
97.5
98.3
100.6
94.9
93.6
98
104.3
103.9
105.3
102.6
103.3
107.9
107.8
109.8
110.6
110.8
119.3
128.1
127.6
137.9
151.4
143.6
143.4
141.9
135.2
133.1
129.6
134.1
136.8
143.5
162.5
163.1
157.2
158.8
155.4
148.5
154.2
153.3
149.4
147.9
156
163
159.1
159.5
157.3
156.4
156.6
162.4
166.8
162.6
168.1


Summary of compuational transaction
Raw Inputview raw input (R code)
Raw Outputview raw output of R engine
Computing time1 seconds
R Server'Gwilym Jenkins' @ 72.249.127.135

\begin{tabular}{lllllllll}
\hline
Summary of compuational transaction \tabularnewline
Raw Input & view raw input (R code)  \tabularnewline
Raw Output & view raw output of R engine  \tabularnewline
Computing time & 1 seconds \tabularnewline
R Server & 'Gwilym Jenkins' @ 72.249.127.135 \tabularnewline
\hline
\end{tabular}
%Source: https://freestatistics.org/blog/index.php?pk=4021&T=0

[TABLE]
[ROW][C]Summary of compuational transaction[/C][/ROW]
[ROW][C]Raw Input[/C][C]view raw input (R code) [/C][/ROW]
[ROW][C]Raw Output[/C][C]view raw output of R engine [/C][/ROW]
[ROW][C]Computing time[/C][C]1 seconds[/C][/ROW]
[ROW][C]R Server[/C][C]'Gwilym Jenkins' @ 72.249.127.135[/C][/ROW]
[/TABLE]
Source: https://freestatistics.org/blog/index.php?pk=4021&T=0

Globally Unique Identifier (entire table): ba.freestatistics.org/blog/index.php?pk=4021&T=0

As an alternative you can also use a QR Code:  

The GUIDs for individual cells are displayed in the table below:

Summary of compuational transaction
Raw Inputview raw input (R code)
Raw Outputview raw output of R engine
Computing time1 seconds
R Server'Gwilym Jenkins' @ 72.249.127.135


Cross Correlation Function
ParameterValue
Box-Cox transformation parameter (lambda) of X series1
Degree of non-seasonal differencing (d) of X series1
Degree of seasonal differencing (D) of X series0
Seasonal Period (s)12
Box-Cox transformation parameter (lambda) of Y series1
Degree of non-seasonal differencing (d) of Y series1
Degree of seasonal differencing (D) of Y series0
krho(Y[t],X[t+k])
-16-0.0259709142113708
-15-0.0964924668735199
-140.0791433849150427
-130.0283109851104922
-120.114911364939972
-110.079849642503587
-100.0377270691540095
-9-0.0396017978621986
-8-0.0882069406401866
-70.0164180470842418
-6-0.080584166270916
-5-0.0529371614658814
-40.0265622584093354
-3-0.00663603354349592
-2-0.0190105016974954
-10.074140415590588
00.205712830503735
1-0.0771858987731261
2-0.0116999077896459
30.151015852002146
40.0777541190651665
5-0.194562738720504
6-0.0213265947950656
7-0.0412397466391223
8-0.160316752913407
90.0832025229575555
100.14873293025844
110.098757242046576
12-0.0877513606926199
130.0923700237238173
140.197908586991773
15-0.203574517788473
160.0546690834323743

\begin{tabular}{lllllllll}
\hline
Cross Correlation Function \tabularnewline
Parameter & Value \tabularnewline
Box-Cox transformation parameter (lambda) of X series & 1 \tabularnewline
Degree of non-seasonal differencing (d) of X series & 1 \tabularnewline
Degree of seasonal differencing (D) of X series & 0 \tabularnewline
Seasonal Period (s) & 12 \tabularnewline
Box-Cox transformation parameter (lambda) of Y series & 1 \tabularnewline
Degree of non-seasonal differencing (d) of Y series & 1 \tabularnewline
Degree of seasonal differencing (D) of Y series & 0 \tabularnewline
k & rho(Y[t],X[t+k]) \tabularnewline
-16 & -0.0259709142113708 \tabularnewline
-15 & -0.0964924668735199 \tabularnewline
-14 & 0.0791433849150427 \tabularnewline
-13 & 0.0283109851104922 \tabularnewline
-12 & 0.114911364939972 \tabularnewline
-11 & 0.079849642503587 \tabularnewline
-10 & 0.0377270691540095 \tabularnewline
-9 & -0.0396017978621986 \tabularnewline
-8 & -0.0882069406401866 \tabularnewline
-7 & 0.0164180470842418 \tabularnewline
-6 & -0.080584166270916 \tabularnewline
-5 & -0.0529371614658814 \tabularnewline
-4 & 0.0265622584093354 \tabularnewline
-3 & -0.00663603354349592 \tabularnewline
-2 & -0.0190105016974954 \tabularnewline
-1 & 0.074140415590588 \tabularnewline
0 & 0.205712830503735 \tabularnewline
1 & -0.0771858987731261 \tabularnewline
2 & -0.0116999077896459 \tabularnewline
3 & 0.151015852002146 \tabularnewline
4 & 0.0777541190651665 \tabularnewline
5 & -0.194562738720504 \tabularnewline
6 & -0.0213265947950656 \tabularnewline
7 & -0.0412397466391223 \tabularnewline
8 & -0.160316752913407 \tabularnewline
9 & 0.0832025229575555 \tabularnewline
10 & 0.14873293025844 \tabularnewline
11 & 0.098757242046576 \tabularnewline
12 & -0.0877513606926199 \tabularnewline
13 & 0.0923700237238173 \tabularnewline
14 & 0.197908586991773 \tabularnewline
15 & -0.203574517788473 \tabularnewline
16 & 0.0546690834323743 \tabularnewline
\hline
\end{tabular}
%Source: https://freestatistics.org/blog/index.php?pk=4021&T=1

[TABLE]
[ROW][C]Cross Correlation Function[/C][/ROW]
[ROW][C]Parameter[/C][C]Value[/C][/ROW]
[ROW][C]Box-Cox transformation parameter (lambda) of X series[/C][C]1[/C][/ROW]
[ROW][C]Degree of non-seasonal differencing (d) of X series[/C][C]1[/C][/ROW]
[ROW][C]Degree of seasonal differencing (D) of X series[/C][C]0[/C][/ROW]
[ROW][C]Seasonal Period (s)[/C][C]12[/C][/ROW]
[ROW][C]Box-Cox transformation parameter (lambda) of Y series[/C][C]1[/C][/ROW]
[ROW][C]Degree of non-seasonal differencing (d) of Y series[/C][C]1[/C][/ROW]
[ROW][C]Degree of seasonal differencing (D) of Y series[/C][C]0[/C][/ROW]
[ROW][C]k[/C][C]rho(Y[t],X[t+k])[/C][/ROW]
[ROW][C]-16[/C][C]-0.0259709142113708[/C][/ROW]
[ROW][C]-15[/C][C]-0.0964924668735199[/C][/ROW]
[ROW][C]-14[/C][C]0.0791433849150427[/C][/ROW]
[ROW][C]-13[/C][C]0.0283109851104922[/C][/ROW]
[ROW][C]-12[/C][C]0.114911364939972[/C][/ROW]
[ROW][C]-11[/C][C]0.079849642503587[/C][/ROW]
[ROW][C]-10[/C][C]0.0377270691540095[/C][/ROW]
[ROW][C]-9[/C][C]-0.0396017978621986[/C][/ROW]
[ROW][C]-8[/C][C]-0.0882069406401866[/C][/ROW]
[ROW][C]-7[/C][C]0.0164180470842418[/C][/ROW]
[ROW][C]-6[/C][C]-0.080584166270916[/C][/ROW]
[ROW][C]-5[/C][C]-0.0529371614658814[/C][/ROW]
[ROW][C]-4[/C][C]0.0265622584093354[/C][/ROW]
[ROW][C]-3[/C][C]-0.00663603354349592[/C][/ROW]
[ROW][C]-2[/C][C]-0.0190105016974954[/C][/ROW]
[ROW][C]-1[/C][C]0.074140415590588[/C][/ROW]
[ROW][C]0[/C][C]0.205712830503735[/C][/ROW]
[ROW][C]1[/C][C]-0.0771858987731261[/C][/ROW]
[ROW][C]2[/C][C]-0.0116999077896459[/C][/ROW]
[ROW][C]3[/C][C]0.151015852002146[/C][/ROW]
[ROW][C]4[/C][C]0.0777541190651665[/C][/ROW]
[ROW][C]5[/C][C]-0.194562738720504[/C][/ROW]
[ROW][C]6[/C][C]-0.0213265947950656[/C][/ROW]
[ROW][C]7[/C][C]-0.0412397466391223[/C][/ROW]
[ROW][C]8[/C][C]-0.160316752913407[/C][/ROW]
[ROW][C]9[/C][C]0.0832025229575555[/C][/ROW]
[ROW][C]10[/C][C]0.14873293025844[/C][/ROW]
[ROW][C]11[/C][C]0.098757242046576[/C][/ROW]
[ROW][C]12[/C][C]-0.0877513606926199[/C][/ROW]
[ROW][C]13[/C][C]0.0923700237238173[/C][/ROW]
[ROW][C]14[/C][C]0.197908586991773[/C][/ROW]
[ROW][C]15[/C][C]-0.203574517788473[/C][/ROW]
[ROW][C]16[/C][C]0.0546690834323743[/C][/ROW]
[/TABLE]
Source: https://freestatistics.org/blog/index.php?pk=4021&T=1

Globally Unique Identifier (entire table): ba.freestatistics.org/blog/index.php?pk=4021&T=1

As an alternative you can also use a QR Code:  

The GUIDs for individual cells are displayed in the table below:

Cross Correlation Function
ParameterValue
Box-Cox transformation parameter (lambda) of X series1
Degree of non-seasonal differencing (d) of X series1
Degree of seasonal differencing (D) of X series0
Seasonal Period (s)12
Box-Cox transformation parameter (lambda) of Y series1
Degree of non-seasonal differencing (d) of Y series1
Degree of seasonal differencing (D) of Y series0
krho(Y[t],X[t+k])
-16-0.0259709142113708
-15-0.0964924668735199
-140.0791433849150427
-130.0283109851104922
-120.114911364939972
-110.079849642503587
-100.0377270691540095
-9-0.0396017978621986
-8-0.0882069406401866
-70.0164180470842418
-6-0.080584166270916
-5-0.0529371614658814
-40.0265622584093354
-3-0.00663603354349592
-2-0.0190105016974954
-10.074140415590588
00.205712830503735
1-0.0771858987731261
2-0.0116999077896459
30.151015852002146
40.0777541190651665
5-0.194562738720504
6-0.0213265947950656
7-0.0412397466391223
8-0.160316752913407
90.0832025229575555
100.14873293025844
110.098757242046576
12-0.0877513606926199
130.0923700237238173
140.197908586991773
15-0.203574517788473
160.0546690834323743


Parameters (Session):
par1 = 1 ; par2 = 1 ; par3 = 0 ; par4 = 12 ; par5 = 1 ; par6 = 1 ; par7 = 0 ;
Parameters (R input):
par1 = 1 ; par2 = 1 ; par3 = 0 ; par4 = 12 ; par5 = 1 ; par6 = 1 ; par7 = 0 ;
R code (references can be found in the software module):
par1 <- as.numeric(par1)
par2 <- as.numeric(par2)
par3 <- as.numeric(par3)
par4 <- as.numeric(par4)
par5 <- as.numeric(par5)
par6 <- as.numeric(par6)
par7 <- as.numeric(par7)
if (par1 == 0) {
x <- log(x)
} else {
x <- (x ^ par1 - 1) / par1
}
if (par5 == 0) {
y <- log(y)
} else {
y <- (y ^ par5 - 1) / par5
}
if (par2 > 0) x <- diff(x,lag=1,difference=par2)
if (par6 > 0) y <- diff(y,lag=1,difference=par6)
if (par3 > 0) x <- diff(x,lag=par4,difference=par3)
if (par7 > 0) x <- diff(y,lag=par4,difference=par7)
x
y
bitmap(file='test1.png')
(r <- ccf(x,y,main='Cross Correlation Function',ylab='CCF',xlab='Lag (k)'))
dev.off()
load(file='createtable')
a<-table.start()
a<-table.row.start(a)
a<-table.element(a,'Cross Correlation Function',2,TRUE)
a<-table.row.end(a)
a<-table.row.start(a)
a<-table.element(a,'Parameter',header=TRUE)
a<-table.element(a,'Value',header=TRUE)
a<-table.row.end(a)
a<-table.row.start(a)
a<-table.element(a,'Box-Cox transformation parameter (lambda) of X series',header=TRUE)
a<-table.element(a,par1)
a<-table.row.end(a)
a<-table.row.start(a)
a<-table.element(a,'Degree of non-seasonal differencing (d) of X series',header=TRUE)
a<-table.element(a,par2)
a<-table.row.end(a)
a<-table.row.start(a)
a<-table.element(a,'Degree of seasonal differencing (D) of X series',header=TRUE)
a<-table.element(a,par3)
a<-table.row.end(a)
a<-table.row.start(a)
a<-table.element(a,'Seasonal Period (s)',header=TRUE)
a<-table.element(a,par4)
a<-table.row.end(a)
a<-table.row.start(a)
a<-table.element(a,'Box-Cox transformation parameter (lambda) of Y series',header=TRUE)
a<-table.element(a,par5)
a<-table.row.end(a)
a<-table.row.start(a)
a<-table.element(a,'Degree of non-seasonal differencing (d) of Y series',header=TRUE)
a<-table.element(a,par6)
a<-table.row.end(a)
a<-table.row.start(a)
a<-table.element(a,'Degree of seasonal differencing (D) of Y series',header=TRUE)
a<-table.element(a,par7)
a<-table.row.end(a)
a<-table.row.start(a)
a<-table.element(a,'k',header=TRUE)
a<-table.element(a,'rho(Y[t],X[t+k])',header=TRUE)
a<-table.row.end(a)
mylength <- length(r$acf)
myhalf <- floor((mylength-1)/2)
for (i in 1:mylength) {
a<-table.row.start(a)
a<-table.element(a,i-myhalf-1,header=TRUE)
a<-table.element(a,r$acf[i])
a<-table.row.end(a)
}
a<-table.end(a)
table.save(a,file='mytable.tab')