Free Statistics
of Irreproducible Research!
Description of Statistical Computation | |||||||||||||||||||||||||||||||||||||||||||||||||||||||||||||||||||||
|---|---|---|---|---|---|---|---|---|---|---|---|---|---|---|---|---|---|---|---|---|---|---|---|---|---|---|---|---|---|---|---|---|---|---|---|---|---|---|---|---|---|---|---|---|---|---|---|---|---|---|---|---|---|---|---|---|---|---|---|---|---|---|---|---|---|---|---|---|---|
| Author's title | |||||||||||||||||||||||||||||||||||||||||||||||||||||||||||||||||||||
| Author | *Unverified author* | ||||||||||||||||||||||||||||||||||||||||||||||||||||||||||||||||||||
| R Software Module | rwasp_pairs.wasp | ||||||||||||||||||||||||||||||||||||||||||||||||||||||||||||||||||||
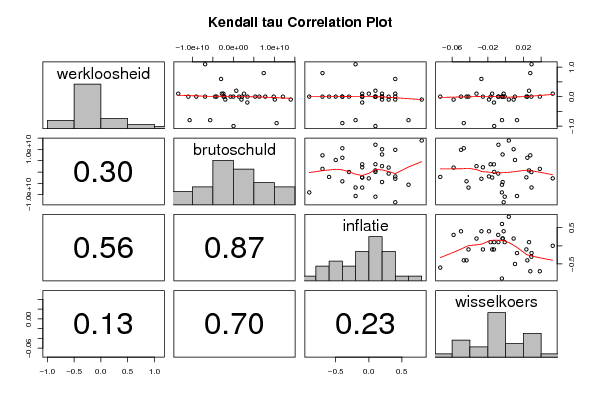
| Title produced by software | Kendall tau Correlation Matrix | ||||||||||||||||||||||||||||||||||||||||||||||||||||||||||||||||||||
| Date of computation | Sat, 15 Dec 2007 04:45:07 -0700 | ||||||||||||||||||||||||||||||||||||||||||||||||||||||||||||||||||||
| Cite this page as follows | Statistical Computations at FreeStatistics.org, Office for Research Development and Education, URL https://freestatistics.org/blog/index.php?v=date/2007/Dec/15/t11977181474lbyrecm8c9o1pc.htm/, Retrieved Thu, 02 May 2024 18:13:08 +0000 | ||||||||||||||||||||||||||||||||||||||||||||||||||||||||||||||||||||
| Statistical Computations at FreeStatistics.org, Office for Research Development and Education, URL https://freestatistics.org/blog/index.php?pk=4019, Retrieved Thu, 02 May 2024 18:13:08 +0000 | |||||||||||||||||||||||||||||||||||||||||||||||||||||||||||||||||||||
| QR Codes: | |||||||||||||||||||||||||||||||||||||||||||||||||||||||||||||||||||||
|
| |||||||||||||||||||||||||||||||||||||||||||||||||||||||||||||||||||||
| Original text written by user: | |||||||||||||||||||||||||||||||||||||||||||||||||||||||||||||||||||||
| IsPrivate? | No (this computation is public) | ||||||||||||||||||||||||||||||||||||||||||||||||||||||||||||||||||||
| User-defined keywords | s0650550 s0650062 | ||||||||||||||||||||||||||||||||||||||||||||||||||||||||||||||||||||
| Estimated Impact | 248 | ||||||||||||||||||||||||||||||||||||||||||||||||||||||||||||||||||||
Tree of Dependent Computations | |||||||||||||||||||||||||||||||||||||||||||||||||||||||||||||||||||||
| Family? (F = Feedback message, R = changed R code, M = changed R Module, P = changed Parameters, D = changed Data) | |||||||||||||||||||||||||||||||||||||||||||||||||||||||||||||||||||||
| - [Kendall tau Correlation Matrix] [Q4] [2007-12-15 11:45:07] [ab924f39c1cc7a5dd22761038b10db61] [Current] | |||||||||||||||||||||||||||||||||||||||||||||||||||||||||||||||||||||
| Feedback Forum | |||||||||||||||||||||||||||||||||||||||||||||||||||||||||||||||||||||
Post a new message | |||||||||||||||||||||||||||||||||||||||||||||||||||||||||||||||||||||
Dataset | |||||||||||||||||||||||||||||||||||||||||||||||||||||||||||||||||||||
| Dataseries X: | |||||||||||||||||||||||||||||||||||||||||||||||||||||||||||||||||||||
0 3441000000 0,1 -0,0169 -1,77636E-15 -4114000000 -0,4 -0,0439 0,1 -2429000000 -0,1 -0,0151 0 7771000000 0,2 -0,0034 -0,8 -5635000000 0,6 -0,0041 0 -2170000000 -0,6 -0,0734 0 12078000000 0,1 -0,0081 1,1 -6869000000 -0,2 0,0291 -1,77636E-15 -2367000000 -0,1 0,0233 0 -689000000 0,3 -0,0083 -0,9 10531000000 -0,4 -0,047 0 -10956000000 0,1 -0,001 -0,1 1974000000 0,3 -0,0584 0,1 2597000000 0,2 -0,0327 0 -4439000000 0,2 -0,0033 0 1399000000 -0,7 0,0384 0,8 7394000000 -0,7 0,0277 0,1 -13410000000 0,4 -0,0022 -0,2 3412000000 -0,1 -0,0131 -1 48000000 0,1 -0,0128 -0,1 10090000000 0,2 0,009 0 -9025000000 -0,9 -0,0042 0,6 -2988000000 0,4 -0,0272 0 9828000000 0,4 -0,0501 0 -6896000000 -0,1 -0,0417 0 -11000000 -0,3 0,0289 0 5331000000 -0,5 0,0105 -0,1 -1954000000 0,4 -0,0187 0,2 713000000 0,1 0,0263 0 6322000000 -0,4 0,0244 0,1 -2806000000 0 0,0529 -0,8 -10643000000 -0,2 0,0128 0 2092000000 -0,1 -0,0255 -0,1 13973000000 0,8 0,0036 | |||||||||||||||||||||||||||||||||||||||||||||||||||||||||||||||||||||
Tables (Output of Computation) | |||||||||||||||||||||||||||||||||||||||||||||||||||||||||||||||||||||
| |||||||||||||||||||||||||||||||||||||||||||||||||||||||||||||||||||||
Figures (Output of Computation) | |||||||||||||||||||||||||||||||||||||||||||||||||||||||||||||||||||||
Input Parameters & R Code | |||||||||||||||||||||||||||||||||||||||||||||||||||||||||||||||||||||
| Parameters (Session): | |||||||||||||||||||||||||||||||||||||||||||||||||||||||||||||||||||||
| Parameters (R input): | |||||||||||||||||||||||||||||||||||||||||||||||||||||||||||||||||||||
| R code (references can be found in the software module): | |||||||||||||||||||||||||||||||||||||||||||||||||||||||||||||||||||||
panel.tau <- function(x, y, digits=2, prefix='', cex.cor) | |||||||||||||||||||||||||||||||||||||||||||||||||||||||||||||||||||||