Free Statistics

of Irreproducible Research!

Author's title

Author*Unverified author*
R Software Modulerwasp_autocorrelation.wasp
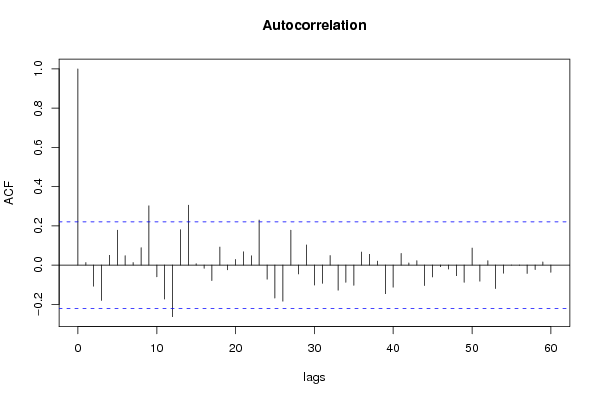
Title produced by software(Partial) Autocorrelation Function
Date of computationFri, 14 Dec 2007 08:58:35 -0700
Cite this page as followsStatistical Computations at FreeStatistics.org, Office for Research Development and Education, URL https://freestatistics.org/blog/index.php?v=date/2007/Dec/14/t1197647056lexu1bm85ulyb1u.htm/, Retrieved Thu, 02 May 2024 14:56:18 +0000
Statistical Computations at FreeStatistics.org, Office for Research Development and Education, URL https://freestatistics.org/blog/index.php?pk=3932, Retrieved Thu, 02 May 2024 14:56:18 +0000
QR Codes:

Original text written by user:
IsPrivate?No (this computation is public)
User-defined keywordsChristel Stuer Steven Coomans Nele Rombaut Gregory De Meulenaer Gudrun Verhelst Mathias Bruneel
Estimated Impact191
Family? (F = Feedback message, R = changed R code, M = changed R Module, P = changed Parameters, D = changed Data)
-       [(Partial) Autocorrelation Function] [Paper: ACF (d = 1...] [2007-12-14 15:58:35] [7071e8240f1069aec69cdda95d3fa1f8] [Current]
-    D    [(Partial) Autocorrelation Function] [Autocorrelatie se...] [2008-12-21 13:08:41] [74be16979710d4c4e7c6647856088456]
-    D    [(Partial) Autocorrelation Function] [Partiële autocorr...] [2008-12-21 14:38:17] [74be16979710d4c4e7c6647856088456]
Feedback Forum

Post a new message
Dataseries X:
527
516
503
489
479
475
524
552
532
511
492
492
493
481
462
457
442
439
488
521
501
485
464
460
467
460
448
443
436
431
484
510
513
503
471
471
476
475
470
461
455
456
517
525
523
519
509
512
519
517
510
509
501
507
569
580
578
565
547
555
562
561
555
544
537
543
594
611
613
611
594
595
591
589
584
573
567
569
621
629
628
612
595
597
593
590
580
574
573
573
620
626


Summary of compuational transaction
Raw Inputview raw input (R code)
Raw Outputview raw output of R engine
Computing time1 seconds
R Server'Gwilym Jenkins' @ 72.249.127.135

\begin{tabular}{lllllllll}
\hline
Summary of compuational transaction \tabularnewline
Raw Input & view raw input (R code)  \tabularnewline
Raw Output & view raw output of R engine  \tabularnewline
Computing time & 1 seconds \tabularnewline
R Server & 'Gwilym Jenkins' @ 72.249.127.135 \tabularnewline
\hline
\end{tabular}
%Source: https://freestatistics.org/blog/index.php?pk=3932&T=0

[TABLE]
[ROW][C]Summary of compuational transaction[/C][/ROW]
[ROW][C]Raw Input[/C][C]view raw input (R code) [/C][/ROW]
[ROW][C]Raw Output[/C][C]view raw output of R engine [/C][/ROW]
[ROW][C]Computing time[/C][C]1 seconds[/C][/ROW]
[ROW][C]R Server[/C][C]'Gwilym Jenkins' @ 72.249.127.135[/C][/ROW]
[/TABLE]
Source: https://freestatistics.org/blog/index.php?pk=3932&T=0

Globally Unique Identifier (entire table): ba.freestatistics.org/blog/index.php?pk=3932&T=0

As an alternative you can also use a QR Code:  

The GUIDs for individual cells are displayed in the table below:

Summary of compuational transaction
Raw Inputview raw input (R code)
Raw Outputview raw output of R engine
Computing time1 seconds
R Server'Gwilym Jenkins' @ 72.249.127.135


Autocorrelation Function
Time lag kACF(k)T-STATP-value
018.88820
10.0130130.11570.454107
2-0.107516-0.95560.828911
3-0.18027-1.60230.943457
40.0498940.44350.329318
50.1777821.58020.059033
60.0482030.42840.33475
70.0128610.11430.454641
80.08860.78750.216675
90.3019932.68420.004428
10-0.059459-0.52850.700678
11-0.173339-1.54070.936303
12-0.262842-2.33620.988991
130.1804951.60430.056322
140.3054612.7150.004068
150.0072710.06460.474319
16-0.016357-0.14540.557611
17-0.078968-0.70190.757591
180.0919890.81760.208017
19-0.023914-0.21250.583887
200.0285780.2540.400075
210.06760.60080.274832
220.047560.42270.336824
230.2299342.04370.022158
24-0.071587-0.63630.736784
25-0.167801-1.49150.930087
26-0.183737-1.63310.946785
270.1778121.58040.059002
28-0.045066-0.40060.655087
290.1028610.91420.181685
30-0.102074-0.90730.816484
31-0.092587-0.82290.793487
320.0483650.42990.334229
33-0.127748-1.13550.87019
34-0.087615-0.77870.78077
35-0.103203-0.91730.819108
360.066560.59160.277906
370.0553010.49150.312209
380.0202560.180.428791
39-0.145623-1.29430.900338
40-0.112371-0.99880.839524
410.0594830.52870.299248
420.0109980.09770.46119
430.0223310.19850.421589
44-0.104461-0.92850.822003
45-0.060566-0.53830.704067
46-0.00785-0.06980.527724
47-0.020386-0.18120.571662
48-0.054164-0.48140.684227
49-0.087859-0.78090.781405
500.0869780.77310.220891
51-0.081953-0.72840.765742
520.0223220.19840.42162
53-0.119442-1.06160.854178
54-0.041006-0.36450.641759
554.7e-054e-040.499834
56-0.000631-0.00560.502229
57-0.042745-0.37990.647491
58-0.022749-0.20220.579861
590.0162730.14460.442684

\begin{tabular}{lllllllll}
\hline
Autocorrelation Function \tabularnewline
Time lag k & ACF(k) & T-STAT & P-value \tabularnewline
0 & 1 & 8.8882 & 0 \tabularnewline
1 & 0.013013 & 0.1157 & 0.454107 \tabularnewline
2 & -0.107516 & -0.9556 & 0.828911 \tabularnewline
3 & -0.18027 & -1.6023 & 0.943457 \tabularnewline
4 & 0.049894 & 0.4435 & 0.329318 \tabularnewline
5 & 0.177782 & 1.5802 & 0.059033 \tabularnewline
6 & 0.048203 & 0.4284 & 0.33475 \tabularnewline
7 & 0.012861 & 0.1143 & 0.454641 \tabularnewline
8 & 0.0886 & 0.7875 & 0.216675 \tabularnewline
9 & 0.301993 & 2.6842 & 0.004428 \tabularnewline
10 & -0.059459 & -0.5285 & 0.700678 \tabularnewline
11 & -0.173339 & -1.5407 & 0.936303 \tabularnewline
12 & -0.262842 & -2.3362 & 0.988991 \tabularnewline
13 & 0.180495 & 1.6043 & 0.056322 \tabularnewline
14 & 0.305461 & 2.715 & 0.004068 \tabularnewline
15 & 0.007271 & 0.0646 & 0.474319 \tabularnewline
16 & -0.016357 & -0.1454 & 0.557611 \tabularnewline
17 & -0.078968 & -0.7019 & 0.757591 \tabularnewline
18 & 0.091989 & 0.8176 & 0.208017 \tabularnewline
19 & -0.023914 & -0.2125 & 0.583887 \tabularnewline
20 & 0.028578 & 0.254 & 0.400075 \tabularnewline
21 & 0.0676 & 0.6008 & 0.274832 \tabularnewline
22 & 0.04756 & 0.4227 & 0.336824 \tabularnewline
23 & 0.229934 & 2.0437 & 0.022158 \tabularnewline
24 & -0.071587 & -0.6363 & 0.736784 \tabularnewline
25 & -0.167801 & -1.4915 & 0.930087 \tabularnewline
26 & -0.183737 & -1.6331 & 0.946785 \tabularnewline
27 & 0.177812 & 1.5804 & 0.059002 \tabularnewline
28 & -0.045066 & -0.4006 & 0.655087 \tabularnewline
29 & 0.102861 & 0.9142 & 0.181685 \tabularnewline
30 & -0.102074 & -0.9073 & 0.816484 \tabularnewline
31 & -0.092587 & -0.8229 & 0.793487 \tabularnewline
32 & 0.048365 & 0.4299 & 0.334229 \tabularnewline
33 & -0.127748 & -1.1355 & 0.87019 \tabularnewline
34 & -0.087615 & -0.7787 & 0.78077 \tabularnewline
35 & -0.103203 & -0.9173 & 0.819108 \tabularnewline
36 & 0.06656 & 0.5916 & 0.277906 \tabularnewline
37 & 0.055301 & 0.4915 & 0.312209 \tabularnewline
38 & 0.020256 & 0.18 & 0.428791 \tabularnewline
39 & -0.145623 & -1.2943 & 0.900338 \tabularnewline
40 & -0.112371 & -0.9988 & 0.839524 \tabularnewline
41 & 0.059483 & 0.5287 & 0.299248 \tabularnewline
42 & 0.010998 & 0.0977 & 0.46119 \tabularnewline
43 & 0.022331 & 0.1985 & 0.421589 \tabularnewline
44 & -0.104461 & -0.9285 & 0.822003 \tabularnewline
45 & -0.060566 & -0.5383 & 0.704067 \tabularnewline
46 & -0.00785 & -0.0698 & 0.527724 \tabularnewline
47 & -0.020386 & -0.1812 & 0.571662 \tabularnewline
48 & -0.054164 & -0.4814 & 0.684227 \tabularnewline
49 & -0.087859 & -0.7809 & 0.781405 \tabularnewline
50 & 0.086978 & 0.7731 & 0.220891 \tabularnewline
51 & -0.081953 & -0.7284 & 0.765742 \tabularnewline
52 & 0.022322 & 0.1984 & 0.42162 \tabularnewline
53 & -0.119442 & -1.0616 & 0.854178 \tabularnewline
54 & -0.041006 & -0.3645 & 0.641759 \tabularnewline
55 & 4.7e-05 & 4e-04 & 0.499834 \tabularnewline
56 & -0.000631 & -0.0056 & 0.502229 \tabularnewline
57 & -0.042745 & -0.3799 & 0.647491 \tabularnewline
58 & -0.022749 & -0.2022 & 0.579861 \tabularnewline
59 & 0.016273 & 0.1446 & 0.442684 \tabularnewline
\hline
\end{tabular}
%Source: https://freestatistics.org/blog/index.php?pk=3932&T=1

[TABLE]
[ROW][C]Autocorrelation Function[/C][/ROW]
[ROW][C]Time lag k[/C][C]ACF(k)[/C][C]T-STAT[/C][C]P-value[/C][/ROW]
[ROW][C]0[/C][C]1[/C][C]8.8882[/C][C]0[/C][/ROW]
[ROW][C]1[/C][C]0.013013[/C][C]0.1157[/C][C]0.454107[/C][/ROW]
[ROW][C]2[/C][C]-0.107516[/C][C]-0.9556[/C][C]0.828911[/C][/ROW]
[ROW][C]3[/C][C]-0.18027[/C][C]-1.6023[/C][C]0.943457[/C][/ROW]
[ROW][C]4[/C][C]0.049894[/C][C]0.4435[/C][C]0.329318[/C][/ROW]
[ROW][C]5[/C][C]0.177782[/C][C]1.5802[/C][C]0.059033[/C][/ROW]
[ROW][C]6[/C][C]0.048203[/C][C]0.4284[/C][C]0.33475[/C][/ROW]
[ROW][C]7[/C][C]0.012861[/C][C]0.1143[/C][C]0.454641[/C][/ROW]
[ROW][C]8[/C][C]0.0886[/C][C]0.7875[/C][C]0.216675[/C][/ROW]
[ROW][C]9[/C][C]0.301993[/C][C]2.6842[/C][C]0.004428[/C][/ROW]
[ROW][C]10[/C][C]-0.059459[/C][C]-0.5285[/C][C]0.700678[/C][/ROW]
[ROW][C]11[/C][C]-0.173339[/C][C]-1.5407[/C][C]0.936303[/C][/ROW]
[ROW][C]12[/C][C]-0.262842[/C][C]-2.3362[/C][C]0.988991[/C][/ROW]
[ROW][C]13[/C][C]0.180495[/C][C]1.6043[/C][C]0.056322[/C][/ROW]
[ROW][C]14[/C][C]0.305461[/C][C]2.715[/C][C]0.004068[/C][/ROW]
[ROW][C]15[/C][C]0.007271[/C][C]0.0646[/C][C]0.474319[/C][/ROW]
[ROW][C]16[/C][C]-0.016357[/C][C]-0.1454[/C][C]0.557611[/C][/ROW]
[ROW][C]17[/C][C]-0.078968[/C][C]-0.7019[/C][C]0.757591[/C][/ROW]
[ROW][C]18[/C][C]0.091989[/C][C]0.8176[/C][C]0.208017[/C][/ROW]
[ROW][C]19[/C][C]-0.023914[/C][C]-0.2125[/C][C]0.583887[/C][/ROW]
[ROW][C]20[/C][C]0.028578[/C][C]0.254[/C][C]0.400075[/C][/ROW]
[ROW][C]21[/C][C]0.0676[/C][C]0.6008[/C][C]0.274832[/C][/ROW]
[ROW][C]22[/C][C]0.04756[/C][C]0.4227[/C][C]0.336824[/C][/ROW]
[ROW][C]23[/C][C]0.229934[/C][C]2.0437[/C][C]0.022158[/C][/ROW]
[ROW][C]24[/C][C]-0.071587[/C][C]-0.6363[/C][C]0.736784[/C][/ROW]
[ROW][C]25[/C][C]-0.167801[/C][C]-1.4915[/C][C]0.930087[/C][/ROW]
[ROW][C]26[/C][C]-0.183737[/C][C]-1.6331[/C][C]0.946785[/C][/ROW]
[ROW][C]27[/C][C]0.177812[/C][C]1.5804[/C][C]0.059002[/C][/ROW]
[ROW][C]28[/C][C]-0.045066[/C][C]-0.4006[/C][C]0.655087[/C][/ROW]
[ROW][C]29[/C][C]0.102861[/C][C]0.9142[/C][C]0.181685[/C][/ROW]
[ROW][C]30[/C][C]-0.102074[/C][C]-0.9073[/C][C]0.816484[/C][/ROW]
[ROW][C]31[/C][C]-0.092587[/C][C]-0.8229[/C][C]0.793487[/C][/ROW]
[ROW][C]32[/C][C]0.048365[/C][C]0.4299[/C][C]0.334229[/C][/ROW]
[ROW][C]33[/C][C]-0.127748[/C][C]-1.1355[/C][C]0.87019[/C][/ROW]
[ROW][C]34[/C][C]-0.087615[/C][C]-0.7787[/C][C]0.78077[/C][/ROW]
[ROW][C]35[/C][C]-0.103203[/C][C]-0.9173[/C][C]0.819108[/C][/ROW]
[ROW][C]36[/C][C]0.06656[/C][C]0.5916[/C][C]0.277906[/C][/ROW]
[ROW][C]37[/C][C]0.055301[/C][C]0.4915[/C][C]0.312209[/C][/ROW]
[ROW][C]38[/C][C]0.020256[/C][C]0.18[/C][C]0.428791[/C][/ROW]
[ROW][C]39[/C][C]-0.145623[/C][C]-1.2943[/C][C]0.900338[/C][/ROW]
[ROW][C]40[/C][C]-0.112371[/C][C]-0.9988[/C][C]0.839524[/C][/ROW]
[ROW][C]41[/C][C]0.059483[/C][C]0.5287[/C][C]0.299248[/C][/ROW]
[ROW][C]42[/C][C]0.010998[/C][C]0.0977[/C][C]0.46119[/C][/ROW]
[ROW][C]43[/C][C]0.022331[/C][C]0.1985[/C][C]0.421589[/C][/ROW]
[ROW][C]44[/C][C]-0.104461[/C][C]-0.9285[/C][C]0.822003[/C][/ROW]
[ROW][C]45[/C][C]-0.060566[/C][C]-0.5383[/C][C]0.704067[/C][/ROW]
[ROW][C]46[/C][C]-0.00785[/C][C]-0.0698[/C][C]0.527724[/C][/ROW]
[ROW][C]47[/C][C]-0.020386[/C][C]-0.1812[/C][C]0.571662[/C][/ROW]
[ROW][C]48[/C][C]-0.054164[/C][C]-0.4814[/C][C]0.684227[/C][/ROW]
[ROW][C]49[/C][C]-0.087859[/C][C]-0.7809[/C][C]0.781405[/C][/ROW]
[ROW][C]50[/C][C]0.086978[/C][C]0.7731[/C][C]0.220891[/C][/ROW]
[ROW][C]51[/C][C]-0.081953[/C][C]-0.7284[/C][C]0.765742[/C][/ROW]
[ROW][C]52[/C][C]0.022322[/C][C]0.1984[/C][C]0.42162[/C][/ROW]
[ROW][C]53[/C][C]-0.119442[/C][C]-1.0616[/C][C]0.854178[/C][/ROW]
[ROW][C]54[/C][C]-0.041006[/C][C]-0.3645[/C][C]0.641759[/C][/ROW]
[ROW][C]55[/C][C]4.7e-05[/C][C]4e-04[/C][C]0.499834[/C][/ROW]
[ROW][C]56[/C][C]-0.000631[/C][C]-0.0056[/C][C]0.502229[/C][/ROW]
[ROW][C]57[/C][C]-0.042745[/C][C]-0.3799[/C][C]0.647491[/C][/ROW]
[ROW][C]58[/C][C]-0.022749[/C][C]-0.2022[/C][C]0.579861[/C][/ROW]
[ROW][C]59[/C][C]0.016273[/C][C]0.1446[/C][C]0.442684[/C][/ROW]
[/TABLE]
Source: https://freestatistics.org/blog/index.php?pk=3932&T=1

Globally Unique Identifier (entire table): ba.freestatistics.org/blog/index.php?pk=3932&T=1

As an alternative you can also use a QR Code:  

The GUIDs for individual cells are displayed in the table below:

Autocorrelation Function
Time lag kACF(k)T-STATP-value
018.88820
10.0130130.11570.454107
2-0.107516-0.95560.828911
3-0.18027-1.60230.943457
40.0498940.44350.329318
50.1777821.58020.059033
60.0482030.42840.33475
70.0128610.11430.454641
80.08860.78750.216675
90.3019932.68420.004428
10-0.059459-0.52850.700678
11-0.173339-1.54070.936303
12-0.262842-2.33620.988991
130.1804951.60430.056322
140.3054612.7150.004068
150.0072710.06460.474319
16-0.016357-0.14540.557611
17-0.078968-0.70190.757591
180.0919890.81760.208017
19-0.023914-0.21250.583887
200.0285780.2540.400075
210.06760.60080.274832
220.047560.42270.336824
230.2299342.04370.022158
24-0.071587-0.63630.736784
25-0.167801-1.49150.930087
26-0.183737-1.63310.946785
270.1778121.58040.059002
28-0.045066-0.40060.655087
290.1028610.91420.181685
30-0.102074-0.90730.816484
31-0.092587-0.82290.793487
320.0483650.42990.334229
33-0.127748-1.13550.87019
34-0.087615-0.77870.78077
35-0.103203-0.91730.819108
360.066560.59160.277906
370.0553010.49150.312209
380.0202560.180.428791
39-0.145623-1.29430.900338
40-0.112371-0.99880.839524
410.0594830.52870.299248
420.0109980.09770.46119
430.0223310.19850.421589
44-0.104461-0.92850.822003
45-0.060566-0.53830.704067
46-0.00785-0.06980.527724
47-0.020386-0.18120.571662
48-0.054164-0.48140.684227
49-0.087859-0.78090.781405
500.0869780.77310.220891
51-0.081953-0.72840.765742
520.0223220.19840.42162
53-0.119442-1.06160.854178
54-0.041006-0.36450.641759
554.7e-054e-040.499834
56-0.000631-0.00560.502229
57-0.042745-0.37990.647491
58-0.022749-0.20220.579861
590.0162730.14460.442684


Partial Autocorrelation Function
Time lag kPACF(k)T-STATP-value
00.0130130.11570.454107
1-0.107704-0.95730.82933
2-0.17943-1.59480.942626
30.0418670.37210.355399
40.1463031.30040.098627
50.027240.24210.40466
60.0619980.5510.291578
70.1596411.41890.079928
80.3411563.03230.001641
9-0.034645-0.30790.620527
10-0.11562-1.02770.846375
11-0.251591-2.23620.98592
120.0544110.48360.314997
130.1494961.32870.093878
14-0.067921-0.60370.726111
150.0881940.78390.217724
160.0375350.33360.369777
170.0422290.37530.354207
18-0.023752-0.21110.583328
190.1236951.09940.137461
200.2072891.84240.034582
21-0.140002-1.24440.891478
220.0889640.79070.215736
23-0.045861-0.40760.657673
24-0.141218-1.25520.893442
25-0.201932-1.79480.961745
260.0283570.2520.400831
27-0.205907-1.83010.9645
28-0.010561-0.09390.537275
29-0.122339-1.08740.859912
30-0.05867-0.52150.698252
310.0731820.65050.258644
32-0.001942-0.01730.506865
33-0.091353-0.8120.790372
340.0049460.0440.482525
35-0.071849-0.63860.737539
36-0.094761-0.84230.798906
37-0.006628-0.05890.523413
380.0575440.51150.305227
39-0.127787-1.13580.870261
400.0355180.31570.376534
410.0988260.87840.1912
420.0156770.13930.444767
43-0.017829-0.15850.562754
44-0.035717-0.31750.624135
45-0.018769-0.16680.566032
46-0.020557-0.18270.572256
470.0197070.17520.4307
480.0715380.63580.263358
490.0600850.5340.297404
50-0.040512-0.36010.640126
510.005710.05080.479825
520.0802230.7130.238963
530.0763960.6790.249555
54-0.008221-0.07310.529031
55-0.098318-0.87390.80758
56-0.009776-0.08690.534513
57-0.032443-0.28840.613087
58-0.123536-1.0980.862233
590.0303080.26940.394169

\begin{tabular}{lllllllll}
\hline
Partial Autocorrelation Function \tabularnewline
Time lag k & PACF(k) & T-STAT & P-value \tabularnewline
0 & 0.013013 & 0.1157 & 0.454107 \tabularnewline
1 & -0.107704 & -0.9573 & 0.82933 \tabularnewline
2 & -0.17943 & -1.5948 & 0.942626 \tabularnewline
3 & 0.041867 & 0.3721 & 0.355399 \tabularnewline
4 & 0.146303 & 1.3004 & 0.098627 \tabularnewline
5 & 0.02724 & 0.2421 & 0.40466 \tabularnewline
6 & 0.061998 & 0.551 & 0.291578 \tabularnewline
7 & 0.159641 & 1.4189 & 0.079928 \tabularnewline
8 & 0.341156 & 3.0323 & 0.001641 \tabularnewline
9 & -0.034645 & -0.3079 & 0.620527 \tabularnewline
10 & -0.11562 & -1.0277 & 0.846375 \tabularnewline
11 & -0.251591 & -2.2362 & 0.98592 \tabularnewline
12 & 0.054411 & 0.4836 & 0.314997 \tabularnewline
13 & 0.149496 & 1.3287 & 0.093878 \tabularnewline
14 & -0.067921 & -0.6037 & 0.726111 \tabularnewline
15 & 0.088194 & 0.7839 & 0.217724 \tabularnewline
16 & 0.037535 & 0.3336 & 0.369777 \tabularnewline
17 & 0.042229 & 0.3753 & 0.354207 \tabularnewline
18 & -0.023752 & -0.2111 & 0.583328 \tabularnewline
19 & 0.123695 & 1.0994 & 0.137461 \tabularnewline
20 & 0.207289 & 1.8424 & 0.034582 \tabularnewline
21 & -0.140002 & -1.2444 & 0.891478 \tabularnewline
22 & 0.088964 & 0.7907 & 0.215736 \tabularnewline
23 & -0.045861 & -0.4076 & 0.657673 \tabularnewline
24 & -0.141218 & -1.2552 & 0.893442 \tabularnewline
25 & -0.201932 & -1.7948 & 0.961745 \tabularnewline
26 & 0.028357 & 0.252 & 0.400831 \tabularnewline
27 & -0.205907 & -1.8301 & 0.9645 \tabularnewline
28 & -0.010561 & -0.0939 & 0.537275 \tabularnewline
29 & -0.122339 & -1.0874 & 0.859912 \tabularnewline
30 & -0.05867 & -0.5215 & 0.698252 \tabularnewline
31 & 0.073182 & 0.6505 & 0.258644 \tabularnewline
32 & -0.001942 & -0.0173 & 0.506865 \tabularnewline
33 & -0.091353 & -0.812 & 0.790372 \tabularnewline
34 & 0.004946 & 0.044 & 0.482525 \tabularnewline
35 & -0.071849 & -0.6386 & 0.737539 \tabularnewline
36 & -0.094761 & -0.8423 & 0.798906 \tabularnewline
37 & -0.006628 & -0.0589 & 0.523413 \tabularnewline
38 & 0.057544 & 0.5115 & 0.305227 \tabularnewline
39 & -0.127787 & -1.1358 & 0.870261 \tabularnewline
40 & 0.035518 & 0.3157 & 0.376534 \tabularnewline
41 & 0.098826 & 0.8784 & 0.1912 \tabularnewline
42 & 0.015677 & 0.1393 & 0.444767 \tabularnewline
43 & -0.017829 & -0.1585 & 0.562754 \tabularnewline
44 & -0.035717 & -0.3175 & 0.624135 \tabularnewline
45 & -0.018769 & -0.1668 & 0.566032 \tabularnewline
46 & -0.020557 & -0.1827 & 0.572256 \tabularnewline
47 & 0.019707 & 0.1752 & 0.4307 \tabularnewline
48 & 0.071538 & 0.6358 & 0.263358 \tabularnewline
49 & 0.060085 & 0.534 & 0.297404 \tabularnewline
50 & -0.040512 & -0.3601 & 0.640126 \tabularnewline
51 & 0.00571 & 0.0508 & 0.479825 \tabularnewline
52 & 0.080223 & 0.713 & 0.238963 \tabularnewline
53 & 0.076396 & 0.679 & 0.249555 \tabularnewline
54 & -0.008221 & -0.0731 & 0.529031 \tabularnewline
55 & -0.098318 & -0.8739 & 0.80758 \tabularnewline
56 & -0.009776 & -0.0869 & 0.534513 \tabularnewline
57 & -0.032443 & -0.2884 & 0.613087 \tabularnewline
58 & -0.123536 & -1.098 & 0.862233 \tabularnewline
59 & 0.030308 & 0.2694 & 0.394169 \tabularnewline
\hline
\end{tabular}
%Source: https://freestatistics.org/blog/index.php?pk=3932&T=2

[TABLE]
[ROW][C]Partial Autocorrelation Function[/C][/ROW]
[ROW][C]Time lag k[/C][C]PACF(k)[/C][C]T-STAT[/C][C]P-value[/C][/ROW]
[ROW][C]0[/C][C]0.013013[/C][C]0.1157[/C][C]0.454107[/C][/ROW]
[ROW][C]1[/C][C]-0.107704[/C][C]-0.9573[/C][C]0.82933[/C][/ROW]
[ROW][C]2[/C][C]-0.17943[/C][C]-1.5948[/C][C]0.942626[/C][/ROW]
[ROW][C]3[/C][C]0.041867[/C][C]0.3721[/C][C]0.355399[/C][/ROW]
[ROW][C]4[/C][C]0.146303[/C][C]1.3004[/C][C]0.098627[/C][/ROW]
[ROW][C]5[/C][C]0.02724[/C][C]0.2421[/C][C]0.40466[/C][/ROW]
[ROW][C]6[/C][C]0.061998[/C][C]0.551[/C][C]0.291578[/C][/ROW]
[ROW][C]7[/C][C]0.159641[/C][C]1.4189[/C][C]0.079928[/C][/ROW]
[ROW][C]8[/C][C]0.341156[/C][C]3.0323[/C][C]0.001641[/C][/ROW]
[ROW][C]9[/C][C]-0.034645[/C][C]-0.3079[/C][C]0.620527[/C][/ROW]
[ROW][C]10[/C][C]-0.11562[/C][C]-1.0277[/C][C]0.846375[/C][/ROW]
[ROW][C]11[/C][C]-0.251591[/C][C]-2.2362[/C][C]0.98592[/C][/ROW]
[ROW][C]12[/C][C]0.054411[/C][C]0.4836[/C][C]0.314997[/C][/ROW]
[ROW][C]13[/C][C]0.149496[/C][C]1.3287[/C][C]0.093878[/C][/ROW]
[ROW][C]14[/C][C]-0.067921[/C][C]-0.6037[/C][C]0.726111[/C][/ROW]
[ROW][C]15[/C][C]0.088194[/C][C]0.7839[/C][C]0.217724[/C][/ROW]
[ROW][C]16[/C][C]0.037535[/C][C]0.3336[/C][C]0.369777[/C][/ROW]
[ROW][C]17[/C][C]0.042229[/C][C]0.3753[/C][C]0.354207[/C][/ROW]
[ROW][C]18[/C][C]-0.023752[/C][C]-0.2111[/C][C]0.583328[/C][/ROW]
[ROW][C]19[/C][C]0.123695[/C][C]1.0994[/C][C]0.137461[/C][/ROW]
[ROW][C]20[/C][C]0.207289[/C][C]1.8424[/C][C]0.034582[/C][/ROW]
[ROW][C]21[/C][C]-0.140002[/C][C]-1.2444[/C][C]0.891478[/C][/ROW]
[ROW][C]22[/C][C]0.088964[/C][C]0.7907[/C][C]0.215736[/C][/ROW]
[ROW][C]23[/C][C]-0.045861[/C][C]-0.4076[/C][C]0.657673[/C][/ROW]
[ROW][C]24[/C][C]-0.141218[/C][C]-1.2552[/C][C]0.893442[/C][/ROW]
[ROW][C]25[/C][C]-0.201932[/C][C]-1.7948[/C][C]0.961745[/C][/ROW]
[ROW][C]26[/C][C]0.028357[/C][C]0.252[/C][C]0.400831[/C][/ROW]
[ROW][C]27[/C][C]-0.205907[/C][C]-1.8301[/C][C]0.9645[/C][/ROW]
[ROW][C]28[/C][C]-0.010561[/C][C]-0.0939[/C][C]0.537275[/C][/ROW]
[ROW][C]29[/C][C]-0.122339[/C][C]-1.0874[/C][C]0.859912[/C][/ROW]
[ROW][C]30[/C][C]-0.05867[/C][C]-0.5215[/C][C]0.698252[/C][/ROW]
[ROW][C]31[/C][C]0.073182[/C][C]0.6505[/C][C]0.258644[/C][/ROW]
[ROW][C]32[/C][C]-0.001942[/C][C]-0.0173[/C][C]0.506865[/C][/ROW]
[ROW][C]33[/C][C]-0.091353[/C][C]-0.812[/C][C]0.790372[/C][/ROW]
[ROW][C]34[/C][C]0.004946[/C][C]0.044[/C][C]0.482525[/C][/ROW]
[ROW][C]35[/C][C]-0.071849[/C][C]-0.6386[/C][C]0.737539[/C][/ROW]
[ROW][C]36[/C][C]-0.094761[/C][C]-0.8423[/C][C]0.798906[/C][/ROW]
[ROW][C]37[/C][C]-0.006628[/C][C]-0.0589[/C][C]0.523413[/C][/ROW]
[ROW][C]38[/C][C]0.057544[/C][C]0.5115[/C][C]0.305227[/C][/ROW]
[ROW][C]39[/C][C]-0.127787[/C][C]-1.1358[/C][C]0.870261[/C][/ROW]
[ROW][C]40[/C][C]0.035518[/C][C]0.3157[/C][C]0.376534[/C][/ROW]
[ROW][C]41[/C][C]0.098826[/C][C]0.8784[/C][C]0.1912[/C][/ROW]
[ROW][C]42[/C][C]0.015677[/C][C]0.1393[/C][C]0.444767[/C][/ROW]
[ROW][C]43[/C][C]-0.017829[/C][C]-0.1585[/C][C]0.562754[/C][/ROW]
[ROW][C]44[/C][C]-0.035717[/C][C]-0.3175[/C][C]0.624135[/C][/ROW]
[ROW][C]45[/C][C]-0.018769[/C][C]-0.1668[/C][C]0.566032[/C][/ROW]
[ROW][C]46[/C][C]-0.020557[/C][C]-0.1827[/C][C]0.572256[/C][/ROW]
[ROW][C]47[/C][C]0.019707[/C][C]0.1752[/C][C]0.4307[/C][/ROW]
[ROW][C]48[/C][C]0.071538[/C][C]0.6358[/C][C]0.263358[/C][/ROW]
[ROW][C]49[/C][C]0.060085[/C][C]0.534[/C][C]0.297404[/C][/ROW]
[ROW][C]50[/C][C]-0.040512[/C][C]-0.3601[/C][C]0.640126[/C][/ROW]
[ROW][C]51[/C][C]0.00571[/C][C]0.0508[/C][C]0.479825[/C][/ROW]
[ROW][C]52[/C][C]0.080223[/C][C]0.713[/C][C]0.238963[/C][/ROW]
[ROW][C]53[/C][C]0.076396[/C][C]0.679[/C][C]0.249555[/C][/ROW]
[ROW][C]54[/C][C]-0.008221[/C][C]-0.0731[/C][C]0.529031[/C][/ROW]
[ROW][C]55[/C][C]-0.098318[/C][C]-0.8739[/C][C]0.80758[/C][/ROW]
[ROW][C]56[/C][C]-0.009776[/C][C]-0.0869[/C][C]0.534513[/C][/ROW]
[ROW][C]57[/C][C]-0.032443[/C][C]-0.2884[/C][C]0.613087[/C][/ROW]
[ROW][C]58[/C][C]-0.123536[/C][C]-1.098[/C][C]0.862233[/C][/ROW]
[ROW][C]59[/C][C]0.030308[/C][C]0.2694[/C][C]0.394169[/C][/ROW]
[/TABLE]
Source: https://freestatistics.org/blog/index.php?pk=3932&T=2

Globally Unique Identifier (entire table): ba.freestatistics.org/blog/index.php?pk=3932&T=2

As an alternative you can also use a QR Code:  

The GUIDs for individual cells are displayed in the table below:

Partial Autocorrelation Function
Time lag kPACF(k)T-STATP-value
00.0130130.11570.454107
1-0.107704-0.95730.82933
2-0.17943-1.59480.942626
30.0418670.37210.355399
40.1463031.30040.098627
50.027240.24210.40466
60.0619980.5510.291578
70.1596411.41890.079928
80.3411563.03230.001641
9-0.034645-0.30790.620527
10-0.11562-1.02770.846375
11-0.251591-2.23620.98592
120.0544110.48360.314997
130.1494961.32870.093878
14-0.067921-0.60370.726111
150.0881940.78390.217724
160.0375350.33360.369777
170.0422290.37530.354207
18-0.023752-0.21110.583328
190.1236951.09940.137461
200.2072891.84240.034582
21-0.140002-1.24440.891478
220.0889640.79070.215736
23-0.045861-0.40760.657673
24-0.141218-1.25520.893442
25-0.201932-1.79480.961745
260.0283570.2520.400831
27-0.205907-1.83010.9645
28-0.010561-0.09390.537275
29-0.122339-1.08740.859912
30-0.05867-0.52150.698252
310.0731820.65050.258644
32-0.001942-0.01730.506865
33-0.091353-0.8120.790372
340.0049460.0440.482525
35-0.071849-0.63860.737539
36-0.094761-0.84230.798906
37-0.006628-0.05890.523413
380.0575440.51150.305227
39-0.127787-1.13580.870261
400.0355180.31570.376534
410.0988260.87840.1912
420.0156770.13930.444767
43-0.017829-0.15850.562754
44-0.035717-0.31750.624135
45-0.018769-0.16680.566032
46-0.020557-0.18270.572256
470.0197070.17520.4307
480.0715380.63580.263358
490.0600850.5340.297404
50-0.040512-0.36010.640126
510.005710.05080.479825
520.0802230.7130.238963
530.0763960.6790.249555
54-0.008221-0.07310.529031
55-0.098318-0.87390.80758
56-0.009776-0.08690.534513
57-0.032443-0.28840.613087
58-0.123536-1.0980.862233
590.0303080.26940.394169


Parameters (Session):
par1 = 60 ; par2 = 1 ; par3 = 1 ; par4 = 1 ; par5 = 12 ;
Parameters (R input):
par1 = 60 ; par2 = 1 ; par3 = 1 ; par4 = 1 ; par5 = 12 ;
R code (references can be found in the software module):
if (par1 == 'Default') {
par1 = 10*log10(length(x))
} else {
par1 <- as.numeric(par1)
}
par2 <- as.numeric(par2)
par3 <- as.numeric(par3)
par4 <- as.numeric(par4)
par5 <- as.numeric(par5)
if (par2 == 0) {
x <- log(x)
} else {
x <- (x ^ par2 - 1) / par2
}
if (par3 > 0) x <- diff(x,lag=1,difference=par3)
if (par4 > 0) x <- diff(x,lag=par5,difference=par4)
bitmap(file='pic1.png')
racf <- acf(x,par1,main='Autocorrelation',xlab='lags',ylab='ACF')
dev.off()
bitmap(file='pic2.png')
rpacf <- pacf(x,par1,main='Partial Autocorrelation',xlab='lags',ylab='PACF')
dev.off()
(myacf <- c(racf$acf))
(mypacf <- c(rpacf$acf))
lengthx <- length(x)
sqrtn <- sqrt(lengthx)
load(file='createtable')
a<-table.start()
a<-table.row.start(a)
a<-table.element(a,'Autocorrelation Function',4,TRUE)
a<-table.row.end(a)
a<-table.row.start(a)
a<-table.element(a,'Time lag k',header=TRUE)
a<-table.element(a,hyperlink('basics.htm','ACF(k)','click here for more information about the Autocorrelation Function'),header=TRUE)
a<-table.element(a,'T-STAT',header=TRUE)
a<-table.element(a,'P-value',header=TRUE)
a<-table.row.end(a)
for (i in 1:par1) {
a<-table.row.start(a)
a<-table.element(a,i-1,header=TRUE)
a<-table.element(a,round(myacf[i],6))
mytstat <- myacf[i]*sqrtn
a<-table.element(a,round(mytstat,4))
a<-table.element(a,round(1-pt(mytstat,lengthx),6))
a<-table.row.end(a)
}
a<-table.end(a)
table.save(a,file='mytable.tab')
a<-table.start()
a<-table.row.start(a)
a<-table.element(a,'Partial Autocorrelation Function',4,TRUE)
a<-table.row.end(a)
a<-table.row.start(a)
a<-table.element(a,'Time lag k',header=TRUE)
a<-table.element(a,hyperlink('basics.htm','PACF(k)','click here for more information about the Partial Autocorrelation Function'),header=TRUE)
a<-table.element(a,'T-STAT',header=TRUE)
a<-table.element(a,'P-value',header=TRUE)
a<-table.row.end(a)
for (i in 1:par1) {
a<-table.row.start(a)
a<-table.element(a,i-1,header=TRUE)
a<-table.element(a,round(mypacf[i],6))
mytstat <- mypacf[i]*sqrtn
a<-table.element(a,round(mytstat,4))
a<-table.element(a,round(1-pt(mytstat,lengthx),6))
a<-table.row.end(a)
}
a<-table.end(a)
table.save(a,file='mytable1.tab')