Free Statistics

of Irreproducible Research!

Author's title

Author*Unverified author*
R Software Modulerwasp_autocorrelation.wasp
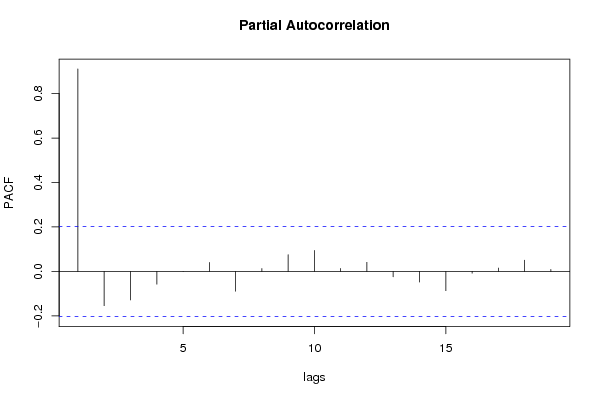
Title produced by software(Partial) Autocorrelation Function
Date of computationFri, 14 Dec 2007 03:32:50 -0700
Cite this page as followsStatistical Computations at FreeStatistics.org, Office for Research Development and Education, URL https://freestatistics.org/blog/index.php?v=date/2007/Dec/14/t119762809870hrozboito33jc.htm/, Retrieved Thu, 02 May 2024 21:21:32 +0000
Statistical Computations at FreeStatistics.org, Office for Research Development and Education, URL https://freestatistics.org/blog/index.php?pk=3827, Retrieved Thu, 02 May 2024 21:21:32 +0000
QR Codes:

Original text written by user:
IsPrivate?No (this computation is public)
User-defined keywords
Estimated Impact175
Family? (F = Feedback message, R = changed R code, M = changed R Module, P = changed Parameters, D = changed Data)
-       [(Partial) Autocorrelation Function] [oliezaden] [2007-12-14 10:32:50] [a98121933c09d0d44a9f89053acd1df1] [Current]
Feedback Forum

Post a new message
Dataseries X:
99.5
101.6
103.9
106.6
108.3
102
93.8
91.6
97.7
94.8
98
103.8
97.8
91.2
89.3
87.5
90.4
94.2
102.2
101.3
96
90.8
93.2
90.9
91.1
90.2
94.3
96
99
103.3
113.1
112.8
112.1
107.4
111
110.5
110.8
112.4
111.5
116.2
122.5
121.3
113.9
110.7
120.8
141.1
147.4
148
158.1
165
187
190.3
182.4
168.8
151.2
120.1
112.5
106.2
107.1
108.5
106.5
108.3
125.6
124
127.2
136.9
135.8
124.3
115.4
113.6
114.4
118.4
117
116.5
115.4
113.6
117.4
116.9
116.4
111.1
110.2
118.9
131.8
130.6
138.3
148.4
148.7
144.3
152.5
162.9
167.2
166.5
185.6


Summary of compuational transaction
Raw Inputview raw input (R code)
Raw Outputview raw output of R engine
Computing time2 seconds
R Server'Herman Ole Andreas Wold' @ 193.190.124.10:1001

\begin{tabular}{lllllllll}
\hline
Summary of compuational transaction \tabularnewline
Raw Input & view raw input (R code)  \tabularnewline
Raw Output & view raw output of R engine  \tabularnewline
Computing time & 2 seconds \tabularnewline
R Server & 'Herman Ole Andreas Wold' @ 193.190.124.10:1001 \tabularnewline
\hline
\end{tabular}
%Source: https://freestatistics.org/blog/index.php?pk=3827&T=0

[TABLE]
[ROW][C]Summary of compuational transaction[/C][/ROW]
[ROW][C]Raw Input[/C][C]view raw input (R code) [/C][/ROW]
[ROW][C]Raw Output[/C][C]view raw output of R engine [/C][/ROW]
[ROW][C]Computing time[/C][C]2 seconds[/C][/ROW]
[ROW][C]R Server[/C][C]'Herman Ole Andreas Wold' @ 193.190.124.10:1001[/C][/ROW]
[/TABLE]
Source: https://freestatistics.org/blog/index.php?pk=3827&T=0

Globally Unique Identifier (entire table): ba.freestatistics.org/blog/index.php?pk=3827&T=0

As an alternative you can also use a QR Code:  

The GUIDs for individual cells are displayed in the table below:

Summary of compuational transaction
Raw Inputview raw input (R code)
Raw Outputview raw output of R engine
Computing time2 seconds
R Server'Herman Ole Andreas Wold' @ 193.190.124.10:1001


Autocorrelation Function
Time lag kACF(k)T-STATP-value
019.64370
10.9107528.7830
20.8032377.74610
30.682686.58350
40.5624665.42420
50.4544134.38221.5e-05
60.3673523.54260.000311
70.281312.71290.003974
80.2110732.03550.022322
90.1648891.59010.057599
100.145671.40480.081708
110.1399931.350.09014
120.1498011.44460.075962
130.1570061.51410.066694
140.154311.48810.070053
150.134331.29540.099189
160.1101241.0620.145493
170.0844160.81410.20884
180.0671790.64790.259339

\begin{tabular}{lllllllll}
\hline
Autocorrelation Function \tabularnewline
Time lag k & ACF(k) & T-STAT & P-value \tabularnewline
0 & 1 & 9.6437 & 0 \tabularnewline
1 & 0.910752 & 8.783 & 0 \tabularnewline
2 & 0.803237 & 7.7461 & 0 \tabularnewline
3 & 0.68268 & 6.5835 & 0 \tabularnewline
4 & 0.562466 & 5.4242 & 0 \tabularnewline
5 & 0.454413 & 4.3822 & 1.5e-05 \tabularnewline
6 & 0.367352 & 3.5426 & 0.000311 \tabularnewline
7 & 0.28131 & 2.7129 & 0.003974 \tabularnewline
8 & 0.211073 & 2.0355 & 0.022322 \tabularnewline
9 & 0.164889 & 1.5901 & 0.057599 \tabularnewline
10 & 0.14567 & 1.4048 & 0.081708 \tabularnewline
11 & 0.139993 & 1.35 & 0.09014 \tabularnewline
12 & 0.149801 & 1.4446 & 0.075962 \tabularnewline
13 & 0.157006 & 1.5141 & 0.066694 \tabularnewline
14 & 0.15431 & 1.4881 & 0.070053 \tabularnewline
15 & 0.13433 & 1.2954 & 0.099189 \tabularnewline
16 & 0.110124 & 1.062 & 0.145493 \tabularnewline
17 & 0.084416 & 0.8141 & 0.20884 \tabularnewline
18 & 0.067179 & 0.6479 & 0.259339 \tabularnewline
\hline
\end{tabular}
%Source: https://freestatistics.org/blog/index.php?pk=3827&T=1

[TABLE]
[ROW][C]Autocorrelation Function[/C][/ROW]
[ROW][C]Time lag k[/C][C]ACF(k)[/C][C]T-STAT[/C][C]P-value[/C][/ROW]
[ROW][C]0[/C][C]1[/C][C]9.6437[/C][C]0[/C][/ROW]
[ROW][C]1[/C][C]0.910752[/C][C]8.783[/C][C]0[/C][/ROW]
[ROW][C]2[/C][C]0.803237[/C][C]7.7461[/C][C]0[/C][/ROW]
[ROW][C]3[/C][C]0.68268[/C][C]6.5835[/C][C]0[/C][/ROW]
[ROW][C]4[/C][C]0.562466[/C][C]5.4242[/C][C]0[/C][/ROW]
[ROW][C]5[/C][C]0.454413[/C][C]4.3822[/C][C]1.5e-05[/C][/ROW]
[ROW][C]6[/C][C]0.367352[/C][C]3.5426[/C][C]0.000311[/C][/ROW]
[ROW][C]7[/C][C]0.28131[/C][C]2.7129[/C][C]0.003974[/C][/ROW]
[ROW][C]8[/C][C]0.211073[/C][C]2.0355[/C][C]0.022322[/C][/ROW]
[ROW][C]9[/C][C]0.164889[/C][C]1.5901[/C][C]0.057599[/C][/ROW]
[ROW][C]10[/C][C]0.14567[/C][C]1.4048[/C][C]0.081708[/C][/ROW]
[ROW][C]11[/C][C]0.139993[/C][C]1.35[/C][C]0.09014[/C][/ROW]
[ROW][C]12[/C][C]0.149801[/C][C]1.4446[/C][C]0.075962[/C][/ROW]
[ROW][C]13[/C][C]0.157006[/C][C]1.5141[/C][C]0.066694[/C][/ROW]
[ROW][C]14[/C][C]0.15431[/C][C]1.4881[/C][C]0.070053[/C][/ROW]
[ROW][C]15[/C][C]0.13433[/C][C]1.2954[/C][C]0.099189[/C][/ROW]
[ROW][C]16[/C][C]0.110124[/C][C]1.062[/C][C]0.145493[/C][/ROW]
[ROW][C]17[/C][C]0.084416[/C][C]0.8141[/C][C]0.20884[/C][/ROW]
[ROW][C]18[/C][C]0.067179[/C][C]0.6479[/C][C]0.259339[/C][/ROW]
[/TABLE]
Source: https://freestatistics.org/blog/index.php?pk=3827&T=1

Globally Unique Identifier (entire table): ba.freestatistics.org/blog/index.php?pk=3827&T=1

As an alternative you can also use a QR Code:  

The GUIDs for individual cells are displayed in the table below:

Autocorrelation Function
Time lag kACF(k)T-STATP-value
019.64370
10.9107528.7830
20.8032377.74610
30.682686.58350
40.5624665.42420
50.4544134.38221.5e-05
60.3673523.54260.000311
70.281312.71290.003974
80.2110732.03550.022322
90.1648891.59010.057599
100.145671.40480.081708
110.1399931.350.09014
120.1498011.44460.075962
130.1570061.51410.066694
140.154311.48810.070053
150.134331.29540.099189
160.1101241.0620.145493
170.0844160.81410.20884
180.0671790.64790.259339


Partial Autocorrelation Function
Time lag kPACF(k)T-STATP-value
00.9107528.7830
1-0.15382-1.48340.929324
2-0.127956-1.2340.889837
3-0.057409-0.55360.709421
40.000250.00240.499043
50.0406870.39240.347841
6-0.088762-0.8560.802898
70.0129840.12520.450314
80.0757040.73010.233593
90.0948080.91430.181462
100.0135460.13060.448173
110.0409190.39460.347018
12-0.024301-0.23440.592388
13-0.047547-0.45850.676177
14-0.086436-0.83360.796668
15-0.007891-0.07610.530246
160.0155650.15010.440504
170.0505430.48740.313555
180.009220.08890.46467

\begin{tabular}{lllllllll}
\hline
Partial Autocorrelation Function \tabularnewline
Time lag k & PACF(k) & T-STAT & P-value \tabularnewline
0 & 0.910752 & 8.783 & 0 \tabularnewline
1 & -0.15382 & -1.4834 & 0.929324 \tabularnewline
2 & -0.127956 & -1.234 & 0.889837 \tabularnewline
3 & -0.057409 & -0.5536 & 0.709421 \tabularnewline
4 & 0.00025 & 0.0024 & 0.499043 \tabularnewline
5 & 0.040687 & 0.3924 & 0.347841 \tabularnewline
6 & -0.088762 & -0.856 & 0.802898 \tabularnewline
7 & 0.012984 & 0.1252 & 0.450314 \tabularnewline
8 & 0.075704 & 0.7301 & 0.233593 \tabularnewline
9 & 0.094808 & 0.9143 & 0.181462 \tabularnewline
10 & 0.013546 & 0.1306 & 0.448173 \tabularnewline
11 & 0.040919 & 0.3946 & 0.347018 \tabularnewline
12 & -0.024301 & -0.2344 & 0.592388 \tabularnewline
13 & -0.047547 & -0.4585 & 0.676177 \tabularnewline
14 & -0.086436 & -0.8336 & 0.796668 \tabularnewline
15 & -0.007891 & -0.0761 & 0.530246 \tabularnewline
16 & 0.015565 & 0.1501 & 0.440504 \tabularnewline
17 & 0.050543 & 0.4874 & 0.313555 \tabularnewline
18 & 0.00922 & 0.0889 & 0.46467 \tabularnewline
\hline
\end{tabular}
%Source: https://freestatistics.org/blog/index.php?pk=3827&T=2

[TABLE]
[ROW][C]Partial Autocorrelation Function[/C][/ROW]
[ROW][C]Time lag k[/C][C]PACF(k)[/C][C]T-STAT[/C][C]P-value[/C][/ROW]
[ROW][C]0[/C][C]0.910752[/C][C]8.783[/C][C]0[/C][/ROW]
[ROW][C]1[/C][C]-0.15382[/C][C]-1.4834[/C][C]0.929324[/C][/ROW]
[ROW][C]2[/C][C]-0.127956[/C][C]-1.234[/C][C]0.889837[/C][/ROW]
[ROW][C]3[/C][C]-0.057409[/C][C]-0.5536[/C][C]0.709421[/C][/ROW]
[ROW][C]4[/C][C]0.00025[/C][C]0.0024[/C][C]0.499043[/C][/ROW]
[ROW][C]5[/C][C]0.040687[/C][C]0.3924[/C][C]0.347841[/C][/ROW]
[ROW][C]6[/C][C]-0.088762[/C][C]-0.856[/C][C]0.802898[/C][/ROW]
[ROW][C]7[/C][C]0.012984[/C][C]0.1252[/C][C]0.450314[/C][/ROW]
[ROW][C]8[/C][C]0.075704[/C][C]0.7301[/C][C]0.233593[/C][/ROW]
[ROW][C]9[/C][C]0.094808[/C][C]0.9143[/C][C]0.181462[/C][/ROW]
[ROW][C]10[/C][C]0.013546[/C][C]0.1306[/C][C]0.448173[/C][/ROW]
[ROW][C]11[/C][C]0.040919[/C][C]0.3946[/C][C]0.347018[/C][/ROW]
[ROW][C]12[/C][C]-0.024301[/C][C]-0.2344[/C][C]0.592388[/C][/ROW]
[ROW][C]13[/C][C]-0.047547[/C][C]-0.4585[/C][C]0.676177[/C][/ROW]
[ROW][C]14[/C][C]-0.086436[/C][C]-0.8336[/C][C]0.796668[/C][/ROW]
[ROW][C]15[/C][C]-0.007891[/C][C]-0.0761[/C][C]0.530246[/C][/ROW]
[ROW][C]16[/C][C]0.015565[/C][C]0.1501[/C][C]0.440504[/C][/ROW]
[ROW][C]17[/C][C]0.050543[/C][C]0.4874[/C][C]0.313555[/C][/ROW]
[ROW][C]18[/C][C]0.00922[/C][C]0.0889[/C][C]0.46467[/C][/ROW]
[/TABLE]
Source: https://freestatistics.org/blog/index.php?pk=3827&T=2

Globally Unique Identifier (entire table): ba.freestatistics.org/blog/index.php?pk=3827&T=2

As an alternative you can also use a QR Code:  

The GUIDs for individual cells are displayed in the table below:

Partial Autocorrelation Function
Time lag kPACF(k)T-STATP-value
00.9107528.7830
1-0.15382-1.48340.929324
2-0.127956-1.2340.889837
3-0.057409-0.55360.709421
40.000250.00240.499043
50.0406870.39240.347841
6-0.088762-0.8560.802898
70.0129840.12520.450314
80.0757040.73010.233593
90.0948080.91430.181462
100.0135460.13060.448173
110.0409190.39460.347018
12-0.024301-0.23440.592388
13-0.047547-0.45850.676177
14-0.086436-0.83360.796668
15-0.007891-0.07610.530246
160.0155650.15010.440504
170.0505430.48740.313555
180.009220.08890.46467


Parameters (Session):
par1 = Default ; par2 = 1 ; par3 = 0 ; par4 = 0 ; par5 = 12 ;
Parameters (R input):
par1 = Default ; par2 = 1 ; par3 = 0 ; par4 = 0 ; par5 = 12 ;
R code (references can be found in the software module):
if (par1 == 'Default') {
par1 = 10*log10(length(x))
} else {
par1 <- as.numeric(par1)
}
par2 <- as.numeric(par2)
par3 <- as.numeric(par3)
par4 <- as.numeric(par4)
par5 <- as.numeric(par5)
if (par2 == 0) {
x <- log(x)
} else {
x <- (x ^ par2 - 1) / par2
}
if (par3 > 0) x <- diff(x,lag=1,difference=par3)
if (par4 > 0) x <- diff(x,lag=par5,difference=par4)
bitmap(file='pic1.png')
racf <- acf(x,par1,main='Autocorrelation',xlab='lags',ylab='ACF')
dev.off()
bitmap(file='pic2.png')
rpacf <- pacf(x,par1,main='Partial Autocorrelation',xlab='lags',ylab='PACF')
dev.off()
(myacf <- c(racf$acf))
(mypacf <- c(rpacf$acf))
lengthx <- length(x)
sqrtn <- sqrt(lengthx)
load(file='createtable')
a<-table.start()
a<-table.row.start(a)
a<-table.element(a,'Autocorrelation Function',4,TRUE)
a<-table.row.end(a)
a<-table.row.start(a)
a<-table.element(a,'Time lag k',header=TRUE)
a<-table.element(a,hyperlink('basics.htm','ACF(k)','click here for more information about the Autocorrelation Function'),header=TRUE)
a<-table.element(a,'T-STAT',header=TRUE)
a<-table.element(a,'P-value',header=TRUE)
a<-table.row.end(a)
for (i in 1:par1) {
a<-table.row.start(a)
a<-table.element(a,i-1,header=TRUE)
a<-table.element(a,round(myacf[i],6))
mytstat <- myacf[i]*sqrtn
a<-table.element(a,round(mytstat,4))
a<-table.element(a,round(1-pt(mytstat,lengthx),6))
a<-table.row.end(a)
}
a<-table.end(a)
table.save(a,file='mytable.tab')
a<-table.start()
a<-table.row.start(a)
a<-table.element(a,'Partial Autocorrelation Function',4,TRUE)
a<-table.row.end(a)
a<-table.row.start(a)
a<-table.element(a,'Time lag k',header=TRUE)
a<-table.element(a,hyperlink('basics.htm','PACF(k)','click here for more information about the Partial Autocorrelation Function'),header=TRUE)
a<-table.element(a,'T-STAT',header=TRUE)
a<-table.element(a,'P-value',header=TRUE)
a<-table.row.end(a)
for (i in 1:par1) {
a<-table.row.start(a)
a<-table.element(a,i-1,header=TRUE)
a<-table.element(a,round(mypacf[i],6))
mytstat <- mypacf[i]*sqrtn
a<-table.element(a,round(mytstat,4))
a<-table.element(a,round(1-pt(mytstat,lengthx),6))
a<-table.row.end(a)
}
a<-table.end(a)
table.save(a,file='mytable1.tab')