Free Statistics

of Irreproducible Research!

Author's title

Author*Unverified author*
R Software Modulerwasp_autocorrelation.wasp
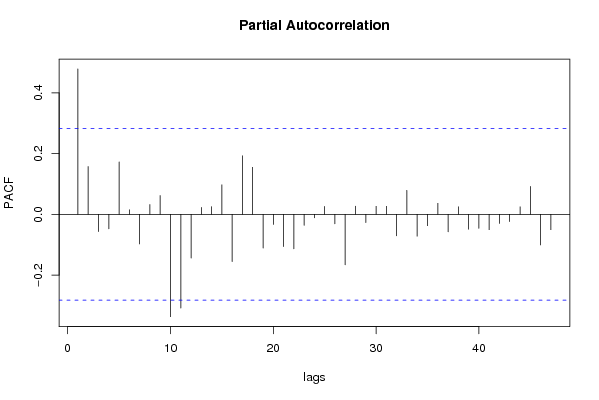
Title produced by software(Partial) Autocorrelation Function
Date of computationFri, 14 Dec 2007 03:42:24 -0700
Cite this page as followsStatistical Computations at FreeStatistics.org, Office for Research Development and Education, URL https://freestatistics.org/blog/index.php?v=date/2007/Dec/14/t1197628080pbxhojcwxcddxna.htm/, Retrieved Thu, 02 May 2024 20:52:44 +0000
Statistical Computations at FreeStatistics.org, Office for Research Development and Education, URL https://freestatistics.org/blog/index.php?pk=3826, Retrieved Thu, 02 May 2024 20:52:44 +0000
QR Codes:

Original text written by user:
IsPrivate?No (this computation is public)
User-defined keywords
Estimated Impact176
Family? (F = Feedback message, R = changed R code, M = changed R Module, P = changed Parameters, D = changed Data)
-       [(Partial) Autocorrelation Function] [ACF - Serie 1 - D...] [2007-12-14 10:42:24] [921757a21ec3444367392306fe4aab7f] [Current]
Feedback Forum

Post a new message
Dataseries X:
20972
35681
37034
35645
33379
32747
49585
41745
48564
52518
45594
51442
25094
33702
39120
33842
29896
31481
43895
39477
53726
61465
50104
47460
26451
30306
42598
34485
29027
35489
40357
37532
43899
48572
43901
50556
18387
27534
38030
31917
26414
35306
38271
41454
52408
53536
53152
56421
21538
33625
42625
31295
33795
41227
45382
47206
46235
51378
46865
58608


Summary of compuational transaction
Raw Inputview raw input (R code)
Raw Outputview raw output of R engine
Computing time2 seconds
R Server'Gwilym Jenkins' @ 72.249.127.135

\begin{tabular}{lllllllll}
\hline
Summary of compuational transaction \tabularnewline
Raw Input & view raw input (R code)  \tabularnewline
Raw Output & view raw output of R engine  \tabularnewline
Computing time & 2 seconds \tabularnewline
R Server & 'Gwilym Jenkins' @ 72.249.127.135 \tabularnewline
\hline
\end{tabular}
%Source: https://freestatistics.org/blog/index.php?pk=3826&T=0

[TABLE]
[ROW][C]Summary of compuational transaction[/C][/ROW]
[ROW][C]Raw Input[/C][C]view raw input (R code) [/C][/ROW]
[ROW][C]Raw Output[/C][C]view raw output of R engine [/C][/ROW]
[ROW][C]Computing time[/C][C]2 seconds[/C][/ROW]
[ROW][C]R Server[/C][C]'Gwilym Jenkins' @ 72.249.127.135[/C][/ROW]
[/TABLE]
Source: https://freestatistics.org/blog/index.php?pk=3826&T=0

Globally Unique Identifier (entire table): ba.freestatistics.org/blog/index.php?pk=3826&T=0

As an alternative you can also use a QR Code:  

The GUIDs for individual cells are displayed in the table below:

Summary of compuational transaction
Raw Inputview raw input (R code)
Raw Outputview raw output of R engine
Computing time2 seconds
R Server'Gwilym Jenkins' @ 72.249.127.135


Autocorrelation Function
Time lag kACF(k)T-STATP-value
016.92820
10.4792093.32010.000862
20.3510992.43250.009387
30.1745821.20950.116189
40.0724760.50210.308938
50.1557771.07930.142934
60.11910.82520.206684
70.0491160.34030.367562
80.0525040.36380.358818
90.0460470.3190.375547
10-0.185884-1.28780.898012
11-0.334713-2.3190.98765
12-0.435596-3.01790.997967
13-0.362122-2.50890.992229
14-0.203192-1.40780.917176
15-0.090338-0.62590.732821
16-0.209836-1.45380.923743
17-0.069847-0.48390.684677
18-0.047865-0.33160.62919
19-0.103752-0.71880.762131
20-0.045735-0.31690.623638
21-0.153186-1.06130.853069
22-0.054213-0.37560.645564
230.1162610.80550.212258
240.1574391.09080.140409
250.1395820.96710.169182
260.096350.66750.253814
27-0.041642-0.28850.612898
28-0.010271-0.07120.528217
29-0.064939-0.44990.672601
30-0.070301-0.48710.685784
31-0.014658-0.10160.540232
320.0409510.28370.388923
330.0985990.68310.248909
34-0.006323-0.04380.51738
35-0.041724-0.28910.613115
36-0.136338-0.94460.825198
37-0.089943-0.62310.731931
380.0113150.07840.46892
390.0050410.03490.486141
400.0618120.42820.335195
410.0298930.20710.418401
420.0231920.16070.436511
430.0301630.2090.417677
44-0.027567-0.1910.575331
450.007160.04960.48032
46-0.02336-0.16180.563944
470.0056770.03930.484394

\begin{tabular}{lllllllll}
\hline
Autocorrelation Function \tabularnewline
Time lag k & ACF(k) & T-STAT & P-value \tabularnewline
0 & 1 & 6.9282 & 0 \tabularnewline
1 & 0.479209 & 3.3201 & 0.000862 \tabularnewline
2 & 0.351099 & 2.4325 & 0.009387 \tabularnewline
3 & 0.174582 & 1.2095 & 0.116189 \tabularnewline
4 & 0.072476 & 0.5021 & 0.308938 \tabularnewline
5 & 0.155777 & 1.0793 & 0.142934 \tabularnewline
6 & 0.1191 & 0.8252 & 0.206684 \tabularnewline
7 & 0.049116 & 0.3403 & 0.367562 \tabularnewline
8 & 0.052504 & 0.3638 & 0.358818 \tabularnewline
9 & 0.046047 & 0.319 & 0.375547 \tabularnewline
10 & -0.185884 & -1.2878 & 0.898012 \tabularnewline
11 & -0.334713 & -2.319 & 0.98765 \tabularnewline
12 & -0.435596 & -3.0179 & 0.997967 \tabularnewline
13 & -0.362122 & -2.5089 & 0.992229 \tabularnewline
14 & -0.203192 & -1.4078 & 0.917176 \tabularnewline
15 & -0.090338 & -0.6259 & 0.732821 \tabularnewline
16 & -0.209836 & -1.4538 & 0.923743 \tabularnewline
17 & -0.069847 & -0.4839 & 0.684677 \tabularnewline
18 & -0.047865 & -0.3316 & 0.62919 \tabularnewline
19 & -0.103752 & -0.7188 & 0.762131 \tabularnewline
20 & -0.045735 & -0.3169 & 0.623638 \tabularnewline
21 & -0.153186 & -1.0613 & 0.853069 \tabularnewline
22 & -0.054213 & -0.3756 & 0.645564 \tabularnewline
23 & 0.116261 & 0.8055 & 0.212258 \tabularnewline
24 & 0.157439 & 1.0908 & 0.140409 \tabularnewline
25 & 0.139582 & 0.9671 & 0.169182 \tabularnewline
26 & 0.09635 & 0.6675 & 0.253814 \tabularnewline
27 & -0.041642 & -0.2885 & 0.612898 \tabularnewline
28 & -0.010271 & -0.0712 & 0.528217 \tabularnewline
29 & -0.064939 & -0.4499 & 0.672601 \tabularnewline
30 & -0.070301 & -0.4871 & 0.685784 \tabularnewline
31 & -0.014658 & -0.1016 & 0.540232 \tabularnewline
32 & 0.040951 & 0.2837 & 0.388923 \tabularnewline
33 & 0.098599 & 0.6831 & 0.248909 \tabularnewline
34 & -0.006323 & -0.0438 & 0.51738 \tabularnewline
35 & -0.041724 & -0.2891 & 0.613115 \tabularnewline
36 & -0.136338 & -0.9446 & 0.825198 \tabularnewline
37 & -0.089943 & -0.6231 & 0.731931 \tabularnewline
38 & 0.011315 & 0.0784 & 0.46892 \tabularnewline
39 & 0.005041 & 0.0349 & 0.486141 \tabularnewline
40 & 0.061812 & 0.4282 & 0.335195 \tabularnewline
41 & 0.029893 & 0.2071 & 0.418401 \tabularnewline
42 & 0.023192 & 0.1607 & 0.436511 \tabularnewline
43 & 0.030163 & 0.209 & 0.417677 \tabularnewline
44 & -0.027567 & -0.191 & 0.575331 \tabularnewline
45 & 0.00716 & 0.0496 & 0.48032 \tabularnewline
46 & -0.02336 & -0.1618 & 0.563944 \tabularnewline
47 & 0.005677 & 0.0393 & 0.484394 \tabularnewline
\hline
\end{tabular}
%Source: https://freestatistics.org/blog/index.php?pk=3826&T=1

[TABLE]
[ROW][C]Autocorrelation Function[/C][/ROW]
[ROW][C]Time lag k[/C][C]ACF(k)[/C][C]T-STAT[/C][C]P-value[/C][/ROW]
[ROW][C]0[/C][C]1[/C][C]6.9282[/C][C]0[/C][/ROW]
[ROW][C]1[/C][C]0.479209[/C][C]3.3201[/C][C]0.000862[/C][/ROW]
[ROW][C]2[/C][C]0.351099[/C][C]2.4325[/C][C]0.009387[/C][/ROW]
[ROW][C]3[/C][C]0.174582[/C][C]1.2095[/C][C]0.116189[/C][/ROW]
[ROW][C]4[/C][C]0.072476[/C][C]0.5021[/C][C]0.308938[/C][/ROW]
[ROW][C]5[/C][C]0.155777[/C][C]1.0793[/C][C]0.142934[/C][/ROW]
[ROW][C]6[/C][C]0.1191[/C][C]0.8252[/C][C]0.206684[/C][/ROW]
[ROW][C]7[/C][C]0.049116[/C][C]0.3403[/C][C]0.367562[/C][/ROW]
[ROW][C]8[/C][C]0.052504[/C][C]0.3638[/C][C]0.358818[/C][/ROW]
[ROW][C]9[/C][C]0.046047[/C][C]0.319[/C][C]0.375547[/C][/ROW]
[ROW][C]10[/C][C]-0.185884[/C][C]-1.2878[/C][C]0.898012[/C][/ROW]
[ROW][C]11[/C][C]-0.334713[/C][C]-2.319[/C][C]0.98765[/C][/ROW]
[ROW][C]12[/C][C]-0.435596[/C][C]-3.0179[/C][C]0.997967[/C][/ROW]
[ROW][C]13[/C][C]-0.362122[/C][C]-2.5089[/C][C]0.992229[/C][/ROW]
[ROW][C]14[/C][C]-0.203192[/C][C]-1.4078[/C][C]0.917176[/C][/ROW]
[ROW][C]15[/C][C]-0.090338[/C][C]-0.6259[/C][C]0.732821[/C][/ROW]
[ROW][C]16[/C][C]-0.209836[/C][C]-1.4538[/C][C]0.923743[/C][/ROW]
[ROW][C]17[/C][C]-0.069847[/C][C]-0.4839[/C][C]0.684677[/C][/ROW]
[ROW][C]18[/C][C]-0.047865[/C][C]-0.3316[/C][C]0.62919[/C][/ROW]
[ROW][C]19[/C][C]-0.103752[/C][C]-0.7188[/C][C]0.762131[/C][/ROW]
[ROW][C]20[/C][C]-0.045735[/C][C]-0.3169[/C][C]0.623638[/C][/ROW]
[ROW][C]21[/C][C]-0.153186[/C][C]-1.0613[/C][C]0.853069[/C][/ROW]
[ROW][C]22[/C][C]-0.054213[/C][C]-0.3756[/C][C]0.645564[/C][/ROW]
[ROW][C]23[/C][C]0.116261[/C][C]0.8055[/C][C]0.212258[/C][/ROW]
[ROW][C]24[/C][C]0.157439[/C][C]1.0908[/C][C]0.140409[/C][/ROW]
[ROW][C]25[/C][C]0.139582[/C][C]0.9671[/C][C]0.169182[/C][/ROW]
[ROW][C]26[/C][C]0.09635[/C][C]0.6675[/C][C]0.253814[/C][/ROW]
[ROW][C]27[/C][C]-0.041642[/C][C]-0.2885[/C][C]0.612898[/C][/ROW]
[ROW][C]28[/C][C]-0.010271[/C][C]-0.0712[/C][C]0.528217[/C][/ROW]
[ROW][C]29[/C][C]-0.064939[/C][C]-0.4499[/C][C]0.672601[/C][/ROW]
[ROW][C]30[/C][C]-0.070301[/C][C]-0.4871[/C][C]0.685784[/C][/ROW]
[ROW][C]31[/C][C]-0.014658[/C][C]-0.1016[/C][C]0.540232[/C][/ROW]
[ROW][C]32[/C][C]0.040951[/C][C]0.2837[/C][C]0.388923[/C][/ROW]
[ROW][C]33[/C][C]0.098599[/C][C]0.6831[/C][C]0.248909[/C][/ROW]
[ROW][C]34[/C][C]-0.006323[/C][C]-0.0438[/C][C]0.51738[/C][/ROW]
[ROW][C]35[/C][C]-0.041724[/C][C]-0.2891[/C][C]0.613115[/C][/ROW]
[ROW][C]36[/C][C]-0.136338[/C][C]-0.9446[/C][C]0.825198[/C][/ROW]
[ROW][C]37[/C][C]-0.089943[/C][C]-0.6231[/C][C]0.731931[/C][/ROW]
[ROW][C]38[/C][C]0.011315[/C][C]0.0784[/C][C]0.46892[/C][/ROW]
[ROW][C]39[/C][C]0.005041[/C][C]0.0349[/C][C]0.486141[/C][/ROW]
[ROW][C]40[/C][C]0.061812[/C][C]0.4282[/C][C]0.335195[/C][/ROW]
[ROW][C]41[/C][C]0.029893[/C][C]0.2071[/C][C]0.418401[/C][/ROW]
[ROW][C]42[/C][C]0.023192[/C][C]0.1607[/C][C]0.436511[/C][/ROW]
[ROW][C]43[/C][C]0.030163[/C][C]0.209[/C][C]0.417677[/C][/ROW]
[ROW][C]44[/C][C]-0.027567[/C][C]-0.191[/C][C]0.575331[/C][/ROW]
[ROW][C]45[/C][C]0.00716[/C][C]0.0496[/C][C]0.48032[/C][/ROW]
[ROW][C]46[/C][C]-0.02336[/C][C]-0.1618[/C][C]0.563944[/C][/ROW]
[ROW][C]47[/C][C]0.005677[/C][C]0.0393[/C][C]0.484394[/C][/ROW]
[/TABLE]
Source: https://freestatistics.org/blog/index.php?pk=3826&T=1

Globally Unique Identifier (entire table): ba.freestatistics.org/blog/index.php?pk=3826&T=1

As an alternative you can also use a QR Code:  

The GUIDs for individual cells are displayed in the table below:

Autocorrelation Function
Time lag kACF(k)T-STATP-value
016.92820
10.4792093.32010.000862
20.3510992.43250.009387
30.1745821.20950.116189
40.0724760.50210.308938
50.1557771.07930.142934
60.11910.82520.206684
70.0491160.34030.367562
80.0525040.36380.358818
90.0460470.3190.375547
10-0.185884-1.28780.898012
11-0.334713-2.3190.98765
12-0.435596-3.01790.997967
13-0.362122-2.50890.992229
14-0.203192-1.40780.917176
15-0.090338-0.62590.732821
16-0.209836-1.45380.923743
17-0.069847-0.48390.684677
18-0.047865-0.33160.62919
19-0.103752-0.71880.762131
20-0.045735-0.31690.623638
21-0.153186-1.06130.853069
22-0.054213-0.37560.645564
230.1162610.80550.212258
240.1574391.09080.140409
250.1395820.96710.169182
260.096350.66750.253814
27-0.041642-0.28850.612898
28-0.010271-0.07120.528217
29-0.064939-0.44990.672601
30-0.070301-0.48710.685784
31-0.014658-0.10160.540232
320.0409510.28370.388923
330.0985990.68310.248909
34-0.006323-0.04380.51738
35-0.041724-0.28910.613115
36-0.136338-0.94460.825198
37-0.089943-0.62310.731931
380.0113150.07840.46892
390.0050410.03490.486141
400.0618120.42820.335195
410.0298930.20710.418401
420.0231920.16070.436511
430.0301630.2090.417677
44-0.027567-0.1910.575331
450.007160.04960.48032
46-0.02336-0.16180.563944
470.0056770.03930.484394


Partial Autocorrelation Function
Time lag kPACF(k)T-STATP-value
00.4792093.32010.000862
10.1576641.09230.140071
2-0.056834-0.39380.652248
3-0.047724-0.33060.628823
40.1725981.19580.118826
50.0149780.10380.458891
6-0.097326-0.67430.74832
70.0323270.2240.411867
80.0620730.43010.334541
9-0.337092-2.33540.988126
10-0.308932-2.14030.981282
11-0.144184-0.99890.838582
120.0226320.15680.438029
130.0251790.17440.431124
140.0975360.67570.251222
15-0.1555-1.07730.856642
160.1931671.33830.093551
170.1549081.07320.144267
18-0.111232-0.77060.777651
19-0.033192-0.230.59045
20-0.106042-0.73470.766946
21-0.11362-0.78720.782478
22-0.036029-0.24960.598025
23-0.011386-0.07890.531273
240.0260770.18070.428694
25-0.03125-0.21650.585246
26-0.166274-1.1520.872482
270.0267830.18560.426785
28-0.027112-0.18780.574103
290.0265410.18390.427441
300.0264170.1830.427774
31-0.07084-0.49080.687095
320.0790620.54780.293199
33-0.071858-0.49780.689568
34-0.037437-0.25940.601771
350.0363450.25180.401133
36-0.057491-0.39830.653916
370.0248070.17190.432133
38-0.048785-0.3380.631579
39-0.046017-0.31880.624376
40-0.050411-0.34930.635789
41-0.029777-0.20630.581287
42-0.023898-0.16560.565404
430.0249950.17320.431624
440.0918840.63660.263709
45-0.100912-0.69910.756081
46-0.050616-0.35070.636317
47NANANA

\begin{tabular}{lllllllll}
\hline
Partial Autocorrelation Function \tabularnewline
Time lag k & PACF(k) & T-STAT & P-value \tabularnewline
0 & 0.479209 & 3.3201 & 0.000862 \tabularnewline
1 & 0.157664 & 1.0923 & 0.140071 \tabularnewline
2 & -0.056834 & -0.3938 & 0.652248 \tabularnewline
3 & -0.047724 & -0.3306 & 0.628823 \tabularnewline
4 & 0.172598 & 1.1958 & 0.118826 \tabularnewline
5 & 0.014978 & 0.1038 & 0.458891 \tabularnewline
6 & -0.097326 & -0.6743 & 0.74832 \tabularnewline
7 & 0.032327 & 0.224 & 0.411867 \tabularnewline
8 & 0.062073 & 0.4301 & 0.334541 \tabularnewline
9 & -0.337092 & -2.3354 & 0.988126 \tabularnewline
10 & -0.308932 & -2.1403 & 0.981282 \tabularnewline
11 & -0.144184 & -0.9989 & 0.838582 \tabularnewline
12 & 0.022632 & 0.1568 & 0.438029 \tabularnewline
13 & 0.025179 & 0.1744 & 0.431124 \tabularnewline
14 & 0.097536 & 0.6757 & 0.251222 \tabularnewline
15 & -0.1555 & -1.0773 & 0.856642 \tabularnewline
16 & 0.193167 & 1.3383 & 0.093551 \tabularnewline
17 & 0.154908 & 1.0732 & 0.144267 \tabularnewline
18 & -0.111232 & -0.7706 & 0.777651 \tabularnewline
19 & -0.033192 & -0.23 & 0.59045 \tabularnewline
20 & -0.106042 & -0.7347 & 0.766946 \tabularnewline
21 & -0.11362 & -0.7872 & 0.782478 \tabularnewline
22 & -0.036029 & -0.2496 & 0.598025 \tabularnewline
23 & -0.011386 & -0.0789 & 0.531273 \tabularnewline
24 & 0.026077 & 0.1807 & 0.428694 \tabularnewline
25 & -0.03125 & -0.2165 & 0.585246 \tabularnewline
26 & -0.166274 & -1.152 & 0.872482 \tabularnewline
27 & 0.026783 & 0.1856 & 0.426785 \tabularnewline
28 & -0.027112 & -0.1878 & 0.574103 \tabularnewline
29 & 0.026541 & 0.1839 & 0.427441 \tabularnewline
30 & 0.026417 & 0.183 & 0.427774 \tabularnewline
31 & -0.07084 & -0.4908 & 0.687095 \tabularnewline
32 & 0.079062 & 0.5478 & 0.293199 \tabularnewline
33 & -0.071858 & -0.4978 & 0.689568 \tabularnewline
34 & -0.037437 & -0.2594 & 0.601771 \tabularnewline
35 & 0.036345 & 0.2518 & 0.401133 \tabularnewline
36 & -0.057491 & -0.3983 & 0.653916 \tabularnewline
37 & 0.024807 & 0.1719 & 0.432133 \tabularnewline
38 & -0.048785 & -0.338 & 0.631579 \tabularnewline
39 & -0.046017 & -0.3188 & 0.624376 \tabularnewline
40 & -0.050411 & -0.3493 & 0.635789 \tabularnewline
41 & -0.029777 & -0.2063 & 0.581287 \tabularnewline
42 & -0.023898 & -0.1656 & 0.565404 \tabularnewline
43 & 0.024995 & 0.1732 & 0.431624 \tabularnewline
44 & 0.091884 & 0.6366 & 0.263709 \tabularnewline
45 & -0.100912 & -0.6991 & 0.756081 \tabularnewline
46 & -0.050616 & -0.3507 & 0.636317 \tabularnewline
47 & NA & NA & NA \tabularnewline
\hline
\end{tabular}
%Source: https://freestatistics.org/blog/index.php?pk=3826&T=2

[TABLE]
[ROW][C]Partial Autocorrelation Function[/C][/ROW]
[ROW][C]Time lag k[/C][C]PACF(k)[/C][C]T-STAT[/C][C]P-value[/C][/ROW]
[ROW][C]0[/C][C]0.479209[/C][C]3.3201[/C][C]0.000862[/C][/ROW]
[ROW][C]1[/C][C]0.157664[/C][C]1.0923[/C][C]0.140071[/C][/ROW]
[ROW][C]2[/C][C]-0.056834[/C][C]-0.3938[/C][C]0.652248[/C][/ROW]
[ROW][C]3[/C][C]-0.047724[/C][C]-0.3306[/C][C]0.628823[/C][/ROW]
[ROW][C]4[/C][C]0.172598[/C][C]1.1958[/C][C]0.118826[/C][/ROW]
[ROW][C]5[/C][C]0.014978[/C][C]0.1038[/C][C]0.458891[/C][/ROW]
[ROW][C]6[/C][C]-0.097326[/C][C]-0.6743[/C][C]0.74832[/C][/ROW]
[ROW][C]7[/C][C]0.032327[/C][C]0.224[/C][C]0.411867[/C][/ROW]
[ROW][C]8[/C][C]0.062073[/C][C]0.4301[/C][C]0.334541[/C][/ROW]
[ROW][C]9[/C][C]-0.337092[/C][C]-2.3354[/C][C]0.988126[/C][/ROW]
[ROW][C]10[/C][C]-0.308932[/C][C]-2.1403[/C][C]0.981282[/C][/ROW]
[ROW][C]11[/C][C]-0.144184[/C][C]-0.9989[/C][C]0.838582[/C][/ROW]
[ROW][C]12[/C][C]0.022632[/C][C]0.1568[/C][C]0.438029[/C][/ROW]
[ROW][C]13[/C][C]0.025179[/C][C]0.1744[/C][C]0.431124[/C][/ROW]
[ROW][C]14[/C][C]0.097536[/C][C]0.6757[/C][C]0.251222[/C][/ROW]
[ROW][C]15[/C][C]-0.1555[/C][C]-1.0773[/C][C]0.856642[/C][/ROW]
[ROW][C]16[/C][C]0.193167[/C][C]1.3383[/C][C]0.093551[/C][/ROW]
[ROW][C]17[/C][C]0.154908[/C][C]1.0732[/C][C]0.144267[/C][/ROW]
[ROW][C]18[/C][C]-0.111232[/C][C]-0.7706[/C][C]0.777651[/C][/ROW]
[ROW][C]19[/C][C]-0.033192[/C][C]-0.23[/C][C]0.59045[/C][/ROW]
[ROW][C]20[/C][C]-0.106042[/C][C]-0.7347[/C][C]0.766946[/C][/ROW]
[ROW][C]21[/C][C]-0.11362[/C][C]-0.7872[/C][C]0.782478[/C][/ROW]
[ROW][C]22[/C][C]-0.036029[/C][C]-0.2496[/C][C]0.598025[/C][/ROW]
[ROW][C]23[/C][C]-0.011386[/C][C]-0.0789[/C][C]0.531273[/C][/ROW]
[ROW][C]24[/C][C]0.026077[/C][C]0.1807[/C][C]0.428694[/C][/ROW]
[ROW][C]25[/C][C]-0.03125[/C][C]-0.2165[/C][C]0.585246[/C][/ROW]
[ROW][C]26[/C][C]-0.166274[/C][C]-1.152[/C][C]0.872482[/C][/ROW]
[ROW][C]27[/C][C]0.026783[/C][C]0.1856[/C][C]0.426785[/C][/ROW]
[ROW][C]28[/C][C]-0.027112[/C][C]-0.1878[/C][C]0.574103[/C][/ROW]
[ROW][C]29[/C][C]0.026541[/C][C]0.1839[/C][C]0.427441[/C][/ROW]
[ROW][C]30[/C][C]0.026417[/C][C]0.183[/C][C]0.427774[/C][/ROW]
[ROW][C]31[/C][C]-0.07084[/C][C]-0.4908[/C][C]0.687095[/C][/ROW]
[ROW][C]32[/C][C]0.079062[/C][C]0.5478[/C][C]0.293199[/C][/ROW]
[ROW][C]33[/C][C]-0.071858[/C][C]-0.4978[/C][C]0.689568[/C][/ROW]
[ROW][C]34[/C][C]-0.037437[/C][C]-0.2594[/C][C]0.601771[/C][/ROW]
[ROW][C]35[/C][C]0.036345[/C][C]0.2518[/C][C]0.401133[/C][/ROW]
[ROW][C]36[/C][C]-0.057491[/C][C]-0.3983[/C][C]0.653916[/C][/ROW]
[ROW][C]37[/C][C]0.024807[/C][C]0.1719[/C][C]0.432133[/C][/ROW]
[ROW][C]38[/C][C]-0.048785[/C][C]-0.338[/C][C]0.631579[/C][/ROW]
[ROW][C]39[/C][C]-0.046017[/C][C]-0.3188[/C][C]0.624376[/C][/ROW]
[ROW][C]40[/C][C]-0.050411[/C][C]-0.3493[/C][C]0.635789[/C][/ROW]
[ROW][C]41[/C][C]-0.029777[/C][C]-0.2063[/C][C]0.581287[/C][/ROW]
[ROW][C]42[/C][C]-0.023898[/C][C]-0.1656[/C][C]0.565404[/C][/ROW]
[ROW][C]43[/C][C]0.024995[/C][C]0.1732[/C][C]0.431624[/C][/ROW]
[ROW][C]44[/C][C]0.091884[/C][C]0.6366[/C][C]0.263709[/C][/ROW]
[ROW][C]45[/C][C]-0.100912[/C][C]-0.6991[/C][C]0.756081[/C][/ROW]
[ROW][C]46[/C][C]-0.050616[/C][C]-0.3507[/C][C]0.636317[/C][/ROW]
[ROW][C]47[/C][C]NA[/C][C]NA[/C][C]NA[/C][/ROW]
[/TABLE]
Source: https://freestatistics.org/blog/index.php?pk=3826&T=2

Globally Unique Identifier (entire table): ba.freestatistics.org/blog/index.php?pk=3826&T=2

As an alternative you can also use a QR Code:  

The GUIDs for individual cells are displayed in the table below:

Partial Autocorrelation Function
Time lag kPACF(k)T-STATP-value
00.4792093.32010.000862
10.1576641.09230.140071
2-0.056834-0.39380.652248
3-0.047724-0.33060.628823
40.1725981.19580.118826
50.0149780.10380.458891
6-0.097326-0.67430.74832
70.0323270.2240.411867
80.0620730.43010.334541
9-0.337092-2.33540.988126
10-0.308932-2.14030.981282
11-0.144184-0.99890.838582
120.0226320.15680.438029
130.0251790.17440.431124
140.0975360.67570.251222
15-0.1555-1.07730.856642
160.1931671.33830.093551
170.1549081.07320.144267
18-0.111232-0.77060.777651
19-0.033192-0.230.59045
20-0.106042-0.73470.766946
21-0.11362-0.78720.782478
22-0.036029-0.24960.598025
23-0.011386-0.07890.531273
240.0260770.18070.428694
25-0.03125-0.21650.585246
26-0.166274-1.1520.872482
270.0267830.18560.426785
28-0.027112-0.18780.574103
290.0265410.18390.427441
300.0264170.1830.427774
31-0.07084-0.49080.687095
320.0790620.54780.293199
33-0.071858-0.49780.689568
34-0.037437-0.25940.601771
350.0363450.25180.401133
36-0.057491-0.39830.653916
370.0248070.17190.432133
38-0.048785-0.3380.631579
39-0.046017-0.31880.624376
40-0.050411-0.34930.635789
41-0.029777-0.20630.581287
42-0.023898-0.16560.565404
430.0249950.17320.431624
440.0918840.63660.263709
45-0.100912-0.69910.756081
46-0.050616-0.35070.636317
47NANANA


Parameters (Session):
par1 = 48 ; par2 = 1 ; par3 = 0 ; par4 = 1 ; par5 = 12 ;
Parameters (R input):
par1 = 48 ; par2 = 1 ; par3 = 0 ; par4 = 1 ; par5 = 12 ;
R code (references can be found in the software module):
if (par1 == 'Default') {
par1 = 10*log10(length(x))
} else {
par1 <- as.numeric(par1)
}
par2 <- as.numeric(par2)
par3 <- as.numeric(par3)
par4 <- as.numeric(par4)
par5 <- as.numeric(par5)
if (par2 == 0) {
x <- log(x)
} else {
x <- (x ^ par2 - 1) / par2
}
if (par3 > 0) x <- diff(x,lag=1,difference=par3)
if (par4 > 0) x <- diff(x,lag=par5,difference=par4)
bitmap(file='pic1.png')
racf <- acf(x,par1,main='Autocorrelation',xlab='lags',ylab='ACF')
dev.off()
bitmap(file='pic2.png')
rpacf <- pacf(x,par1,main='Partial Autocorrelation',xlab='lags',ylab='PACF')
dev.off()
(myacf <- c(racf$acf))
(mypacf <- c(rpacf$acf))
lengthx <- length(x)
sqrtn <- sqrt(lengthx)
load(file='createtable')
a<-table.start()
a<-table.row.start(a)
a<-table.element(a,'Autocorrelation Function',4,TRUE)
a<-table.row.end(a)
a<-table.row.start(a)
a<-table.element(a,'Time lag k',header=TRUE)
a<-table.element(a,hyperlink('basics.htm','ACF(k)','click here for more information about the Autocorrelation Function'),header=TRUE)
a<-table.element(a,'T-STAT',header=TRUE)
a<-table.element(a,'P-value',header=TRUE)
a<-table.row.end(a)
for (i in 1:par1) {
a<-table.row.start(a)
a<-table.element(a,i-1,header=TRUE)
a<-table.element(a,round(myacf[i],6))
mytstat <- myacf[i]*sqrtn
a<-table.element(a,round(mytstat,4))
a<-table.element(a,round(1-pt(mytstat,lengthx),6))
a<-table.row.end(a)
}
a<-table.end(a)
table.save(a,file='mytable.tab')
a<-table.start()
a<-table.row.start(a)
a<-table.element(a,'Partial Autocorrelation Function',4,TRUE)
a<-table.row.end(a)
a<-table.row.start(a)
a<-table.element(a,'Time lag k',header=TRUE)
a<-table.element(a,hyperlink('basics.htm','PACF(k)','click here for more information about the Partial Autocorrelation Function'),header=TRUE)
a<-table.element(a,'T-STAT',header=TRUE)
a<-table.element(a,'P-value',header=TRUE)
a<-table.row.end(a)
for (i in 1:par1) {
a<-table.row.start(a)
a<-table.element(a,i-1,header=TRUE)
a<-table.element(a,round(mypacf[i],6))
mytstat <- mypacf[i]*sqrtn
a<-table.element(a,round(mytstat,4))
a<-table.element(a,round(1-pt(mytstat,lengthx),6))
a<-table.row.end(a)
}
a<-table.end(a)
table.save(a,file='mytable1.tab')