Free Statistics

of Irreproducible Research!

Author's title

Author*Unverified author*
R Software Modulerwasp_autocorrelation.wasp
Title produced by software(Partial) Autocorrelation Function
Date of computationFri, 14 Dec 2007 03:23:30 -0700
Cite this page as followsStatistical Computations at FreeStatistics.org, Office for Research Development and Education, URL https://freestatistics.org/blog/index.php?v=date/2007/Dec/14/t1197626868zqbatxm4g0pit45.htm/, Retrieved Thu, 02 May 2024 20:42:21 +0000
Statistical Computations at FreeStatistics.org, Office for Research Development and Education, URL https://freestatistics.org/blog/index.php?pk=3800, Retrieved Thu, 02 May 2024 20:42:21 +0000
QR Codes:

Original text written by user:
IsPrivate?No (this computation is public)
User-defined keywordss0650550 s0650062
Estimated Impact202
Family? (F = Feedback message, R = changed R code, M = changed R Module, P = changed Parameters, D = changed Data)
-     [Standard Deviation-Mean Plot] [Inducing Stationa...] [2007-11-29 14:28:06] [68a1fecd8f1c75119cd425050381cede]
- RMPD    [(Partial) Autocorrelation Function] [Time series] [2007-12-14 10:23:30] [ab924f39c1cc7a5dd22761038b10db61] [Current]
Feedback Forum

Post a new message
Dataseries X:
263418000000
262752000000
266433000000
267722000000
266003000000
262971000000
265521000000
264676000000
270223000000
269508000000
268457000000
265814000000
266680000000
263018000000
269285000000
269829000000
270911000000
266844000000
271244000000
269907000000
271296000000
270157000000
271322000000
267179000000
264101000000
265518000000
269419000000
268714000000
272482000000
268351000000
268175000000
270674000000
272764000000
272599000000
270333000000
270846000000
270491000000
269160000000
274027000000
273784000000
276663000000
274525000000
271344000000
271115000000
270798000000
273911000000
273985000000
271917000000
273338000000
270601000000
273547000000
275363000000
281229000000
277793000000
279913000000
282500000000
280041000000
282166000000
290304000000
283519000000


Summary of compuational transaction
Raw Inputview raw input (R code)
Raw Outputview raw output of R engine
Computing time2 seconds
R Server'Gwilym Jenkins' @ 72.249.127.135

\begin{tabular}{lllllllll}
\hline
Summary of compuational transaction \tabularnewline
Raw Input & view raw input (R code)  \tabularnewline
Raw Output & view raw output of R engine  \tabularnewline
Computing time & 2 seconds \tabularnewline
R Server & 'Gwilym Jenkins' @ 72.249.127.135 \tabularnewline
\hline
\end{tabular}
%Source: https://freestatistics.org/blog/index.php?pk=3800&T=0

[TABLE]
[ROW][C]Summary of compuational transaction[/C][/ROW]
[ROW][C]Raw Input[/C][C]view raw input (R code) [/C][/ROW]
[ROW][C]Raw Output[/C][C]view raw output of R engine [/C][/ROW]
[ROW][C]Computing time[/C][C]2 seconds[/C][/ROW]
[ROW][C]R Server[/C][C]'Gwilym Jenkins' @ 72.249.127.135[/C][/ROW]
[/TABLE]
Source: https://freestatistics.org/blog/index.php?pk=3800&T=0

Globally Unique Identifier (entire table): ba.freestatistics.org/blog/index.php?pk=3800&T=0

As an alternative you can also use a QR Code:  

The GUIDs for individual cells are displayed in the table below:

Summary of compuational transaction
Raw Inputview raw input (R code)
Raw Outputview raw output of R engine
Computing time2 seconds
R Server'Gwilym Jenkins' @ 72.249.127.135


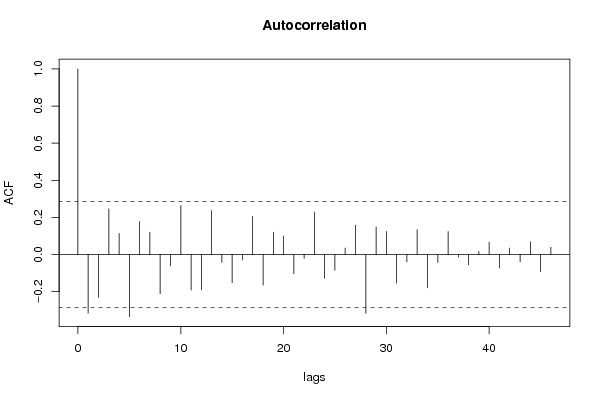
Autocorrelation Function
Time lag kACF(k)T-STATP-value
016.85570
1-0.3159-2.16570.982279
2-0.230491-1.58020.939612
30.2465821.69050.048779
40.113590.77870.220019
5-0.334736-2.29480.986873
60.177671.2180.114643
70.1203480.82510.206752
8-0.210992-1.44650.922662
9-0.06174-0.42330.662984
100.2638261.80870.038449
11-0.191726-1.31440.902456
12-0.190364-1.30510.900889
130.2372631.62660.055255
14-0.041712-0.2860.611918
15-0.151769-1.04050.848279
16-0.029201-0.20020.578903
170.2055531.40920.08268
18-0.164646-1.12880.867636
190.1202040.82410.207029
200.0993280.6810.24962
21-0.103753-0.71130.759792
22-0.020078-0.13760.554446
230.22891.56930.061648
24-0.127513-0.87420.806768
25-0.084616-0.58010.717691
260.0349420.23950.405861
270.1580251.08340.142087
28-0.31698-2.17310.982577
290.1481741.01580.157455
300.1244990.85350.198849
31-0.153737-1.0540.851356
32-0.038426-0.26340.603317
330.1339970.91860.181488
34-0.179197-1.22850.887314
35-0.04233-0.29020.61353
360.1241030.85080.199596
37-0.01307-0.08960.535507
38-0.055313-0.37920.646879
390.0164560.11280.455329
400.0664940.45590.325296
41-0.072005-0.49360.68807
420.0346290.23740.406688
43-0.039221-0.26890.605402
440.0685720.47010.320226
45-0.092786-0.63610.736104
460.0391450.26840.394796
47NANANA
48NANANA
49NANANA
50NANANA
51NANANA
52NANANA
53NANANA
54NANANA
55NANANA
56NANANA
57NANANA
58NANANA
59NANANA

\begin{tabular}{lllllllll}
\hline
Autocorrelation Function \tabularnewline
Time lag k & ACF(k) & T-STAT & P-value \tabularnewline
0 & 1 & 6.8557 & 0 \tabularnewline
1 & -0.3159 & -2.1657 & 0.982279 \tabularnewline
2 & -0.230491 & -1.5802 & 0.939612 \tabularnewline
3 & 0.246582 & 1.6905 & 0.048779 \tabularnewline
4 & 0.11359 & 0.7787 & 0.220019 \tabularnewline
5 & -0.334736 & -2.2948 & 0.986873 \tabularnewline
6 & 0.17767 & 1.218 & 0.114643 \tabularnewline
7 & 0.120348 & 0.8251 & 0.206752 \tabularnewline
8 & -0.210992 & -1.4465 & 0.922662 \tabularnewline
9 & -0.06174 & -0.4233 & 0.662984 \tabularnewline
10 & 0.263826 & 1.8087 & 0.038449 \tabularnewline
11 & -0.191726 & -1.3144 & 0.902456 \tabularnewline
12 & -0.190364 & -1.3051 & 0.900889 \tabularnewline
13 & 0.237263 & 1.6266 & 0.055255 \tabularnewline
14 & -0.041712 & -0.286 & 0.611918 \tabularnewline
15 & -0.151769 & -1.0405 & 0.848279 \tabularnewline
16 & -0.029201 & -0.2002 & 0.578903 \tabularnewline
17 & 0.205553 & 1.4092 & 0.08268 \tabularnewline
18 & -0.164646 & -1.1288 & 0.867636 \tabularnewline
19 & 0.120204 & 0.8241 & 0.207029 \tabularnewline
20 & 0.099328 & 0.681 & 0.24962 \tabularnewline
21 & -0.103753 & -0.7113 & 0.759792 \tabularnewline
22 & -0.020078 & -0.1376 & 0.554446 \tabularnewline
23 & 0.2289 & 1.5693 & 0.061648 \tabularnewline
24 & -0.127513 & -0.8742 & 0.806768 \tabularnewline
25 & -0.084616 & -0.5801 & 0.717691 \tabularnewline
26 & 0.034942 & 0.2395 & 0.405861 \tabularnewline
27 & 0.158025 & 1.0834 & 0.142087 \tabularnewline
28 & -0.31698 & -2.1731 & 0.982577 \tabularnewline
29 & 0.148174 & 1.0158 & 0.157455 \tabularnewline
30 & 0.124499 & 0.8535 & 0.198849 \tabularnewline
31 & -0.153737 & -1.054 & 0.851356 \tabularnewline
32 & -0.038426 & -0.2634 & 0.603317 \tabularnewline
33 & 0.133997 & 0.9186 & 0.181488 \tabularnewline
34 & -0.179197 & -1.2285 & 0.887314 \tabularnewline
35 & -0.04233 & -0.2902 & 0.61353 \tabularnewline
36 & 0.124103 & 0.8508 & 0.199596 \tabularnewline
37 & -0.01307 & -0.0896 & 0.535507 \tabularnewline
38 & -0.055313 & -0.3792 & 0.646879 \tabularnewline
39 & 0.016456 & 0.1128 & 0.455329 \tabularnewline
40 & 0.066494 & 0.4559 & 0.325296 \tabularnewline
41 & -0.072005 & -0.4936 & 0.68807 \tabularnewline
42 & 0.034629 & 0.2374 & 0.406688 \tabularnewline
43 & -0.039221 & -0.2689 & 0.605402 \tabularnewline
44 & 0.068572 & 0.4701 & 0.320226 \tabularnewline
45 & -0.092786 & -0.6361 & 0.736104 \tabularnewline
46 & 0.039145 & 0.2684 & 0.394796 \tabularnewline
47 & NA & NA & NA \tabularnewline
48 & NA & NA & NA \tabularnewline
49 & NA & NA & NA \tabularnewline
50 & NA & NA & NA \tabularnewline
51 & NA & NA & NA \tabularnewline
52 & NA & NA & NA \tabularnewline
53 & NA & NA & NA \tabularnewline
54 & NA & NA & NA \tabularnewline
55 & NA & NA & NA \tabularnewline
56 & NA & NA & NA \tabularnewline
57 & NA & NA & NA \tabularnewline
58 & NA & NA & NA \tabularnewline
59 & NA & NA & NA \tabularnewline
\hline
\end{tabular}
%Source: https://freestatistics.org/blog/index.php?pk=3800&T=1

[TABLE]
[ROW][C]Autocorrelation Function[/C][/ROW]
[ROW][C]Time lag k[/C][C]ACF(k)[/C][C]T-STAT[/C][C]P-value[/C][/ROW]
[ROW][C]0[/C][C]1[/C][C]6.8557[/C][C]0[/C][/ROW]
[ROW][C]1[/C][C]-0.3159[/C][C]-2.1657[/C][C]0.982279[/C][/ROW]
[ROW][C]2[/C][C]-0.230491[/C][C]-1.5802[/C][C]0.939612[/C][/ROW]
[ROW][C]3[/C][C]0.246582[/C][C]1.6905[/C][C]0.048779[/C][/ROW]
[ROW][C]4[/C][C]0.11359[/C][C]0.7787[/C][C]0.220019[/C][/ROW]
[ROW][C]5[/C][C]-0.334736[/C][C]-2.2948[/C][C]0.986873[/C][/ROW]
[ROW][C]6[/C][C]0.17767[/C][C]1.218[/C][C]0.114643[/C][/ROW]
[ROW][C]7[/C][C]0.120348[/C][C]0.8251[/C][C]0.206752[/C][/ROW]
[ROW][C]8[/C][C]-0.210992[/C][C]-1.4465[/C][C]0.922662[/C][/ROW]
[ROW][C]9[/C][C]-0.06174[/C][C]-0.4233[/C][C]0.662984[/C][/ROW]
[ROW][C]10[/C][C]0.263826[/C][C]1.8087[/C][C]0.038449[/C][/ROW]
[ROW][C]11[/C][C]-0.191726[/C][C]-1.3144[/C][C]0.902456[/C][/ROW]
[ROW][C]12[/C][C]-0.190364[/C][C]-1.3051[/C][C]0.900889[/C][/ROW]
[ROW][C]13[/C][C]0.237263[/C][C]1.6266[/C][C]0.055255[/C][/ROW]
[ROW][C]14[/C][C]-0.041712[/C][C]-0.286[/C][C]0.611918[/C][/ROW]
[ROW][C]15[/C][C]-0.151769[/C][C]-1.0405[/C][C]0.848279[/C][/ROW]
[ROW][C]16[/C][C]-0.029201[/C][C]-0.2002[/C][C]0.578903[/C][/ROW]
[ROW][C]17[/C][C]0.205553[/C][C]1.4092[/C][C]0.08268[/C][/ROW]
[ROW][C]18[/C][C]-0.164646[/C][C]-1.1288[/C][C]0.867636[/C][/ROW]
[ROW][C]19[/C][C]0.120204[/C][C]0.8241[/C][C]0.207029[/C][/ROW]
[ROW][C]20[/C][C]0.099328[/C][C]0.681[/C][C]0.24962[/C][/ROW]
[ROW][C]21[/C][C]-0.103753[/C][C]-0.7113[/C][C]0.759792[/C][/ROW]
[ROW][C]22[/C][C]-0.020078[/C][C]-0.1376[/C][C]0.554446[/C][/ROW]
[ROW][C]23[/C][C]0.2289[/C][C]1.5693[/C][C]0.061648[/C][/ROW]
[ROW][C]24[/C][C]-0.127513[/C][C]-0.8742[/C][C]0.806768[/C][/ROW]
[ROW][C]25[/C][C]-0.084616[/C][C]-0.5801[/C][C]0.717691[/C][/ROW]
[ROW][C]26[/C][C]0.034942[/C][C]0.2395[/C][C]0.405861[/C][/ROW]
[ROW][C]27[/C][C]0.158025[/C][C]1.0834[/C][C]0.142087[/C][/ROW]
[ROW][C]28[/C][C]-0.31698[/C][C]-2.1731[/C][C]0.982577[/C][/ROW]
[ROW][C]29[/C][C]0.148174[/C][C]1.0158[/C][C]0.157455[/C][/ROW]
[ROW][C]30[/C][C]0.124499[/C][C]0.8535[/C][C]0.198849[/C][/ROW]
[ROW][C]31[/C][C]-0.153737[/C][C]-1.054[/C][C]0.851356[/C][/ROW]
[ROW][C]32[/C][C]-0.038426[/C][C]-0.2634[/C][C]0.603317[/C][/ROW]
[ROW][C]33[/C][C]0.133997[/C][C]0.9186[/C][C]0.181488[/C][/ROW]
[ROW][C]34[/C][C]-0.179197[/C][C]-1.2285[/C][C]0.887314[/C][/ROW]
[ROW][C]35[/C][C]-0.04233[/C][C]-0.2902[/C][C]0.61353[/C][/ROW]
[ROW][C]36[/C][C]0.124103[/C][C]0.8508[/C][C]0.199596[/C][/ROW]
[ROW][C]37[/C][C]-0.01307[/C][C]-0.0896[/C][C]0.535507[/C][/ROW]
[ROW][C]38[/C][C]-0.055313[/C][C]-0.3792[/C][C]0.646879[/C][/ROW]
[ROW][C]39[/C][C]0.016456[/C][C]0.1128[/C][C]0.455329[/C][/ROW]
[ROW][C]40[/C][C]0.066494[/C][C]0.4559[/C][C]0.325296[/C][/ROW]
[ROW][C]41[/C][C]-0.072005[/C][C]-0.4936[/C][C]0.68807[/C][/ROW]
[ROW][C]42[/C][C]0.034629[/C][C]0.2374[/C][C]0.406688[/C][/ROW]
[ROW][C]43[/C][C]-0.039221[/C][C]-0.2689[/C][C]0.605402[/C][/ROW]
[ROW][C]44[/C][C]0.068572[/C][C]0.4701[/C][C]0.320226[/C][/ROW]
[ROW][C]45[/C][C]-0.092786[/C][C]-0.6361[/C][C]0.736104[/C][/ROW]
[ROW][C]46[/C][C]0.039145[/C][C]0.2684[/C][C]0.394796[/C][/ROW]
[ROW][C]47[/C][C]NA[/C][C]NA[/C][C]NA[/C][/ROW]
[ROW][C]48[/C][C]NA[/C][C]NA[/C][C]NA[/C][/ROW]
[ROW][C]49[/C][C]NA[/C][C]NA[/C][C]NA[/C][/ROW]
[ROW][C]50[/C][C]NA[/C][C]NA[/C][C]NA[/C][/ROW]
[ROW][C]51[/C][C]NA[/C][C]NA[/C][C]NA[/C][/ROW]
[ROW][C]52[/C][C]NA[/C][C]NA[/C][C]NA[/C][/ROW]
[ROW][C]53[/C][C]NA[/C][C]NA[/C][C]NA[/C][/ROW]
[ROW][C]54[/C][C]NA[/C][C]NA[/C][C]NA[/C][/ROW]
[ROW][C]55[/C][C]NA[/C][C]NA[/C][C]NA[/C][/ROW]
[ROW][C]56[/C][C]NA[/C][C]NA[/C][C]NA[/C][/ROW]
[ROW][C]57[/C][C]NA[/C][C]NA[/C][C]NA[/C][/ROW]
[ROW][C]58[/C][C]NA[/C][C]NA[/C][C]NA[/C][/ROW]
[ROW][C]59[/C][C]NA[/C][C]NA[/C][C]NA[/C][/ROW]
[/TABLE]
Source: https://freestatistics.org/blog/index.php?pk=3800&T=1

Globally Unique Identifier (entire table): ba.freestatistics.org/blog/index.php?pk=3800&T=1

As an alternative you can also use a QR Code:  

The GUIDs for individual cells are displayed in the table below:

Autocorrelation Function
Time lag kACF(k)T-STATP-value
016.85570
1-0.3159-2.16570.982279
2-0.230491-1.58020.939612
30.2465821.69050.048779
40.113590.77870.220019
5-0.334736-2.29480.986873
60.177671.2180.114643
70.1203480.82510.206752
8-0.210992-1.44650.922662
9-0.06174-0.42330.662984
100.2638261.80870.038449
11-0.191726-1.31440.902456
12-0.190364-1.30510.900889
130.2372631.62660.055255
14-0.041712-0.2860.611918
15-0.151769-1.04050.848279
16-0.029201-0.20020.578903
170.2055531.40920.08268
18-0.164646-1.12880.867636
190.1202040.82410.207029
200.0993280.6810.24962
21-0.103753-0.71130.759792
22-0.020078-0.13760.554446
230.22891.56930.061648
24-0.127513-0.87420.806768
25-0.084616-0.58010.717691
260.0349420.23950.405861
270.1580251.08340.142087
28-0.31698-2.17310.982577
290.1481741.01580.157455
300.1244990.85350.198849
31-0.153737-1.0540.851356
32-0.038426-0.26340.603317
330.1339970.91860.181488
34-0.179197-1.22850.887314
35-0.04233-0.29020.61353
360.1241030.85080.199596
37-0.01307-0.08960.535507
38-0.055313-0.37920.646879
390.0164560.11280.455329
400.0664940.45590.325296
41-0.072005-0.49360.68807
420.0346290.23740.406688
43-0.039221-0.26890.605402
440.0685720.47010.320226
45-0.092786-0.63610.736104
460.0391450.26840.394796
47NANANA
48NANANA
49NANANA
50NANANA
51NANANA
52NANANA
53NANANA
54NANANA
55NANANA
56NANANA
57NANANA
58NANANA
59NANANA


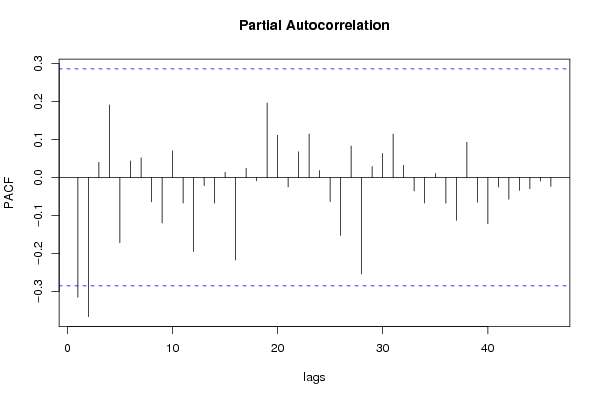
Partial Autocorrelation Function
Time lag kPACF(k)T-STATP-value
0-0.3159-2.16570.982279
1-0.366897-2.51530.992315
20.0399890.27420.392585
30.1909191.30890.09847
4-0.17193-1.17870.877773
50.0434830.29810.383469
60.0517640.35490.362134
7-0.064116-0.43960.668865
8-0.11978-0.82120.792152
90.0700890.48050.316549
10-0.067605-0.46350.677419
11-0.195041-1.33710.906192
12-0.021309-0.14610.557761
13-0.067708-0.46420.67767
140.0136010.09320.463052
15-0.217826-1.49330.928985
160.0241930.16590.434491
17-0.009033-0.06190.524557
180.1960921.34430.092646
190.1108620.760.225517
20-0.025214-0.17290.568248
210.0674950.46270.322848
220.1145080.7850.218188
230.0181140.12420.450851
24-0.063497-0.43530.667336
25-0.152493-1.04540.849417
260.0826670.56670.286795
27-0.254382-1.7440.956147
280.028560.19580.422805
290.063120.43270.333595
300.1144060.78430.218392
310.0320070.21940.413632
32-0.035499-0.24340.59561
33-0.067145-0.46030.676297
340.0105730.07250.471262
35-0.067908-0.46560.678157
36-0.113098-0.77540.778995
370.0925970.63480.264315
38-0.065107-0.44640.671304
39-0.121967-0.83620.796352
40-0.025441-0.17440.568855
41-0.057365-0.39330.652052
42-0.034369-0.23560.592625
43-0.029798-0.20430.580493
44-0.009671-0.06630.52629
45-0.023667-0.16230.5641
46NANANA
47NANANA
48NANANA
49NANANA
50NANANA
51NANANA
52NANANA
53NANANA
54NANANA
55NANANA
56NANANA
57NANANA
58NANANA
59NANANA

\begin{tabular}{lllllllll}
\hline
Partial Autocorrelation Function \tabularnewline
Time lag k & PACF(k) & T-STAT & P-value \tabularnewline
0 & -0.3159 & -2.1657 & 0.982279 \tabularnewline
1 & -0.366897 & -2.5153 & 0.992315 \tabularnewline
2 & 0.039989 & 0.2742 & 0.392585 \tabularnewline
3 & 0.190919 & 1.3089 & 0.09847 \tabularnewline
4 & -0.17193 & -1.1787 & 0.877773 \tabularnewline
5 & 0.043483 & 0.2981 & 0.383469 \tabularnewline
6 & 0.051764 & 0.3549 & 0.362134 \tabularnewline
7 & -0.064116 & -0.4396 & 0.668865 \tabularnewline
8 & -0.11978 & -0.8212 & 0.792152 \tabularnewline
9 & 0.070089 & 0.4805 & 0.316549 \tabularnewline
10 & -0.067605 & -0.4635 & 0.677419 \tabularnewline
11 & -0.195041 & -1.3371 & 0.906192 \tabularnewline
12 & -0.021309 & -0.1461 & 0.557761 \tabularnewline
13 & -0.067708 & -0.4642 & 0.67767 \tabularnewline
14 & 0.013601 & 0.0932 & 0.463052 \tabularnewline
15 & -0.217826 & -1.4933 & 0.928985 \tabularnewline
16 & 0.024193 & 0.1659 & 0.434491 \tabularnewline
17 & -0.009033 & -0.0619 & 0.524557 \tabularnewline
18 & 0.196092 & 1.3443 & 0.092646 \tabularnewline
19 & 0.110862 & 0.76 & 0.225517 \tabularnewline
20 & -0.025214 & -0.1729 & 0.568248 \tabularnewline
21 & 0.067495 & 0.4627 & 0.322848 \tabularnewline
22 & 0.114508 & 0.785 & 0.218188 \tabularnewline
23 & 0.018114 & 0.1242 & 0.450851 \tabularnewline
24 & -0.063497 & -0.4353 & 0.667336 \tabularnewline
25 & -0.152493 & -1.0454 & 0.849417 \tabularnewline
26 & 0.082667 & 0.5667 & 0.286795 \tabularnewline
27 & -0.254382 & -1.744 & 0.956147 \tabularnewline
28 & 0.02856 & 0.1958 & 0.422805 \tabularnewline
29 & 0.06312 & 0.4327 & 0.333595 \tabularnewline
30 & 0.114406 & 0.7843 & 0.218392 \tabularnewline
31 & 0.032007 & 0.2194 & 0.413632 \tabularnewline
32 & -0.035499 & -0.2434 & 0.59561 \tabularnewline
33 & -0.067145 & -0.4603 & 0.676297 \tabularnewline
34 & 0.010573 & 0.0725 & 0.471262 \tabularnewline
35 & -0.067908 & -0.4656 & 0.678157 \tabularnewline
36 & -0.113098 & -0.7754 & 0.778995 \tabularnewline
37 & 0.092597 & 0.6348 & 0.264315 \tabularnewline
38 & -0.065107 & -0.4464 & 0.671304 \tabularnewline
39 & -0.121967 & -0.8362 & 0.796352 \tabularnewline
40 & -0.025441 & -0.1744 & 0.568855 \tabularnewline
41 & -0.057365 & -0.3933 & 0.652052 \tabularnewline
42 & -0.034369 & -0.2356 & 0.592625 \tabularnewline
43 & -0.029798 & -0.2043 & 0.580493 \tabularnewline
44 & -0.009671 & -0.0663 & 0.52629 \tabularnewline
45 & -0.023667 & -0.1623 & 0.5641 \tabularnewline
46 & NA & NA & NA \tabularnewline
47 & NA & NA & NA \tabularnewline
48 & NA & NA & NA \tabularnewline
49 & NA & NA & NA \tabularnewline
50 & NA & NA & NA \tabularnewline
51 & NA & NA & NA \tabularnewline
52 & NA & NA & NA \tabularnewline
53 & NA & NA & NA \tabularnewline
54 & NA & NA & NA \tabularnewline
55 & NA & NA & NA \tabularnewline
56 & NA & NA & NA \tabularnewline
57 & NA & NA & NA \tabularnewline
58 & NA & NA & NA \tabularnewline
59 & NA & NA & NA \tabularnewline
\hline
\end{tabular}
%Source: https://freestatistics.org/blog/index.php?pk=3800&T=2

[TABLE]
[ROW][C]Partial Autocorrelation Function[/C][/ROW]
[ROW][C]Time lag k[/C][C]PACF(k)[/C][C]T-STAT[/C][C]P-value[/C][/ROW]
[ROW][C]0[/C][C]-0.3159[/C][C]-2.1657[/C][C]0.982279[/C][/ROW]
[ROW][C]1[/C][C]-0.366897[/C][C]-2.5153[/C][C]0.992315[/C][/ROW]
[ROW][C]2[/C][C]0.039989[/C][C]0.2742[/C][C]0.392585[/C][/ROW]
[ROW][C]3[/C][C]0.190919[/C][C]1.3089[/C][C]0.09847[/C][/ROW]
[ROW][C]4[/C][C]-0.17193[/C][C]-1.1787[/C][C]0.877773[/C][/ROW]
[ROW][C]5[/C][C]0.043483[/C][C]0.2981[/C][C]0.383469[/C][/ROW]
[ROW][C]6[/C][C]0.051764[/C][C]0.3549[/C][C]0.362134[/C][/ROW]
[ROW][C]7[/C][C]-0.064116[/C][C]-0.4396[/C][C]0.668865[/C][/ROW]
[ROW][C]8[/C][C]-0.11978[/C][C]-0.8212[/C][C]0.792152[/C][/ROW]
[ROW][C]9[/C][C]0.070089[/C][C]0.4805[/C][C]0.316549[/C][/ROW]
[ROW][C]10[/C][C]-0.067605[/C][C]-0.4635[/C][C]0.677419[/C][/ROW]
[ROW][C]11[/C][C]-0.195041[/C][C]-1.3371[/C][C]0.906192[/C][/ROW]
[ROW][C]12[/C][C]-0.021309[/C][C]-0.1461[/C][C]0.557761[/C][/ROW]
[ROW][C]13[/C][C]-0.067708[/C][C]-0.4642[/C][C]0.67767[/C][/ROW]
[ROW][C]14[/C][C]0.013601[/C][C]0.0932[/C][C]0.463052[/C][/ROW]
[ROW][C]15[/C][C]-0.217826[/C][C]-1.4933[/C][C]0.928985[/C][/ROW]
[ROW][C]16[/C][C]0.024193[/C][C]0.1659[/C][C]0.434491[/C][/ROW]
[ROW][C]17[/C][C]-0.009033[/C][C]-0.0619[/C][C]0.524557[/C][/ROW]
[ROW][C]18[/C][C]0.196092[/C][C]1.3443[/C][C]0.092646[/C][/ROW]
[ROW][C]19[/C][C]0.110862[/C][C]0.76[/C][C]0.225517[/C][/ROW]
[ROW][C]20[/C][C]-0.025214[/C][C]-0.1729[/C][C]0.568248[/C][/ROW]
[ROW][C]21[/C][C]0.067495[/C][C]0.4627[/C][C]0.322848[/C][/ROW]
[ROW][C]22[/C][C]0.114508[/C][C]0.785[/C][C]0.218188[/C][/ROW]
[ROW][C]23[/C][C]0.018114[/C][C]0.1242[/C][C]0.450851[/C][/ROW]
[ROW][C]24[/C][C]-0.063497[/C][C]-0.4353[/C][C]0.667336[/C][/ROW]
[ROW][C]25[/C][C]-0.152493[/C][C]-1.0454[/C][C]0.849417[/C][/ROW]
[ROW][C]26[/C][C]0.082667[/C][C]0.5667[/C][C]0.286795[/C][/ROW]
[ROW][C]27[/C][C]-0.254382[/C][C]-1.744[/C][C]0.956147[/C][/ROW]
[ROW][C]28[/C][C]0.02856[/C][C]0.1958[/C][C]0.422805[/C][/ROW]
[ROW][C]29[/C][C]0.06312[/C][C]0.4327[/C][C]0.333595[/C][/ROW]
[ROW][C]30[/C][C]0.114406[/C][C]0.7843[/C][C]0.218392[/C][/ROW]
[ROW][C]31[/C][C]0.032007[/C][C]0.2194[/C][C]0.413632[/C][/ROW]
[ROW][C]32[/C][C]-0.035499[/C][C]-0.2434[/C][C]0.59561[/C][/ROW]
[ROW][C]33[/C][C]-0.067145[/C][C]-0.4603[/C][C]0.676297[/C][/ROW]
[ROW][C]34[/C][C]0.010573[/C][C]0.0725[/C][C]0.471262[/C][/ROW]
[ROW][C]35[/C][C]-0.067908[/C][C]-0.4656[/C][C]0.678157[/C][/ROW]
[ROW][C]36[/C][C]-0.113098[/C][C]-0.7754[/C][C]0.778995[/C][/ROW]
[ROW][C]37[/C][C]0.092597[/C][C]0.6348[/C][C]0.264315[/C][/ROW]
[ROW][C]38[/C][C]-0.065107[/C][C]-0.4464[/C][C]0.671304[/C][/ROW]
[ROW][C]39[/C][C]-0.121967[/C][C]-0.8362[/C][C]0.796352[/C][/ROW]
[ROW][C]40[/C][C]-0.025441[/C][C]-0.1744[/C][C]0.568855[/C][/ROW]
[ROW][C]41[/C][C]-0.057365[/C][C]-0.3933[/C][C]0.652052[/C][/ROW]
[ROW][C]42[/C][C]-0.034369[/C][C]-0.2356[/C][C]0.592625[/C][/ROW]
[ROW][C]43[/C][C]-0.029798[/C][C]-0.2043[/C][C]0.580493[/C][/ROW]
[ROW][C]44[/C][C]-0.009671[/C][C]-0.0663[/C][C]0.52629[/C][/ROW]
[ROW][C]45[/C][C]-0.023667[/C][C]-0.1623[/C][C]0.5641[/C][/ROW]
[ROW][C]46[/C][C]NA[/C][C]NA[/C][C]NA[/C][/ROW]
[ROW][C]47[/C][C]NA[/C][C]NA[/C][C]NA[/C][/ROW]
[ROW][C]48[/C][C]NA[/C][C]NA[/C][C]NA[/C][/ROW]
[ROW][C]49[/C][C]NA[/C][C]NA[/C][C]NA[/C][/ROW]
[ROW][C]50[/C][C]NA[/C][C]NA[/C][C]NA[/C][/ROW]
[ROW][C]51[/C][C]NA[/C][C]NA[/C][C]NA[/C][/ROW]
[ROW][C]52[/C][C]NA[/C][C]NA[/C][C]NA[/C][/ROW]
[ROW][C]53[/C][C]NA[/C][C]NA[/C][C]NA[/C][/ROW]
[ROW][C]54[/C][C]NA[/C][C]NA[/C][C]NA[/C][/ROW]
[ROW][C]55[/C][C]NA[/C][C]NA[/C][C]NA[/C][/ROW]
[ROW][C]56[/C][C]NA[/C][C]NA[/C][C]NA[/C][/ROW]
[ROW][C]57[/C][C]NA[/C][C]NA[/C][C]NA[/C][/ROW]
[ROW][C]58[/C][C]NA[/C][C]NA[/C][C]NA[/C][/ROW]
[ROW][C]59[/C][C]NA[/C][C]NA[/C][C]NA[/C][/ROW]
[/TABLE]
Source: https://freestatistics.org/blog/index.php?pk=3800&T=2

Globally Unique Identifier (entire table): ba.freestatistics.org/blog/index.php?pk=3800&T=2

As an alternative you can also use a QR Code:  

The GUIDs for individual cells are displayed in the table below:

Partial Autocorrelation Function
Time lag kPACF(k)T-STATP-value
0-0.3159-2.16570.982279
1-0.366897-2.51530.992315
20.0399890.27420.392585
30.1909191.30890.09847
4-0.17193-1.17870.877773
50.0434830.29810.383469
60.0517640.35490.362134
7-0.064116-0.43960.668865
8-0.11978-0.82120.792152
90.0700890.48050.316549
10-0.067605-0.46350.677419
11-0.195041-1.33710.906192
12-0.021309-0.14610.557761
13-0.067708-0.46420.67767
140.0136010.09320.463052
15-0.217826-1.49330.928985
160.0241930.16590.434491
17-0.009033-0.06190.524557
180.1960921.34430.092646
190.1108620.760.225517
20-0.025214-0.17290.568248
210.0674950.46270.322848
220.1145080.7850.218188
230.0181140.12420.450851
24-0.063497-0.43530.667336
25-0.152493-1.04540.849417
260.0826670.56670.286795
27-0.254382-1.7440.956147
280.028560.19580.422805
290.063120.43270.333595
300.1144060.78430.218392
310.0320070.21940.413632
32-0.035499-0.24340.59561
33-0.067145-0.46030.676297
340.0105730.07250.471262
35-0.067908-0.46560.678157
36-0.113098-0.77540.778995
370.0925970.63480.264315
38-0.065107-0.44640.671304
39-0.121967-0.83620.796352
40-0.025441-0.17440.568855
41-0.057365-0.39330.652052
42-0.034369-0.23560.592625
43-0.029798-0.20430.580493
44-0.009671-0.06630.52629
45-0.023667-0.16230.5641
46NANANA
47NANANA
48NANANA
49NANANA
50NANANA
51NANANA
52NANANA
53NANANA
54NANANA
55NANANA
56NANANA
57NANANA
58NANANA
59NANANA


Parameters (Session):
par1 = 60 ; par2 = 1 ; par3 = 1 ; par4 = 1 ; par5 = 12 ;
Parameters (R input):
par1 = 60 ; par2 = 1 ; par3 = 1 ; par4 = 1 ; par5 = 12 ;
R code (references can be found in the software module):
if (par1 == 'Default') {
par1 = 10*log10(length(x))
} else {
par1 <- as.numeric(par1)
}
par2 <- as.numeric(par2)
par3 <- as.numeric(par3)
par4 <- as.numeric(par4)
par5 <- as.numeric(par5)
if (par2 == 0) {
x <- log(x)
} else {
x <- (x ^ par2 - 1) / par2
}
if (par3 > 0) x <- diff(x,lag=1,difference=par3)
if (par4 > 0) x <- diff(x,lag=par5,difference=par4)
bitmap(file='pic1.png')
racf <- acf(x,par1,main='Autocorrelation',xlab='lags',ylab='ACF')
dev.off()
bitmap(file='pic2.png')
rpacf <- pacf(x,par1,main='Partial Autocorrelation',xlab='lags',ylab='PACF')
dev.off()
(myacf <- c(racf$acf))
(mypacf <- c(rpacf$acf))
lengthx <- length(x)
sqrtn <- sqrt(lengthx)
load(file='createtable')
a<-table.start()
a<-table.row.start(a)
a<-table.element(a,'Autocorrelation Function',4,TRUE)
a<-table.row.end(a)
a<-table.row.start(a)
a<-table.element(a,'Time lag k',header=TRUE)
a<-table.element(a,hyperlink('basics.htm','ACF(k)','click here for more information about the Autocorrelation Function'),header=TRUE)
a<-table.element(a,'T-STAT',header=TRUE)
a<-table.element(a,'P-value',header=TRUE)
a<-table.row.end(a)
for (i in 1:par1) {
a<-table.row.start(a)
a<-table.element(a,i-1,header=TRUE)
a<-table.element(a,round(myacf[i],6))
mytstat <- myacf[i]*sqrtn
a<-table.element(a,round(mytstat,4))
a<-table.element(a,round(1-pt(mytstat,lengthx),6))
a<-table.row.end(a)
}
a<-table.end(a)
table.save(a,file='mytable.tab')
a<-table.start()
a<-table.row.start(a)
a<-table.element(a,'Partial Autocorrelation Function',4,TRUE)
a<-table.row.end(a)
a<-table.row.start(a)
a<-table.element(a,'Time lag k',header=TRUE)
a<-table.element(a,hyperlink('basics.htm','PACF(k)','click here for more information about the Partial Autocorrelation Function'),header=TRUE)
a<-table.element(a,'T-STAT',header=TRUE)
a<-table.element(a,'P-value',header=TRUE)
a<-table.row.end(a)
for (i in 1:par1) {
a<-table.row.start(a)
a<-table.element(a,i-1,header=TRUE)
a<-table.element(a,round(mypacf[i],6))
mytstat <- mypacf[i]*sqrtn
a<-table.element(a,round(mytstat,4))
a<-table.element(a,round(1-pt(mytstat,lengthx),6))
a<-table.row.end(a)
}
a<-table.end(a)
table.save(a,file='mytable1.tab')