Free Statistics

of Irreproducible Research!

Author's title

Author*Unverified author*
R Software Modulerwasp_autocorrelation.wasp
Title produced by software(Partial) Autocorrelation Function
Date of computationFri, 14 Dec 2007 03:19:58 -0700
Cite this page as followsStatistical Computations at FreeStatistics.org, Office for Research Development and Education, URL https://freestatistics.org/blog/index.php?v=date/2007/Dec/14/t11976266542bxgad5g794ylio.htm/, Retrieved Thu, 02 May 2024 22:39:11 +0000
Statistical Computations at FreeStatistics.org, Office for Research Development and Education, URL https://freestatistics.org/blog/index.php?pk=3797, Retrieved Thu, 02 May 2024 22:39:11 +0000
QR Codes:

Original text written by user:
IsPrivate?No (this computation is public)
User-defined keywordss0650550 s0650062
Estimated Impact223
Family? (F = Feedback message, R = changed R code, M = changed R Module, P = changed Parameters, D = changed Data)
-     [Standard Deviation-Mean Plot] [Inducing Stationa...] [2007-11-29 14:28:06] [68a1fecd8f1c75119cd425050381cede]
- RMPD    [(Partial) Autocorrelation Function] [Time series] [2007-12-14 10:19:58] [ab924f39c1cc7a5dd22761038b10db61] [Current]
Feedback Forum

Post a new message
Dataseries X:
263418000000
262752000000
266433000000
267722000000
266003000000
262971000000
265521000000
264676000000
270223000000
269508000000
268457000000
265814000000
266680000000
263018000000
269285000000
269829000000
270911000000
266844000000
271244000000
269907000000
271296000000
270157000000
271322000000
267179000000
264101000000
265518000000
269419000000
268714000000
272482000000
268351000000
268175000000
270674000000
272764000000
272599000000
270333000000
270846000000
270491000000
269160000000
274027000000
273784000000
276663000000
274525000000
271344000000
271115000000
270798000000
273911000000
273985000000
271917000000
273338000000
270601000000
273547000000
275363000000
281229000000
277793000000
279913000000
282500000000
280041000000
282166000000
290304000000
283519000000


Summary of compuational transaction
Raw Inputview raw input (R code)
Raw Outputview raw output of R engine
Computing time1 seconds
R Server'Gwilym Jenkins' @ 72.249.127.135

\begin{tabular}{lllllllll}
\hline
Summary of compuational transaction \tabularnewline
Raw Input & view raw input (R code)  \tabularnewline
Raw Output & view raw output of R engine  \tabularnewline
Computing time & 1 seconds \tabularnewline
R Server & 'Gwilym Jenkins' @ 72.249.127.135 \tabularnewline
\hline
\end{tabular}
%Source: https://freestatistics.org/blog/index.php?pk=3797&T=0

[TABLE]
[ROW][C]Summary of compuational transaction[/C][/ROW]
[ROW][C]Raw Input[/C][C]view raw input (R code) [/C][/ROW]
[ROW][C]Raw Output[/C][C]view raw output of R engine [/C][/ROW]
[ROW][C]Computing time[/C][C]1 seconds[/C][/ROW]
[ROW][C]R Server[/C][C]'Gwilym Jenkins' @ 72.249.127.135[/C][/ROW]
[/TABLE]
Source: https://freestatistics.org/blog/index.php?pk=3797&T=0

Globally Unique Identifier (entire table): ba.freestatistics.org/blog/index.php?pk=3797&T=0

As an alternative you can also use a QR Code:  

The GUIDs for individual cells are displayed in the table below:

Summary of compuational transaction
Raw Inputview raw input (R code)
Raw Outputview raw output of R engine
Computing time1 seconds
R Server'Gwilym Jenkins' @ 72.249.127.135


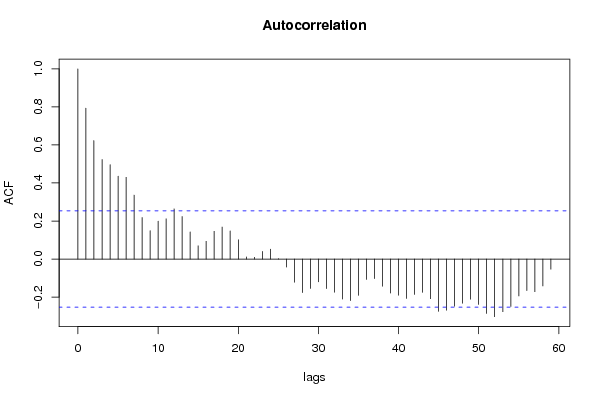
Autocorrelation Function
Time lag kACF(k)T-STATP-value
017.7460
10.7935266.14660
20.622934.82525e-06
30.5234294.05457.3e-05
40.4961183.84290.000148
50.4361643.37850.000643
60.4300523.33120.000742
70.3361772.6040.005798
80.2178691.68760.04834
90.149031.15440.126461
100.1988721.54050.064354
110.2115941.6390.053223
120.2638282.04360.022695
130.2233571.73010.044375
140.1426851.10520.136736
150.0698110.54080.295339
160.0934250.72370.236042
170.1455761.12760.131984
180.1684541.30480.098465
190.1478191.1450.128378
200.1012680.78440.21794
210.0111830.08660.46563
220.009060.07020.472143
230.0397660.3080.379566
240.0519750.40260.344338
250.0016480.01280.494929
26-0.042172-0.32670.627471
27-0.122045-0.94540.825865
28-0.176504-1.36720.911667
29-0.154858-1.19950.88248
30-0.120025-0.92970.821877
31-0.155428-1.20390.883329
32-0.174628-1.35270.90938
33-0.210805-1.63290.946135
34-0.21839-1.69160.952049
35-0.191239-1.48130.928124
36-0.107281-0.8310.795364
37-0.102979-0.79770.785897
38-0.142742-1.10570.86336
39-0.179013-1.38660.914657
40-0.190342-1.47440.927196
41-0.207643-1.60840.943501
42-0.186278-1.44290.922875
43-0.175386-1.35850.91031
44-0.208416-1.61440.944154
45-0.274936-2.12960.981344
46-0.269504-2.08760.979454
47-0.248376-1.92390.970444
48-0.232204-1.79860.961448
49-0.21101-1.63450.946302
50-0.238638-1.84850.965269
51-0.286414-2.21860.984844
52-0.303216-2.34870.988925
53-0.27739-2.14870.982146
54-0.249712-1.93430.9711
55-0.194481-1.50640.931399
56-0.166256-1.28780.898621
57-0.171641-1.32950.905646
58-0.141901-1.09920.861955
59-0.053764-0.41650.660719

\begin{tabular}{lllllllll}
\hline
Autocorrelation Function \tabularnewline
Time lag k & ACF(k) & T-STAT & P-value \tabularnewline
0 & 1 & 7.746 & 0 \tabularnewline
1 & 0.793526 & 6.1466 & 0 \tabularnewline
2 & 0.62293 & 4.8252 & 5e-06 \tabularnewline
3 & 0.523429 & 4.0545 & 7.3e-05 \tabularnewline
4 & 0.496118 & 3.8429 & 0.000148 \tabularnewline
5 & 0.436164 & 3.3785 & 0.000643 \tabularnewline
6 & 0.430052 & 3.3312 & 0.000742 \tabularnewline
7 & 0.336177 & 2.604 & 0.005798 \tabularnewline
8 & 0.217869 & 1.6876 & 0.04834 \tabularnewline
9 & 0.14903 & 1.1544 & 0.126461 \tabularnewline
10 & 0.198872 & 1.5405 & 0.064354 \tabularnewline
11 & 0.211594 & 1.639 & 0.053223 \tabularnewline
12 & 0.263828 & 2.0436 & 0.022695 \tabularnewline
13 & 0.223357 & 1.7301 & 0.044375 \tabularnewline
14 & 0.142685 & 1.1052 & 0.136736 \tabularnewline
15 & 0.069811 & 0.5408 & 0.295339 \tabularnewline
16 & 0.093425 & 0.7237 & 0.236042 \tabularnewline
17 & 0.145576 & 1.1276 & 0.131984 \tabularnewline
18 & 0.168454 & 1.3048 & 0.098465 \tabularnewline
19 & 0.147819 & 1.145 & 0.128378 \tabularnewline
20 & 0.101268 & 0.7844 & 0.21794 \tabularnewline
21 & 0.011183 & 0.0866 & 0.46563 \tabularnewline
22 & 0.00906 & 0.0702 & 0.472143 \tabularnewline
23 & 0.039766 & 0.308 & 0.379566 \tabularnewline
24 & 0.051975 & 0.4026 & 0.344338 \tabularnewline
25 & 0.001648 & 0.0128 & 0.494929 \tabularnewline
26 & -0.042172 & -0.3267 & 0.627471 \tabularnewline
27 & -0.122045 & -0.9454 & 0.825865 \tabularnewline
28 & -0.176504 & -1.3672 & 0.911667 \tabularnewline
29 & -0.154858 & -1.1995 & 0.88248 \tabularnewline
30 & -0.120025 & -0.9297 & 0.821877 \tabularnewline
31 & -0.155428 & -1.2039 & 0.883329 \tabularnewline
32 & -0.174628 & -1.3527 & 0.90938 \tabularnewline
33 & -0.210805 & -1.6329 & 0.946135 \tabularnewline
34 & -0.21839 & -1.6916 & 0.952049 \tabularnewline
35 & -0.191239 & -1.4813 & 0.928124 \tabularnewline
36 & -0.107281 & -0.831 & 0.795364 \tabularnewline
37 & -0.102979 & -0.7977 & 0.785897 \tabularnewline
38 & -0.142742 & -1.1057 & 0.86336 \tabularnewline
39 & -0.179013 & -1.3866 & 0.914657 \tabularnewline
40 & -0.190342 & -1.4744 & 0.927196 \tabularnewline
41 & -0.207643 & -1.6084 & 0.943501 \tabularnewline
42 & -0.186278 & -1.4429 & 0.922875 \tabularnewline
43 & -0.175386 & -1.3585 & 0.91031 \tabularnewline
44 & -0.208416 & -1.6144 & 0.944154 \tabularnewline
45 & -0.274936 & -2.1296 & 0.981344 \tabularnewline
46 & -0.269504 & -2.0876 & 0.979454 \tabularnewline
47 & -0.248376 & -1.9239 & 0.970444 \tabularnewline
48 & -0.232204 & -1.7986 & 0.961448 \tabularnewline
49 & -0.21101 & -1.6345 & 0.946302 \tabularnewline
50 & -0.238638 & -1.8485 & 0.965269 \tabularnewline
51 & -0.286414 & -2.2186 & 0.984844 \tabularnewline
52 & -0.303216 & -2.3487 & 0.988925 \tabularnewline
53 & -0.27739 & -2.1487 & 0.982146 \tabularnewline
54 & -0.249712 & -1.9343 & 0.9711 \tabularnewline
55 & -0.194481 & -1.5064 & 0.931399 \tabularnewline
56 & -0.166256 & -1.2878 & 0.898621 \tabularnewline
57 & -0.171641 & -1.3295 & 0.905646 \tabularnewline
58 & -0.141901 & -1.0992 & 0.861955 \tabularnewline
59 & -0.053764 & -0.4165 & 0.660719 \tabularnewline
\hline
\end{tabular}
%Source: https://freestatistics.org/blog/index.php?pk=3797&T=1

[TABLE]
[ROW][C]Autocorrelation Function[/C][/ROW]
[ROW][C]Time lag k[/C][C]ACF(k)[/C][C]T-STAT[/C][C]P-value[/C][/ROW]
[ROW][C]0[/C][C]1[/C][C]7.746[/C][C]0[/C][/ROW]
[ROW][C]1[/C][C]0.793526[/C][C]6.1466[/C][C]0[/C][/ROW]
[ROW][C]2[/C][C]0.62293[/C][C]4.8252[/C][C]5e-06[/C][/ROW]
[ROW][C]3[/C][C]0.523429[/C][C]4.0545[/C][C]7.3e-05[/C][/ROW]
[ROW][C]4[/C][C]0.496118[/C][C]3.8429[/C][C]0.000148[/C][/ROW]
[ROW][C]5[/C][C]0.436164[/C][C]3.3785[/C][C]0.000643[/C][/ROW]
[ROW][C]6[/C][C]0.430052[/C][C]3.3312[/C][C]0.000742[/C][/ROW]
[ROW][C]7[/C][C]0.336177[/C][C]2.604[/C][C]0.005798[/C][/ROW]
[ROW][C]8[/C][C]0.217869[/C][C]1.6876[/C][C]0.04834[/C][/ROW]
[ROW][C]9[/C][C]0.14903[/C][C]1.1544[/C][C]0.126461[/C][/ROW]
[ROW][C]10[/C][C]0.198872[/C][C]1.5405[/C][C]0.064354[/C][/ROW]
[ROW][C]11[/C][C]0.211594[/C][C]1.639[/C][C]0.053223[/C][/ROW]
[ROW][C]12[/C][C]0.263828[/C][C]2.0436[/C][C]0.022695[/C][/ROW]
[ROW][C]13[/C][C]0.223357[/C][C]1.7301[/C][C]0.044375[/C][/ROW]
[ROW][C]14[/C][C]0.142685[/C][C]1.1052[/C][C]0.136736[/C][/ROW]
[ROW][C]15[/C][C]0.069811[/C][C]0.5408[/C][C]0.295339[/C][/ROW]
[ROW][C]16[/C][C]0.093425[/C][C]0.7237[/C][C]0.236042[/C][/ROW]
[ROW][C]17[/C][C]0.145576[/C][C]1.1276[/C][C]0.131984[/C][/ROW]
[ROW][C]18[/C][C]0.168454[/C][C]1.3048[/C][C]0.098465[/C][/ROW]
[ROW][C]19[/C][C]0.147819[/C][C]1.145[/C][C]0.128378[/C][/ROW]
[ROW][C]20[/C][C]0.101268[/C][C]0.7844[/C][C]0.21794[/C][/ROW]
[ROW][C]21[/C][C]0.011183[/C][C]0.0866[/C][C]0.46563[/C][/ROW]
[ROW][C]22[/C][C]0.00906[/C][C]0.0702[/C][C]0.472143[/C][/ROW]
[ROW][C]23[/C][C]0.039766[/C][C]0.308[/C][C]0.379566[/C][/ROW]
[ROW][C]24[/C][C]0.051975[/C][C]0.4026[/C][C]0.344338[/C][/ROW]
[ROW][C]25[/C][C]0.001648[/C][C]0.0128[/C][C]0.494929[/C][/ROW]
[ROW][C]26[/C][C]-0.042172[/C][C]-0.3267[/C][C]0.627471[/C][/ROW]
[ROW][C]27[/C][C]-0.122045[/C][C]-0.9454[/C][C]0.825865[/C][/ROW]
[ROW][C]28[/C][C]-0.176504[/C][C]-1.3672[/C][C]0.911667[/C][/ROW]
[ROW][C]29[/C][C]-0.154858[/C][C]-1.1995[/C][C]0.88248[/C][/ROW]
[ROW][C]30[/C][C]-0.120025[/C][C]-0.9297[/C][C]0.821877[/C][/ROW]
[ROW][C]31[/C][C]-0.155428[/C][C]-1.2039[/C][C]0.883329[/C][/ROW]
[ROW][C]32[/C][C]-0.174628[/C][C]-1.3527[/C][C]0.90938[/C][/ROW]
[ROW][C]33[/C][C]-0.210805[/C][C]-1.6329[/C][C]0.946135[/C][/ROW]
[ROW][C]34[/C][C]-0.21839[/C][C]-1.6916[/C][C]0.952049[/C][/ROW]
[ROW][C]35[/C][C]-0.191239[/C][C]-1.4813[/C][C]0.928124[/C][/ROW]
[ROW][C]36[/C][C]-0.107281[/C][C]-0.831[/C][C]0.795364[/C][/ROW]
[ROW][C]37[/C][C]-0.102979[/C][C]-0.7977[/C][C]0.785897[/C][/ROW]
[ROW][C]38[/C][C]-0.142742[/C][C]-1.1057[/C][C]0.86336[/C][/ROW]
[ROW][C]39[/C][C]-0.179013[/C][C]-1.3866[/C][C]0.914657[/C][/ROW]
[ROW][C]40[/C][C]-0.190342[/C][C]-1.4744[/C][C]0.927196[/C][/ROW]
[ROW][C]41[/C][C]-0.207643[/C][C]-1.6084[/C][C]0.943501[/C][/ROW]
[ROW][C]42[/C][C]-0.186278[/C][C]-1.4429[/C][C]0.922875[/C][/ROW]
[ROW][C]43[/C][C]-0.175386[/C][C]-1.3585[/C][C]0.91031[/C][/ROW]
[ROW][C]44[/C][C]-0.208416[/C][C]-1.6144[/C][C]0.944154[/C][/ROW]
[ROW][C]45[/C][C]-0.274936[/C][C]-2.1296[/C][C]0.981344[/C][/ROW]
[ROW][C]46[/C][C]-0.269504[/C][C]-2.0876[/C][C]0.979454[/C][/ROW]
[ROW][C]47[/C][C]-0.248376[/C][C]-1.9239[/C][C]0.970444[/C][/ROW]
[ROW][C]48[/C][C]-0.232204[/C][C]-1.7986[/C][C]0.961448[/C][/ROW]
[ROW][C]49[/C][C]-0.21101[/C][C]-1.6345[/C][C]0.946302[/C][/ROW]
[ROW][C]50[/C][C]-0.238638[/C][C]-1.8485[/C][C]0.965269[/C][/ROW]
[ROW][C]51[/C][C]-0.286414[/C][C]-2.2186[/C][C]0.984844[/C][/ROW]
[ROW][C]52[/C][C]-0.303216[/C][C]-2.3487[/C][C]0.988925[/C][/ROW]
[ROW][C]53[/C][C]-0.27739[/C][C]-2.1487[/C][C]0.982146[/C][/ROW]
[ROW][C]54[/C][C]-0.249712[/C][C]-1.9343[/C][C]0.9711[/C][/ROW]
[ROW][C]55[/C][C]-0.194481[/C][C]-1.5064[/C][C]0.931399[/C][/ROW]
[ROW][C]56[/C][C]-0.166256[/C][C]-1.2878[/C][C]0.898621[/C][/ROW]
[ROW][C]57[/C][C]-0.171641[/C][C]-1.3295[/C][C]0.905646[/C][/ROW]
[ROW][C]58[/C][C]-0.141901[/C][C]-1.0992[/C][C]0.861955[/C][/ROW]
[ROW][C]59[/C][C]-0.053764[/C][C]-0.4165[/C][C]0.660719[/C][/ROW]
[/TABLE]
Source: https://freestatistics.org/blog/index.php?pk=3797&T=1

Globally Unique Identifier (entire table): ba.freestatistics.org/blog/index.php?pk=3797&T=1

As an alternative you can also use a QR Code:  

The GUIDs for individual cells are displayed in the table below:

Autocorrelation Function
Time lag kACF(k)T-STATP-value
017.7460
10.7935266.14660
20.622934.82525e-06
30.5234294.05457.3e-05
40.4961183.84290.000148
50.4361643.37850.000643
60.4300523.33120.000742
70.3361772.6040.005798
80.2178691.68760.04834
90.149031.15440.126461
100.1988721.54050.064354
110.2115941.6390.053223
120.2638282.04360.022695
130.2233571.73010.044375
140.1426851.10520.136736
150.0698110.54080.295339
160.0934250.72370.236042
170.1455761.12760.131984
180.1684541.30480.098465
190.1478191.1450.128378
200.1012680.78440.21794
210.0111830.08660.46563
220.009060.07020.472143
230.0397660.3080.379566
240.0519750.40260.344338
250.0016480.01280.494929
26-0.042172-0.32670.627471
27-0.122045-0.94540.825865
28-0.176504-1.36720.911667
29-0.154858-1.19950.88248
30-0.120025-0.92970.821877
31-0.155428-1.20390.883329
32-0.174628-1.35270.90938
33-0.210805-1.63290.946135
34-0.21839-1.69160.952049
35-0.191239-1.48130.928124
36-0.107281-0.8310.795364
37-0.102979-0.79770.785897
38-0.142742-1.10570.86336
39-0.179013-1.38660.914657
40-0.190342-1.47440.927196
41-0.207643-1.60840.943501
42-0.186278-1.44290.922875
43-0.175386-1.35850.91031
44-0.208416-1.61440.944154
45-0.274936-2.12960.981344
46-0.269504-2.08760.979454
47-0.248376-1.92390.970444
48-0.232204-1.79860.961448
49-0.21101-1.63450.946302
50-0.238638-1.84850.965269
51-0.286414-2.21860.984844
52-0.303216-2.34870.988925
53-0.27739-2.14870.982146
54-0.249712-1.93430.9711
55-0.194481-1.50640.931399
56-0.166256-1.28780.898621
57-0.171641-1.32950.905646
58-0.141901-1.09920.861955
59-0.053764-0.41650.660719


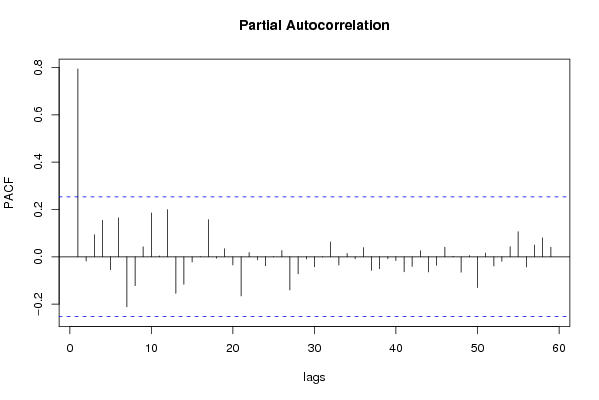
Partial Autocorrelation Function
Time lag kPACF(k)T-STATP-value
00.7935266.14660
1-0.018239-0.14130.555938
20.0933970.72350.236106
30.1541131.19380.118636
4-0.054863-0.4250.66381
50.1643931.27340.103897
6-0.211456-1.63790.946665
7-0.121973-0.94480.825725
80.0423080.32770.372134
90.1853161.43540.078176
100.0034750.02690.489308
110.1987581.53960.064461
12-0.154274-1.1950.881606
13-0.116198-0.90010.814158
14-0.021809-0.16890.56679
150.0002760.00210.499152
160.1564151.21160.115211
17-0.005796-0.04490.517829
180.0335710.260.397862
19-0.034571-0.26780.605109
20-0.165531-1.28220.897648
210.0176610.13680.445824
22-0.012649-0.0980.538863
23-0.038406-0.29750.61644
240.0009960.00770.496935
250.0264610.2050.419147
26-0.14002-1.08460.858779
27-0.071844-0.55650.710032
28-0.009508-0.07370.529234
29-0.042222-0.3270.627615
30-0.000563-0.00440.501731
310.0626830.48550.314532
32-0.035307-0.27350.60729
330.0139790.10830.457067
34-0.008719-0.06750.526811
350.0386410.29930.382869
36-0.058053-0.44970.672718
37-0.05057-0.39170.65167
38-0.008551-0.06620.526295
39-0.016217-0.12560.549774
40-0.06337-0.49090.687343
41-0.040716-0.31540.623219
420.0258520.20030.420981
43-0.063906-0.4950.6888
44-0.036129-0.27990.609724
450.0403480.31250.37786
460.0024170.01870.492561
47-0.065412-0.50670.692881
480.0050090.03880.48459
49-0.130084-1.00760.841161
500.0159010.12320.451194
51-0.038634-0.29930.61711
52-0.019123-0.14810.558631
530.0427420.33110.370869
540.1061580.82230.207083
55-0.043167-0.33440.630368
560.0495120.38350.351345
570.0796280.61680.269851
580.0398460.30860.379329
59NANANA

\begin{tabular}{lllllllll}
\hline
Partial Autocorrelation Function \tabularnewline
Time lag k & PACF(k) & T-STAT & P-value \tabularnewline
0 & 0.793526 & 6.1466 & 0 \tabularnewline
1 & -0.018239 & -0.1413 & 0.555938 \tabularnewline
2 & 0.093397 & 0.7235 & 0.236106 \tabularnewline
3 & 0.154113 & 1.1938 & 0.118636 \tabularnewline
4 & -0.054863 & -0.425 & 0.66381 \tabularnewline
5 & 0.164393 & 1.2734 & 0.103897 \tabularnewline
6 & -0.211456 & -1.6379 & 0.946665 \tabularnewline
7 & -0.121973 & -0.9448 & 0.825725 \tabularnewline
8 & 0.042308 & 0.3277 & 0.372134 \tabularnewline
9 & 0.185316 & 1.4354 & 0.078176 \tabularnewline
10 & 0.003475 & 0.0269 & 0.489308 \tabularnewline
11 & 0.198758 & 1.5396 & 0.064461 \tabularnewline
12 & -0.154274 & -1.195 & 0.881606 \tabularnewline
13 & -0.116198 & -0.9001 & 0.814158 \tabularnewline
14 & -0.021809 & -0.1689 & 0.56679 \tabularnewline
15 & 0.000276 & 0.0021 & 0.499152 \tabularnewline
16 & 0.156415 & 1.2116 & 0.115211 \tabularnewline
17 & -0.005796 & -0.0449 & 0.517829 \tabularnewline
18 & 0.033571 & 0.26 & 0.397862 \tabularnewline
19 & -0.034571 & -0.2678 & 0.605109 \tabularnewline
20 & -0.165531 & -1.2822 & 0.897648 \tabularnewline
21 & 0.017661 & 0.1368 & 0.445824 \tabularnewline
22 & -0.012649 & -0.098 & 0.538863 \tabularnewline
23 & -0.038406 & -0.2975 & 0.61644 \tabularnewline
24 & 0.000996 & 0.0077 & 0.496935 \tabularnewline
25 & 0.026461 & 0.205 & 0.419147 \tabularnewline
26 & -0.14002 & -1.0846 & 0.858779 \tabularnewline
27 & -0.071844 & -0.5565 & 0.710032 \tabularnewline
28 & -0.009508 & -0.0737 & 0.529234 \tabularnewline
29 & -0.042222 & -0.327 & 0.627615 \tabularnewline
30 & -0.000563 & -0.0044 & 0.501731 \tabularnewline
31 & 0.062683 & 0.4855 & 0.314532 \tabularnewline
32 & -0.035307 & -0.2735 & 0.60729 \tabularnewline
33 & 0.013979 & 0.1083 & 0.457067 \tabularnewline
34 & -0.008719 & -0.0675 & 0.526811 \tabularnewline
35 & 0.038641 & 0.2993 & 0.382869 \tabularnewline
36 & -0.058053 & -0.4497 & 0.672718 \tabularnewline
37 & -0.05057 & -0.3917 & 0.65167 \tabularnewline
38 & -0.008551 & -0.0662 & 0.526295 \tabularnewline
39 & -0.016217 & -0.1256 & 0.549774 \tabularnewline
40 & -0.06337 & -0.4909 & 0.687343 \tabularnewline
41 & -0.040716 & -0.3154 & 0.623219 \tabularnewline
42 & 0.025852 & 0.2003 & 0.420981 \tabularnewline
43 & -0.063906 & -0.495 & 0.6888 \tabularnewline
44 & -0.036129 & -0.2799 & 0.609724 \tabularnewline
45 & 0.040348 & 0.3125 & 0.37786 \tabularnewline
46 & 0.002417 & 0.0187 & 0.492561 \tabularnewline
47 & -0.065412 & -0.5067 & 0.692881 \tabularnewline
48 & 0.005009 & 0.0388 & 0.48459 \tabularnewline
49 & -0.130084 & -1.0076 & 0.841161 \tabularnewline
50 & 0.015901 & 0.1232 & 0.451194 \tabularnewline
51 & -0.038634 & -0.2993 & 0.61711 \tabularnewline
52 & -0.019123 & -0.1481 & 0.558631 \tabularnewline
53 & 0.042742 & 0.3311 & 0.370869 \tabularnewline
54 & 0.106158 & 0.8223 & 0.207083 \tabularnewline
55 & -0.043167 & -0.3344 & 0.630368 \tabularnewline
56 & 0.049512 & 0.3835 & 0.351345 \tabularnewline
57 & 0.079628 & 0.6168 & 0.269851 \tabularnewline
58 & 0.039846 & 0.3086 & 0.379329 \tabularnewline
59 & NA & NA & NA \tabularnewline
\hline
\end{tabular}
%Source: https://freestatistics.org/blog/index.php?pk=3797&T=2

[TABLE]
[ROW][C]Partial Autocorrelation Function[/C][/ROW]
[ROW][C]Time lag k[/C][C]PACF(k)[/C][C]T-STAT[/C][C]P-value[/C][/ROW]
[ROW][C]0[/C][C]0.793526[/C][C]6.1466[/C][C]0[/C][/ROW]
[ROW][C]1[/C][C]-0.018239[/C][C]-0.1413[/C][C]0.555938[/C][/ROW]
[ROW][C]2[/C][C]0.093397[/C][C]0.7235[/C][C]0.236106[/C][/ROW]
[ROW][C]3[/C][C]0.154113[/C][C]1.1938[/C][C]0.118636[/C][/ROW]
[ROW][C]4[/C][C]-0.054863[/C][C]-0.425[/C][C]0.66381[/C][/ROW]
[ROW][C]5[/C][C]0.164393[/C][C]1.2734[/C][C]0.103897[/C][/ROW]
[ROW][C]6[/C][C]-0.211456[/C][C]-1.6379[/C][C]0.946665[/C][/ROW]
[ROW][C]7[/C][C]-0.121973[/C][C]-0.9448[/C][C]0.825725[/C][/ROW]
[ROW][C]8[/C][C]0.042308[/C][C]0.3277[/C][C]0.372134[/C][/ROW]
[ROW][C]9[/C][C]0.185316[/C][C]1.4354[/C][C]0.078176[/C][/ROW]
[ROW][C]10[/C][C]0.003475[/C][C]0.0269[/C][C]0.489308[/C][/ROW]
[ROW][C]11[/C][C]0.198758[/C][C]1.5396[/C][C]0.064461[/C][/ROW]
[ROW][C]12[/C][C]-0.154274[/C][C]-1.195[/C][C]0.881606[/C][/ROW]
[ROW][C]13[/C][C]-0.116198[/C][C]-0.9001[/C][C]0.814158[/C][/ROW]
[ROW][C]14[/C][C]-0.021809[/C][C]-0.1689[/C][C]0.56679[/C][/ROW]
[ROW][C]15[/C][C]0.000276[/C][C]0.0021[/C][C]0.499152[/C][/ROW]
[ROW][C]16[/C][C]0.156415[/C][C]1.2116[/C][C]0.115211[/C][/ROW]
[ROW][C]17[/C][C]-0.005796[/C][C]-0.0449[/C][C]0.517829[/C][/ROW]
[ROW][C]18[/C][C]0.033571[/C][C]0.26[/C][C]0.397862[/C][/ROW]
[ROW][C]19[/C][C]-0.034571[/C][C]-0.2678[/C][C]0.605109[/C][/ROW]
[ROW][C]20[/C][C]-0.165531[/C][C]-1.2822[/C][C]0.897648[/C][/ROW]
[ROW][C]21[/C][C]0.017661[/C][C]0.1368[/C][C]0.445824[/C][/ROW]
[ROW][C]22[/C][C]-0.012649[/C][C]-0.098[/C][C]0.538863[/C][/ROW]
[ROW][C]23[/C][C]-0.038406[/C][C]-0.2975[/C][C]0.61644[/C][/ROW]
[ROW][C]24[/C][C]0.000996[/C][C]0.0077[/C][C]0.496935[/C][/ROW]
[ROW][C]25[/C][C]0.026461[/C][C]0.205[/C][C]0.419147[/C][/ROW]
[ROW][C]26[/C][C]-0.14002[/C][C]-1.0846[/C][C]0.858779[/C][/ROW]
[ROW][C]27[/C][C]-0.071844[/C][C]-0.5565[/C][C]0.710032[/C][/ROW]
[ROW][C]28[/C][C]-0.009508[/C][C]-0.0737[/C][C]0.529234[/C][/ROW]
[ROW][C]29[/C][C]-0.042222[/C][C]-0.327[/C][C]0.627615[/C][/ROW]
[ROW][C]30[/C][C]-0.000563[/C][C]-0.0044[/C][C]0.501731[/C][/ROW]
[ROW][C]31[/C][C]0.062683[/C][C]0.4855[/C][C]0.314532[/C][/ROW]
[ROW][C]32[/C][C]-0.035307[/C][C]-0.2735[/C][C]0.60729[/C][/ROW]
[ROW][C]33[/C][C]0.013979[/C][C]0.1083[/C][C]0.457067[/C][/ROW]
[ROW][C]34[/C][C]-0.008719[/C][C]-0.0675[/C][C]0.526811[/C][/ROW]
[ROW][C]35[/C][C]0.038641[/C][C]0.2993[/C][C]0.382869[/C][/ROW]
[ROW][C]36[/C][C]-0.058053[/C][C]-0.4497[/C][C]0.672718[/C][/ROW]
[ROW][C]37[/C][C]-0.05057[/C][C]-0.3917[/C][C]0.65167[/C][/ROW]
[ROW][C]38[/C][C]-0.008551[/C][C]-0.0662[/C][C]0.526295[/C][/ROW]
[ROW][C]39[/C][C]-0.016217[/C][C]-0.1256[/C][C]0.549774[/C][/ROW]
[ROW][C]40[/C][C]-0.06337[/C][C]-0.4909[/C][C]0.687343[/C][/ROW]
[ROW][C]41[/C][C]-0.040716[/C][C]-0.3154[/C][C]0.623219[/C][/ROW]
[ROW][C]42[/C][C]0.025852[/C][C]0.2003[/C][C]0.420981[/C][/ROW]
[ROW][C]43[/C][C]-0.063906[/C][C]-0.495[/C][C]0.6888[/C][/ROW]
[ROW][C]44[/C][C]-0.036129[/C][C]-0.2799[/C][C]0.609724[/C][/ROW]
[ROW][C]45[/C][C]0.040348[/C][C]0.3125[/C][C]0.37786[/C][/ROW]
[ROW][C]46[/C][C]0.002417[/C][C]0.0187[/C][C]0.492561[/C][/ROW]
[ROW][C]47[/C][C]-0.065412[/C][C]-0.5067[/C][C]0.692881[/C][/ROW]
[ROW][C]48[/C][C]0.005009[/C][C]0.0388[/C][C]0.48459[/C][/ROW]
[ROW][C]49[/C][C]-0.130084[/C][C]-1.0076[/C][C]0.841161[/C][/ROW]
[ROW][C]50[/C][C]0.015901[/C][C]0.1232[/C][C]0.451194[/C][/ROW]
[ROW][C]51[/C][C]-0.038634[/C][C]-0.2993[/C][C]0.61711[/C][/ROW]
[ROW][C]52[/C][C]-0.019123[/C][C]-0.1481[/C][C]0.558631[/C][/ROW]
[ROW][C]53[/C][C]0.042742[/C][C]0.3311[/C][C]0.370869[/C][/ROW]
[ROW][C]54[/C][C]0.106158[/C][C]0.8223[/C][C]0.207083[/C][/ROW]
[ROW][C]55[/C][C]-0.043167[/C][C]-0.3344[/C][C]0.630368[/C][/ROW]
[ROW][C]56[/C][C]0.049512[/C][C]0.3835[/C][C]0.351345[/C][/ROW]
[ROW][C]57[/C][C]0.079628[/C][C]0.6168[/C][C]0.269851[/C][/ROW]
[ROW][C]58[/C][C]0.039846[/C][C]0.3086[/C][C]0.379329[/C][/ROW]
[ROW][C]59[/C][C]NA[/C][C]NA[/C][C]NA[/C][/ROW]
[/TABLE]
Source: https://freestatistics.org/blog/index.php?pk=3797&T=2

Globally Unique Identifier (entire table): ba.freestatistics.org/blog/index.php?pk=3797&T=2

As an alternative you can also use a QR Code:  

The GUIDs for individual cells are displayed in the table below:

Partial Autocorrelation Function
Time lag kPACF(k)T-STATP-value
00.7935266.14660
1-0.018239-0.14130.555938
20.0933970.72350.236106
30.1541131.19380.118636
4-0.054863-0.4250.66381
50.1643931.27340.103897
6-0.211456-1.63790.946665
7-0.121973-0.94480.825725
80.0423080.32770.372134
90.1853161.43540.078176
100.0034750.02690.489308
110.1987581.53960.064461
12-0.154274-1.1950.881606
13-0.116198-0.90010.814158
14-0.021809-0.16890.56679
150.0002760.00210.499152
160.1564151.21160.115211
17-0.005796-0.04490.517829
180.0335710.260.397862
19-0.034571-0.26780.605109
20-0.165531-1.28220.897648
210.0176610.13680.445824
22-0.012649-0.0980.538863
23-0.038406-0.29750.61644
240.0009960.00770.496935
250.0264610.2050.419147
26-0.14002-1.08460.858779
27-0.071844-0.55650.710032
28-0.009508-0.07370.529234
29-0.042222-0.3270.627615
30-0.000563-0.00440.501731
310.0626830.48550.314532
32-0.035307-0.27350.60729
330.0139790.10830.457067
34-0.008719-0.06750.526811
350.0386410.29930.382869
36-0.058053-0.44970.672718
37-0.05057-0.39170.65167
38-0.008551-0.06620.526295
39-0.016217-0.12560.549774
40-0.06337-0.49090.687343
41-0.040716-0.31540.623219
420.0258520.20030.420981
43-0.063906-0.4950.6888
44-0.036129-0.27990.609724
450.0403480.31250.37786
460.0024170.01870.492561
47-0.065412-0.50670.692881
480.0050090.03880.48459
49-0.130084-1.00760.841161
500.0159010.12320.451194
51-0.038634-0.29930.61711
52-0.019123-0.14810.558631
530.0427420.33110.370869
540.1061580.82230.207083
55-0.043167-0.33440.630368
560.0495120.38350.351345
570.0796280.61680.269851
580.0398460.30860.379329
59NANANA


Parameters (Session):
par1 = 60 ; par2 = 1 ; par3 = 0 ; par4 = 0 ; par5 = 12 ;
Parameters (R input):
par1 = 60 ; par2 = 1 ; par3 = 0 ; par4 = 0 ; par5 = 12 ;
R code (references can be found in the software module):
if (par1 == 'Default') {
par1 = 10*log10(length(x))
} else {
par1 <- as.numeric(par1)
}
par2 <- as.numeric(par2)
par3 <- as.numeric(par3)
par4 <- as.numeric(par4)
par5 <- as.numeric(par5)
if (par2 == 0) {
x <- log(x)
} else {
x <- (x ^ par2 - 1) / par2
}
if (par3 > 0) x <- diff(x,lag=1,difference=par3)
if (par4 > 0) x <- diff(x,lag=par5,difference=par4)
bitmap(file='pic1.png')
racf <- acf(x,par1,main='Autocorrelation',xlab='lags',ylab='ACF')
dev.off()
bitmap(file='pic2.png')
rpacf <- pacf(x,par1,main='Partial Autocorrelation',xlab='lags',ylab='PACF')
dev.off()
(myacf <- c(racf$acf))
(mypacf <- c(rpacf$acf))
lengthx <- length(x)
sqrtn <- sqrt(lengthx)
load(file='createtable')
a<-table.start()
a<-table.row.start(a)
a<-table.element(a,'Autocorrelation Function',4,TRUE)
a<-table.row.end(a)
a<-table.row.start(a)
a<-table.element(a,'Time lag k',header=TRUE)
a<-table.element(a,hyperlink('basics.htm','ACF(k)','click here for more information about the Autocorrelation Function'),header=TRUE)
a<-table.element(a,'T-STAT',header=TRUE)
a<-table.element(a,'P-value',header=TRUE)
a<-table.row.end(a)
for (i in 1:par1) {
a<-table.row.start(a)
a<-table.element(a,i-1,header=TRUE)
a<-table.element(a,round(myacf[i],6))
mytstat <- myacf[i]*sqrtn
a<-table.element(a,round(mytstat,4))
a<-table.element(a,round(1-pt(mytstat,lengthx),6))
a<-table.row.end(a)
}
a<-table.end(a)
table.save(a,file='mytable.tab')
a<-table.start()
a<-table.row.start(a)
a<-table.element(a,'Partial Autocorrelation Function',4,TRUE)
a<-table.row.end(a)
a<-table.row.start(a)
a<-table.element(a,'Time lag k',header=TRUE)
a<-table.element(a,hyperlink('basics.htm','PACF(k)','click here for more information about the Partial Autocorrelation Function'),header=TRUE)
a<-table.element(a,'T-STAT',header=TRUE)
a<-table.element(a,'P-value',header=TRUE)
a<-table.row.end(a)
for (i in 1:par1) {
a<-table.row.start(a)
a<-table.element(a,i-1,header=TRUE)
a<-table.element(a,round(mypacf[i],6))
mytstat <- mypacf[i]*sqrtn
a<-table.element(a,round(mytstat,4))
a<-table.element(a,round(1-pt(mytstat,lengthx),6))
a<-table.row.end(a)
}
a<-table.end(a)
table.save(a,file='mytable1.tab')