Free Statistics

of Irreproducible Research!

Author's title

Author*Unverified author*
R Software Modulerwasp_smp.wasp
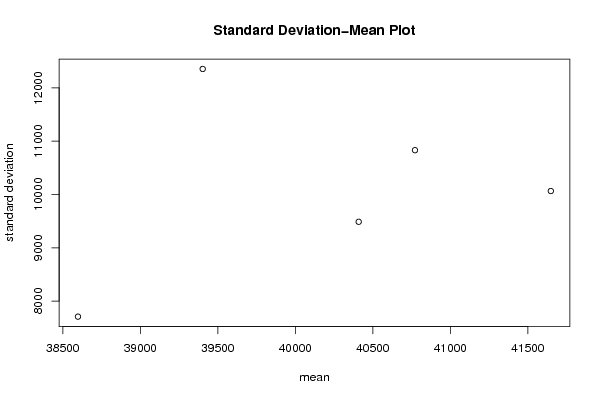
Title produced by softwareStandard Deviation-Mean Plot
Date of computationFri, 14 Dec 2007 03:01:59 -0700
Cite this page as followsStatistical Computations at FreeStatistics.org, Office for Research Development and Education, URL https://freestatistics.org/blog/index.php?v=date/2007/Dec/14/t11976259165wpls5atpocbd5r.htm/, Retrieved Thu, 02 May 2024 18:46:19 +0000
Statistical Computations at FreeStatistics.org, Office for Research Development and Education, URL https://freestatistics.org/blog/index.php?pk=3787, Retrieved Thu, 02 May 2024 18:46:19 +0000
QR Codes:

Original text written by user:
IsPrivate?No (this computation is public)
User-defined keywords
Estimated Impact221
Family? (F = Feedback message, R = changed R code, M = changed R Module, P = changed Parameters, D = changed Data)
-       [Standard Deviation-Mean Plot] [SMP - Serie 1 - P...] [2007-12-14 10:01:59] [921757a21ec3444367392306fe4aab7f] [Current]
Feedback Forum

Post a new message
Dataseries X:
20972
35681
37034
35645
33379
32747
49585
41745
48564
52518
45594
51442
25094
33702
39120
33842
29896
31481
43895
39477
53726
61465
50104
47460
26451
30306
42598
34485
29027
35489
40357
37532
43899
48572
43901
50556
18387
27534
38030
31917
26414
35306
38271
41454
52408
53536
53152
56421
21538
33625
42625
31295
33795
41227
45382
47206
46235
51378
46865
58608


Summary of compuational transaction
Raw Inputview raw input (R code)
Raw Outputview raw output of R engine
Computing time2 seconds
R Server'Gwilym Jenkins' @ 72.249.127.135

\begin{tabular}{lllllllll}
\hline
Summary of compuational transaction \tabularnewline
Raw Input & view raw input (R code)  \tabularnewline
Raw Output & view raw output of R engine  \tabularnewline
Computing time & 2 seconds \tabularnewline
R Server & 'Gwilym Jenkins' @ 72.249.127.135 \tabularnewline
\hline
\end{tabular}
%Source: https://freestatistics.org/blog/index.php?pk=3787&T=0

[TABLE]
[ROW][C]Summary of compuational transaction[/C][/ROW]
[ROW][C]Raw Input[/C][C]view raw input (R code) [/C][/ROW]
[ROW][C]Raw Output[/C][C]view raw output of R engine [/C][/ROW]
[ROW][C]Computing time[/C][C]2 seconds[/C][/ROW]
[ROW][C]R Server[/C][C]'Gwilym Jenkins' @ 72.249.127.135[/C][/ROW]
[/TABLE]
Source: https://freestatistics.org/blog/index.php?pk=3787&T=0

Globally Unique Identifier (entire table): ba.freestatistics.org/blog/index.php?pk=3787&T=0

As an alternative you can also use a QR Code:  

The GUIDs for individual cells are displayed in the table below:

Summary of compuational transaction
Raw Inputview raw input (R code)
Raw Outputview raw output of R engine
Computing time2 seconds
R Server'Gwilym Jenkins' @ 72.249.127.135


Standard Deviation-Mean Plot
SectionMeanStandard DeviationRange
140408.83333333339487.2714233654234131
240771.833333333310830.935205430933931
338597.757707.2625151393913522
439402.512354.525608051525126
541648.2510064.216061463432194

\begin{tabular}{lllllllll}
\hline
Standard Deviation-Mean Plot \tabularnewline
Section & Mean & Standard Deviation & Range \tabularnewline
1 & 40408.8333333333 & 9487.27142336542 & 34131 \tabularnewline
2 & 40771.8333333333 & 10830.9352054309 & 33931 \tabularnewline
3 & 38597.75 & 7707.26251513939 & 13522 \tabularnewline
4 & 39402.5 & 12354.5256080515 & 25126 \tabularnewline
5 & 41648.25 & 10064.2160614634 & 32194 \tabularnewline
\hline
\end{tabular}
%Source: https://freestatistics.org/blog/index.php?pk=3787&T=1

[TABLE]
[ROW][C]Standard Deviation-Mean Plot[/C][/ROW]
[ROW][C]Section[/C][C]Mean[/C][C]Standard Deviation[/C][C]Range[/C][/ROW]
[ROW][C]1[/C][C]40408.8333333333[/C][C]9487.27142336542[/C][C]34131[/C][/ROW]
[ROW][C]2[/C][C]40771.8333333333[/C][C]10830.9352054309[/C][C]33931[/C][/ROW]
[ROW][C]3[/C][C]38597.75[/C][C]7707.26251513939[/C][C]13522[/C][/ROW]
[ROW][C]4[/C][C]39402.5[/C][C]12354.5256080515[/C][C]25126[/C][/ROW]
[ROW][C]5[/C][C]41648.25[/C][C]10064.2160614634[/C][C]32194[/C][/ROW]
[/TABLE]
Source: https://freestatistics.org/blog/index.php?pk=3787&T=1

Globally Unique Identifier (entire table): ba.freestatistics.org/blog/index.php?pk=3787&T=1

As an alternative you can also use a QR Code:  

The GUIDs for individual cells are displayed in the table below:

Standard Deviation-Mean Plot
SectionMeanStandard DeviationRange
140408.83333333339487.2714233654234131
240771.833333333310830.935205430933931
338597.757707.2625151393913522
439402.512354.525608051525126
541648.2510064.216061463432194


Regression: S.E.(k) = alpha + beta * Mean(k)
alpha-6019.32933584844
beta0.401041635682198
S.D.0.797409371380172
T-STAT0.502930677862573
p-value0.649613957163855

\begin{tabular}{lllllllll}
\hline
Regression: S.E.(k) = alpha + beta * Mean(k) \tabularnewline
alpha & -6019.32933584844 \tabularnewline
beta & 0.401041635682198 \tabularnewline
S.D. & 0.797409371380172 \tabularnewline
T-STAT & 0.502930677862573 \tabularnewline
p-value & 0.649613957163855 \tabularnewline
\hline
\end{tabular}
%Source: https://freestatistics.org/blog/index.php?pk=3787&T=2

[TABLE]
[ROW][C]Regression: S.E.(k) = alpha + beta * Mean(k)[/C][/ROW]
[ROW][C]alpha[/C][C]-6019.32933584844[/C][/ROW]
[ROW][C]beta[/C][C]0.401041635682198[/C][/ROW]
[ROW][C]S.D.[/C][C]0.797409371380172[/C][/ROW]
[ROW][C]T-STAT[/C][C]0.502930677862573[/C][/ROW]
[ROW][C]p-value[/C][C]0.649613957163855[/C][/ROW]
[/TABLE]
Source: https://freestatistics.org/blog/index.php?pk=3787&T=2

Globally Unique Identifier (entire table): ba.freestatistics.org/blog/index.php?pk=3787&T=2

As an alternative you can also use a QR Code:  

The GUIDs for individual cells are displayed in the table below:

Regression: S.E.(k) = alpha + beta * Mean(k)
alpha-6019.32933584844
beta0.401041635682198
S.D.0.797409371380172
T-STAT0.502930677862573
p-value0.649613957163855


Regression: ln S.E.(k) = alpha + beta * ln Mean(k)
alpha-13.0846868787523
beta2.10293068135547
S.D.3.16578058349302
T-STAT0.664269246049631
p-value0.554012450878731
Lambda-1.10293068135547

\begin{tabular}{lllllllll}
\hline
Regression: ln S.E.(k) = alpha + beta * ln Mean(k) \tabularnewline
alpha & -13.0846868787523 \tabularnewline
beta & 2.10293068135547 \tabularnewline
S.D. & 3.16578058349302 \tabularnewline
T-STAT & 0.664269246049631 \tabularnewline
p-value & 0.554012450878731 \tabularnewline
Lambda & -1.10293068135547 \tabularnewline
\hline
\end{tabular}
%Source: https://freestatistics.org/blog/index.php?pk=3787&T=3

[TABLE]
[ROW][C]Regression: ln S.E.(k) = alpha + beta * ln Mean(k)[/C][/ROW]
[ROW][C]alpha[/C][C]-13.0846868787523[/C][/ROW]
[ROW][C]beta[/C][C]2.10293068135547[/C][/ROW]
[ROW][C]S.D.[/C][C]3.16578058349302[/C][/ROW]
[ROW][C]T-STAT[/C][C]0.664269246049631[/C][/ROW]
[ROW][C]p-value[/C][C]0.554012450878731[/C][/ROW]
[ROW][C]Lambda[/C][C]-1.10293068135547[/C][/ROW]
[/TABLE]
Source: https://freestatistics.org/blog/index.php?pk=3787&T=3

Globally Unique Identifier (entire table): ba.freestatistics.org/blog/index.php?pk=3787&T=3

As an alternative you can also use a QR Code:  

The GUIDs for individual cells are displayed in the table below:

Regression: ln S.E.(k) = alpha + beta * ln Mean(k)
alpha-13.0846868787523
beta2.10293068135547
S.D.3.16578058349302
T-STAT0.664269246049631
p-value0.554012450878731
Lambda-1.10293068135547


Parameters (Session):
par1 = 12 ;
Parameters (R input):
par1 = 12 ;
R code (references can be found in the software module):
par1 <- as.numeric(par1)
(n <- length(x))
(np <- floor(n / par1))
arr <- array(NA,dim=c(par1,np))
j <- 0
k <- 1
for (i in 1:(np*par1))
{
j = j + 1
arr[j,k] <- x[i]
if (j == par1) {
j = 0
k=k+1
}
}
arr
arr.mean <- array(NA,dim=np)
arr.sd <- array(NA,dim=np)
arr.range <- array(NA,dim=np)
for (j in 1:np)
{
arr.mean[j] <- mean(arr[,j],na.rm=TRUE)
arr.sd[j] <- sd(arr[,j],na.rm=TRUE)
arr.range[j] <- max(arr[,j],na.rm=TRUE) - min(arr[j,],na.rm=TRUE)
}
arr.mean
arr.sd
arr.range
(lm1 <- lm(arr.sd~arr.mean))
(lnlm1 <- lm(log(arr.sd)~log(arr.mean)))
(lm2 <- lm(arr.range~arr.mean))
bitmap(file='test1.png')
plot(arr.mean,arr.sd,main='Standard Deviation-Mean Plot',xlab='mean',ylab='standard deviation')
dev.off()
bitmap(file='test2.png')
plot(arr.mean,arr.range,main='Range-Mean Plot',xlab='mean',ylab='range')
dev.off()
load(file='createtable')
a<-table.start()
a<-table.row.start(a)
a<-table.element(a,'Standard Deviation-Mean Plot',4,TRUE)
a<-table.row.end(a)
a<-table.row.start(a)
a<-table.element(a,'Section',header=TRUE)
a<-table.element(a,'Mean',header=TRUE)
a<-table.element(a,'Standard Deviation',header=TRUE)
a<-table.element(a,'Range',header=TRUE)
a<-table.row.end(a)
for (j in 1:np) {
a<-table.row.start(a)
a<-table.element(a,j,header=TRUE)
a<-table.element(a,arr.mean[j])
a<-table.element(a,arr.sd[j] )
a<-table.element(a,arr.range[j] )
a<-table.row.end(a)
}
a<-table.end(a)
table.save(a,file='mytable.tab')
a<-table.start()
a<-table.row.start(a)
a<-table.element(a,'Regression: S.E.(k) = alpha + beta * Mean(k)',2,TRUE)
a<-table.row.end(a)
a<-table.row.start(a)
a<-table.element(a,'alpha',header=TRUE)
a<-table.element(a,lm1$coefficients[[1]])
a<-table.row.end(a)
a<-table.row.start(a)
a<-table.element(a,'beta',header=TRUE)
a<-table.element(a,lm1$coefficients[[2]])
a<-table.row.end(a)
a<-table.row.start(a)
a<-table.element(a,'S.D.',header=TRUE)
a<-table.element(a,summary(lm1)$coefficients[2,2])
a<-table.row.end(a)
a<-table.row.start(a)
a<-table.element(a,'T-STAT',header=TRUE)
a<-table.element(a,summary(lm1)$coefficients[2,3])
a<-table.row.end(a)
a<-table.row.start(a)
a<-table.element(a,'p-value',header=TRUE)
a<-table.element(a,summary(lm1)$coefficients[2,4])
a<-table.row.end(a)
a<-table.end(a)
table.save(a,file='mytable1.tab')
a<-table.start()
a<-table.row.start(a)
a<-table.element(a,'Regression: ln S.E.(k) = alpha + beta * ln Mean(k)',2,TRUE)
a<-table.row.end(a)
a<-table.row.start(a)
a<-table.element(a,'alpha',header=TRUE)
a<-table.element(a,lnlm1$coefficients[[1]])
a<-table.row.end(a)
a<-table.row.start(a)
a<-table.element(a,'beta',header=TRUE)
a<-table.element(a,lnlm1$coefficients[[2]])
a<-table.row.end(a)
a<-table.row.start(a)
a<-table.element(a,'S.D.',header=TRUE)
a<-table.element(a,summary(lnlm1)$coefficients[2,2])
a<-table.row.end(a)
a<-table.row.start(a)
a<-table.element(a,'T-STAT',header=TRUE)
a<-table.element(a,summary(lnlm1)$coefficients[2,3])
a<-table.row.end(a)
a<-table.row.start(a)
a<-table.element(a,'p-value',header=TRUE)
a<-table.element(a,summary(lnlm1)$coefficients[2,4])
a<-table.row.end(a)
a<-table.row.start(a)
a<-table.element(a,'Lambda',header=TRUE)
a<-table.element(a,1-lnlm1$coefficients[[2]])
a<-table.row.end(a)
a<-table.end(a)
table.save(a,file='mytable2.tab')