Free Statistics

of Irreproducible Research!

Author's title

Author*Unverified author*
R Software Modulerwasp_multipleregression.wasp
Title produced by softwareMultiple Regression
Date of computationThu, 13 Dec 2007 13:05:34 -0700
Cite this page as followsStatistical Computations at FreeStatistics.org, Office for Research Development and Education, URL https://freestatistics.org/blog/index.php?v=date/2007/Dec/13/t1197575459fv8382v7h6qbzo6.htm/, Retrieved Sun, 05 May 2024 12:37:07 +0000
Statistical Computations at FreeStatistics.org, Office for Research Development and Education, URL https://freestatistics.org/blog/index.php?pk=3704, Retrieved Sun, 05 May 2024 12:37:07 +0000
QR Codes:

Original text written by user:
IsPrivate?No (this computation is public)
User-defined keywordszonder iets
Estimated Impact181
Family? (F = Feedback message, R = changed R code, M = changed R Module, P = changed Parameters, D = changed Data)
-       [Multiple Regression] [paper] [2007-12-13 20:05:34] [8ce1ad2ac57e06e10fb37a1292ae8cb6] [Current]
Feedback Forum

Post a new message
Dataseries X:
103,1	98,6	98,1	98,6
100,6	98	101,1	98
103,1	106,8	111,1	106,8
95,5	96,6	93,3	96,7
90,5	100,1	100	100,2
90,9	107,7	108	107,7
88,8	91,5	70,4	92
90,7	97,8	75,4	98,4
94,3	107,4	105,5	107,4
104,6	117,5	112,3	117,7
111,1	105,6	102,5	105,7
110,8	97,4	93,5	97,5
107,2	99,5	86,7	99,9
99	98	95,2	98,2
99	104,3	103,8	104,5
91	100,6	97	100,8
96,2	101,1	95,5	101,5
96,9	103,9	101	103,9
96,2	96,9	67,5	99,6
100,1	95,5	64	98,4
99	108,4	106,7	112,7
115,4	117	100,6	118,4
106,9	103,8	101,2	108,1
107,1	100,8	93,1	105,4
99,3	110,6	84,2	114,6
99,2	104	85,8	106,9
108,3	112,6	91,8	115,9
105,6	107,3	92,4	109,8
99,5	98,9	80,3	101,8
107,4	109,8	79,7	114,2
93,1	104,9	62,5	110,8
88,1	102,2	57,1	108,4
110,7	123,9	100,8	127,5
113,1	124,9	100,7	128,6
99,6	112,7	86,2	116,6
93,6	121,9	83,2	127,4
98,6	100,6	71,7	105
99,6	104,3	77,5	108,3
114,3	120,4	89,8	125
107,8	107,5	80,3	111,6
101,2	102,9	78,7	106,5
112,5	125,6	93,8	130,3
100,5	107,5	57,6	115
93,9	108,8	60,6	116,1
116,2	128,4	91	134
112	121,1	85,3	126,5
106,4	119,5	77,4	125,8
95,7	128,7	77,3	136,4
96	108,7	68,3	114,9
95,8	105,5	69,9	110,9
103	119,8	81,7	125,5
102,2	111,3	75,1	116,8
98,4	110,6	69,9	116,8
111,4	120,1	84	125,5
86,6	97,5	54,3	104,2
91,3	107,7	60	115,1
107,9	127,3	89,9	132,8
101,8	117,2	77	123,3
104,4	119,8	85,3	124,8
93,4	116,2	77,6	122
100,1	111	69,2	117,4
98,5	112,4	75,5	117,9
112,9	130,6	85,7	137,4
101,4	109,1	72,2	114,6
107,1	118,8	79,9	124,7
110,8	123,9	85,3	129,6
90,3	101,6	52,2	109,4
95,5	112,8	61,2	120,9
111,4	128	82,4	134,9
113	129,6	85,4	136,3
107,5	125,8	78,2	133,2
95,9	119,5	70,2	127,2
106,3	115,7	70,2	122,7
105,2	113,6	69,3	120,5
117,2	129,7	77,5	137,8
106,9	112	66,1	119,1
108,2	116,8	69	124,3
110	126,3	75,3	134,3
96,1	112,9	58,2	121,7
100,6	115,9	59,7	125


Summary of compuational transaction
Raw Inputview raw input (R code)
Raw Outputview raw output of R engine
Computing time3 seconds
R Server'Gwilym Jenkins' @ 72.249.127.135

\begin{tabular}{lllllllll}
\hline
Summary of compuational transaction \tabularnewline
Raw Input & view raw input (R code)  \tabularnewline
Raw Output & view raw output of R engine  \tabularnewline
Computing time & 3 seconds \tabularnewline
R Server & 'Gwilym Jenkins' @ 72.249.127.135 \tabularnewline
\hline
\end{tabular}
%Source: https://freestatistics.org/blog/index.php?pk=3704&T=0

[TABLE]
[ROW][C]Summary of compuational transaction[/C][/ROW]
[ROW][C]Raw Input[/C][C]view raw input (R code) [/C][/ROW]
[ROW][C]Raw Output[/C][C]view raw output of R engine [/C][/ROW]
[ROW][C]Computing time[/C][C]3 seconds[/C][/ROW]
[ROW][C]R Server[/C][C]'Gwilym Jenkins' @ 72.249.127.135[/C][/ROW]
[/TABLE]
Source: https://freestatistics.org/blog/index.php?pk=3704&T=0

Globally Unique Identifier (entire table): ba.freestatistics.org/blog/index.php?pk=3704&T=0

As an alternative you can also use a QR Code:  

The GUIDs for individual cells are displayed in the table below:

Summary of compuational transaction
Raw Inputview raw input (R code)
Raw Outputview raw output of R engine
Computing time3 seconds
R Server'Gwilym Jenkins' @ 72.249.127.135


Multiple Linear Regression - Estimated Regression Equation
Totaal[t] = + 0.985561382674693 + 0.00512745466226638Intermediaire[t] + 0.0791606277930283Duurzame[t] + 0.90284901497009`Niet-Duurzaam`[t] + 0.432723397663192M1[t] + 0.516710710020281M2[t] + 0.490458302459475M3[t] + 0.669615430179371M4[t] + 0.61141179663758M5[t] + 0.753034886197928M6[t] + 0.209506335240211M7[t] + 0.237812110676649M8[t] + 0.227756213647851M9[t] + 0.872187181607412M10[t] + 0.158817514259807M11[t] -0.0396749980712203t + e[t]

\begin{tabular}{lllllllll}
\hline
Multiple Linear Regression - Estimated Regression Equation \tabularnewline
Totaal[t] =  +  0.985561382674693 +  0.00512745466226638Intermediaire[t] +  0.0791606277930283Duurzame[t] +  0.90284901497009`Niet-Duurzaam`[t] +  0.432723397663192M1[t] +  0.516710710020281M2[t] +  0.490458302459475M3[t] +  0.669615430179371M4[t] +  0.61141179663758M5[t] +  0.753034886197928M6[t] +  0.209506335240211M7[t] +  0.237812110676649M8[t] +  0.227756213647851M9[t] +  0.872187181607412M10[t] +  0.158817514259807M11[t] -0.0396749980712203t  + e[t] \tabularnewline
\hline
\end{tabular}
%Source: https://freestatistics.org/blog/index.php?pk=3704&T=1

[TABLE]
[ROW][C]Multiple Linear Regression - Estimated Regression Equation[/C][/ROW]
[ROW][C]Totaal[t] =  +  0.985561382674693 +  0.00512745466226638Intermediaire[t] +  0.0791606277930283Duurzame[t] +  0.90284901497009`Niet-Duurzaam`[t] +  0.432723397663192M1[t] +  0.516710710020281M2[t] +  0.490458302459475M3[t] +  0.669615430179371M4[t] +  0.61141179663758M5[t] +  0.753034886197928M6[t] +  0.209506335240211M7[t] +  0.237812110676649M8[t] +  0.227756213647851M9[t] +  0.872187181607412M10[t] +  0.158817514259807M11[t] -0.0396749980712203t  + e[t][/C][/ROW]
[/TABLE]
Source: https://freestatistics.org/blog/index.php?pk=3704&T=1

Globally Unique Identifier (entire table): ba.freestatistics.org/blog/index.php?pk=3704&T=1

As an alternative you can also use a QR Code:  

The GUIDs for individual cells are displayed in the table below:

Multiple Linear Regression - Estimated Regression Equation
Totaal[t] = + 0.985561382674693 + 0.00512745466226638Intermediaire[t] + 0.0791606277930283Duurzame[t] + 0.90284901497009`Niet-Duurzaam`[t] + 0.432723397663192M1[t] + 0.516710710020281M2[t] + 0.490458302459475M3[t] + 0.669615430179371M4[t] + 0.61141179663758M5[t] + 0.753034886197928M6[t] + 0.209506335240211M7[t] + 0.237812110676649M8[t] + 0.227756213647851M9[t] + 0.872187181607412M10[t] + 0.158817514259807M11[t] -0.0396749980712203t + e[t]


Multiple Linear Regression - Ordinary Least Squares
VariableParameterS.D.T-STATH0: parameter = 02-tail p-value1-tail p-value
(Intercept)0.9855613826746932.7727670.35540.7234260.361713
Intermediaire0.005127454662266380.0172060.2980.7666640.383332
Duurzame0.07916062779302830.0180074.3964.2e-052.1e-05
`Niet-Duurzaam`0.902849014970090.01941846.495900
M10.4327233976631920.4682450.92410.3588850.179443
M20.5167107100202810.4681981.10360.2738920.136946
M30.4904583024594750.4772181.02770.3079380.153969
M40.6696154301793710.4675551.43220.1569630.078481
M50.611411796637580.4608171.32680.189290.094645
M60.7530348861979280.4600181.6370.1065450.053273
M70.2095063352402110.6122220.34220.7333170.366658
M80.2378121106766490.5655330.42050.6755210.337761
M90.2277562136478510.5184480.43930.6619210.330961
M100.8721871816074120.5174431.68560.0967480.048374
M110.1588175142598070.4716450.33670.7374210.368711
t-0.03967499807122030.011194-3.54440.0007410.000371

\begin{tabular}{lllllllll}
\hline
Multiple Linear Regression - Ordinary Least Squares \tabularnewline
Variable & Parameter & S.D. & T-STATH0: parameter = 0 & 2-tail p-value & 1-tail p-value \tabularnewline
(Intercept) & 0.985561382674693 & 2.772767 & 0.3554 & 0.723426 & 0.361713 \tabularnewline
Intermediaire & 0.00512745466226638 & 0.017206 & 0.298 & 0.766664 & 0.383332 \tabularnewline
Duurzame & 0.0791606277930283 & 0.018007 & 4.396 & 4.2e-05 & 2.1e-05 \tabularnewline
`Niet-Duurzaam` & 0.90284901497009 & 0.019418 & 46.4959 & 0 & 0 \tabularnewline
M1 & 0.432723397663192 & 0.468245 & 0.9241 & 0.358885 & 0.179443 \tabularnewline
M2 & 0.516710710020281 & 0.468198 & 1.1036 & 0.273892 & 0.136946 \tabularnewline
M3 & 0.490458302459475 & 0.477218 & 1.0277 & 0.307938 & 0.153969 \tabularnewline
M4 & 0.669615430179371 & 0.467555 & 1.4322 & 0.156963 & 0.078481 \tabularnewline
M5 & 0.61141179663758 & 0.460817 & 1.3268 & 0.18929 & 0.094645 \tabularnewline
M6 & 0.753034886197928 & 0.460018 & 1.637 & 0.106545 & 0.053273 \tabularnewline
M7 & 0.209506335240211 & 0.612222 & 0.3422 & 0.733317 & 0.366658 \tabularnewline
M8 & 0.237812110676649 & 0.565533 & 0.4205 & 0.675521 & 0.337761 \tabularnewline
M9 & 0.227756213647851 & 0.518448 & 0.4393 & 0.661921 & 0.330961 \tabularnewline
M10 & 0.872187181607412 & 0.517443 & 1.6856 & 0.096748 & 0.048374 \tabularnewline
M11 & 0.158817514259807 & 0.471645 & 0.3367 & 0.737421 & 0.368711 \tabularnewline
t & -0.0396749980712203 & 0.011194 & -3.5444 & 0.000741 & 0.000371 \tabularnewline
\hline
\end{tabular}
%Source: https://freestatistics.org/blog/index.php?pk=3704&T=2

[TABLE]
[ROW][C]Multiple Linear Regression - Ordinary Least Squares[/C][/ROW]
[ROW][C]Variable[/C][C]Parameter[/C][C]S.D.[/C][C]T-STATH0: parameter = 0[/C][C]2-tail p-value[/C][C]1-tail p-value[/C][/ROW]
[ROW][C](Intercept)[/C][C]0.985561382674693[/C][C]2.772767[/C][C]0.3554[/C][C]0.723426[/C][C]0.361713[/C][/ROW]
[ROW][C]Intermediaire[/C][C]0.00512745466226638[/C][C]0.017206[/C][C]0.298[/C][C]0.766664[/C][C]0.383332[/C][/ROW]
[ROW][C]Duurzame[/C][C]0.0791606277930283[/C][C]0.018007[/C][C]4.396[/C][C]4.2e-05[/C][C]2.1e-05[/C][/ROW]
[ROW][C]`Niet-Duurzaam`[/C][C]0.90284901497009[/C][C]0.019418[/C][C]46.4959[/C][C]0[/C][C]0[/C][/ROW]
[ROW][C]M1[/C][C]0.432723397663192[/C][C]0.468245[/C][C]0.9241[/C][C]0.358885[/C][C]0.179443[/C][/ROW]
[ROW][C]M2[/C][C]0.516710710020281[/C][C]0.468198[/C][C]1.1036[/C][C]0.273892[/C][C]0.136946[/C][/ROW]
[ROW][C]M3[/C][C]0.490458302459475[/C][C]0.477218[/C][C]1.0277[/C][C]0.307938[/C][C]0.153969[/C][/ROW]
[ROW][C]M4[/C][C]0.669615430179371[/C][C]0.467555[/C][C]1.4322[/C][C]0.156963[/C][C]0.078481[/C][/ROW]
[ROW][C]M5[/C][C]0.61141179663758[/C][C]0.460817[/C][C]1.3268[/C][C]0.18929[/C][C]0.094645[/C][/ROW]
[ROW][C]M6[/C][C]0.753034886197928[/C][C]0.460018[/C][C]1.637[/C][C]0.106545[/C][C]0.053273[/C][/ROW]
[ROW][C]M7[/C][C]0.209506335240211[/C][C]0.612222[/C][C]0.3422[/C][C]0.733317[/C][C]0.366658[/C][/ROW]
[ROW][C]M8[/C][C]0.237812110676649[/C][C]0.565533[/C][C]0.4205[/C][C]0.675521[/C][C]0.337761[/C][/ROW]
[ROW][C]M9[/C][C]0.227756213647851[/C][C]0.518448[/C][C]0.4393[/C][C]0.661921[/C][C]0.330961[/C][/ROW]
[ROW][C]M10[/C][C]0.872187181607412[/C][C]0.517443[/C][C]1.6856[/C][C]0.096748[/C][C]0.048374[/C][/ROW]
[ROW][C]M11[/C][C]0.158817514259807[/C][C]0.471645[/C][C]0.3367[/C][C]0.737421[/C][C]0.368711[/C][/ROW]
[ROW][C]t[/C][C]-0.0396749980712203[/C][C]0.011194[/C][C]-3.5444[/C][C]0.000741[/C][C]0.000371[/C][/ROW]
[/TABLE]
Source: https://freestatistics.org/blog/index.php?pk=3704&T=2

Globally Unique Identifier (entire table): ba.freestatistics.org/blog/index.php?pk=3704&T=2

As an alternative you can also use a QR Code:  

The GUIDs for individual cells are displayed in the table below:

Multiple Linear Regression - Ordinary Least Squares
VariableParameterS.D.T-STATH0: parameter = 02-tail p-value1-tail p-value
(Intercept)0.9855613826746932.7727670.35540.7234260.361713
Intermediaire0.005127454662266380.0172060.2980.7666640.383332
Duurzame0.07916062779302830.0180074.3964.2e-052.1e-05
`Niet-Duurzaam`0.902849014970090.01941846.495900
M10.4327233976631920.4682450.92410.3588850.179443
M20.5167107100202810.4681981.10360.2738920.136946
M30.4904583024594750.4772181.02770.3079380.153969
M40.6696154301793710.4675551.43220.1569630.078481
M50.611411796637580.4608171.32680.189290.094645
M60.7530348861979280.4600181.6370.1065450.053273
M70.2095063352402110.6122220.34220.7333170.366658
M80.2378121106766490.5655330.42050.6755210.337761
M90.2277562136478510.5184480.43930.6619210.330961
M100.8721871816074120.5174431.68560.0967480.048374
M110.1588175142598070.4716450.33670.7374210.368711
t-0.03967499807122030.011194-3.54440.0007410.000371


Multiple Linear Regression - Regression Statistics
Multiple R0.997583351309772
R-squared0.995172542810435
Adjusted R-squared0.994041107531631
F-TEST (value)879.566477600183
F-TEST (DF numerator)15
F-TEST (DF denominator)64
p-value0
Multiple Linear Regression - Residual Statistics
Residual Standard Deviation0.776644682526761
Sum Squared Residuals38.603325625414

\begin{tabular}{lllllllll}
\hline
Multiple Linear Regression - Regression Statistics \tabularnewline
Multiple R & 0.997583351309772 \tabularnewline
R-squared & 0.995172542810435 \tabularnewline
Adjusted R-squared & 0.994041107531631 \tabularnewline
F-TEST (value) & 879.566477600183 \tabularnewline
F-TEST (DF numerator) & 15 \tabularnewline
F-TEST (DF denominator) & 64 \tabularnewline
p-value & 0 \tabularnewline
Multiple Linear Regression - Residual Statistics \tabularnewline
Residual Standard Deviation & 0.776644682526761 \tabularnewline
Sum Squared Residuals & 38.603325625414 \tabularnewline
\hline
\end{tabular}
%Source: https://freestatistics.org/blog/index.php?pk=3704&T=3

[TABLE]
[ROW][C]Multiple Linear Regression - Regression Statistics[/C][/ROW]
[ROW][C]Multiple R[/C][C]0.997583351309772[/C][/ROW]
[ROW][C]R-squared[/C][C]0.995172542810435[/C][/ROW]
[ROW][C]Adjusted R-squared[/C][C]0.994041107531631[/C][/ROW]
[ROW][C]F-TEST (value)[/C][C]879.566477600183[/C][/ROW]
[ROW][C]F-TEST (DF numerator)[/C][C]15[/C][/ROW]
[ROW][C]F-TEST (DF denominator)[/C][C]64[/C][/ROW]
[ROW][C]p-value[/C][C]0[/C][/ROW]
[ROW][C]Multiple Linear Regression - Residual Statistics[/C][/ROW]
[ROW][C]Residual Standard Deviation[/C][C]0.776644682526761[/C][/ROW]
[ROW][C]Sum Squared Residuals[/C][C]38.603325625414[/C][/ROW]
[/TABLE]
Source: https://freestatistics.org/blog/index.php?pk=3704&T=3

Globally Unique Identifier (entire table): ba.freestatistics.org/blog/index.php?pk=3704&T=3

As an alternative you can also use a QR Code:  

The GUIDs for individual cells are displayed in the table below:

Multiple Linear Regression - Regression Statistics
Multiple R0.997583351309772
R-squared0.995172542810435
Adjusted R-squared0.994041107531631
F-TEST (value)879.566477600183
F-TEST (DF numerator)15
F-TEST (DF denominator)64
p-value0
Multiple Linear Regression - Residual Statistics
Residual Standard Deviation0.776644682526761
Sum Squared Residuals38.603325625414


Multiple Linear Regression - Actuals, Interpolation, and Residuals
Time or IndexActualsInterpolationForecastResidualsPrediction Error
198.698.693820820494-0.0938208204939932
29898.4210869725206-0.421086972520612
3106.8107.104655813211-0.304655813211284
496.696.677335061513-0.0773350615129729
5100.1100.244166915197-0.144166915197194
6107.7107.752818623171-0.0528186231711168
791.590.00767827930311.49232172069685
897.896.18008805530041.61991194469960
9107.4106.6571920282850.742807971714512
10117.5117.1523979043800.347602095620312
11105.6104.8227193622530.777280637747145
1297.496.50688104063120.893118959368851
1399.598.51001597037460.989984029625405
149897.65030516722150.349694832778541
15104.3103.9531079549210.346892045078962
16100.6100.1727368228900.427263177110341
17101.1100.614774324310.485225675690042
18103.9103.3225327228530.577467277147464
1996.996.20160816012220.69839183987783
2095.594.84975499543050.650245004569463
21108.4111.085283621037-2.6852836210366
22117116.4374894031780.56251059682184
23103.8106.389012895614-2.58901289561396
24100.8103.112652448673-2.31265244867262
25110.6111.067388052266-0.46738805226578
26104104.285907210285-0.285907210284583
27112.6112.867244543568-0.267244543568163
28107.3107.532999930987-0.232999930986981
2998.999.2232081098778-0.323208109877778
30109.8110.513494502152-0.713494502152117
31104.9105.425718902514-0.525718902514363
32102.2102.794407380558-0.59440738055769
33123.9123.5642925813090.335707418691071
34124.9125.166572296075-0.266572296074500
35112.7112.3622897100750.337710289924902
36121.9121.6463199480680.253680051931641
37100.6100.930840466022-0.330840466021845
38104.3104.418813625571-0.118813625570833
39120.4120.479514075329-0.0795140753288577
40107.5107.735464985040-0.235464985039839
41102.9102.8725581718400.0274418281604338
42125.6125.715578536975-0.115578536975179
43107.5108.391640876849-0.891640876849039
44108.8109.577046253289-0.777046253289476
45128.4128.2091380500310.190861949969342
46121.1121.569775519642-0.469775519641559
47119.5119.53065383807-0.0306538380700469
48128.7128.839581056756-0.139581056756431
49108.7109.110468220753-0.410468220752892
50105.5105.669015988695-0.169015988694799
51119.8119.7556972831520.0443027168478744
52111.3111.513830875397-0.213830875397224
53110.6110.984832651544-0.384832651543857
54120.1120.124388935764-0.0243889357639288
5597.597.832269846795-0.332269846794936
56107.7108.137269502667-0.437269502667028
57127.3126.5199846909430.780015309057217
58117.2117.495225446645-0.295225446645365
59119.8118.7668188964861.03318110351429
60116.2115.3744103069470.82558969305282
61111110.9837579104520.016242089547506
62112.4111.9700027598600.429997240140147
63130.6130.390904896770.209095103229893
64109.1108.8177952812790.28220471872121
65118.8118.4774550264450.322544973555076
66123.9123.4498022636200.45019773637979
67101.6101.903719011670-0.303719011669791
68112.8113.014221875572-0.21422187557207
69128127.3641090283960.635890971604458
70129.6129.4785394300810.121460569919273
71125.8125.3285052975020.471494702497667
72119.5119.0201551989240.479844801075742
73115.7115.4037085596380.296291440361599
74113.6113.3848682758480.21513172415214
75129.7129.6488754330480.0511245669515757
76112111.9498370428950.0501629571054628
77116.8116.7830048007870.0169951992132756
78126.3126.421384415465-0.121384415464915
79112.9113.037364922747-0.137364922746547
80115.9116.147211937183-0.247211937182799

\begin{tabular}{lllllllll}
\hline
Multiple Linear Regression - Actuals, Interpolation, and Residuals \tabularnewline
Time or Index & Actuals & InterpolationForecast & ResidualsPrediction Error \tabularnewline
1 & 98.6 & 98.693820820494 & -0.0938208204939932 \tabularnewline
2 & 98 & 98.4210869725206 & -0.421086972520612 \tabularnewline
3 & 106.8 & 107.104655813211 & -0.304655813211284 \tabularnewline
4 & 96.6 & 96.677335061513 & -0.0773350615129729 \tabularnewline
5 & 100.1 & 100.244166915197 & -0.144166915197194 \tabularnewline
6 & 107.7 & 107.752818623171 & -0.0528186231711168 \tabularnewline
7 & 91.5 & 90.0076782793031 & 1.49232172069685 \tabularnewline
8 & 97.8 & 96.1800880553004 & 1.61991194469960 \tabularnewline
9 & 107.4 & 106.657192028285 & 0.742807971714512 \tabularnewline
10 & 117.5 & 117.152397904380 & 0.347602095620312 \tabularnewline
11 & 105.6 & 104.822719362253 & 0.777280637747145 \tabularnewline
12 & 97.4 & 96.5068810406312 & 0.893118959368851 \tabularnewline
13 & 99.5 & 98.5100159703746 & 0.989984029625405 \tabularnewline
14 & 98 & 97.6503051672215 & 0.349694832778541 \tabularnewline
15 & 104.3 & 103.953107954921 & 0.346892045078962 \tabularnewline
16 & 100.6 & 100.172736822890 & 0.427263177110341 \tabularnewline
17 & 101.1 & 100.61477432431 & 0.485225675690042 \tabularnewline
18 & 103.9 & 103.322532722853 & 0.577467277147464 \tabularnewline
19 & 96.9 & 96.2016081601222 & 0.69839183987783 \tabularnewline
20 & 95.5 & 94.8497549954305 & 0.650245004569463 \tabularnewline
21 & 108.4 & 111.085283621037 & -2.6852836210366 \tabularnewline
22 & 117 & 116.437489403178 & 0.56251059682184 \tabularnewline
23 & 103.8 & 106.389012895614 & -2.58901289561396 \tabularnewline
24 & 100.8 & 103.112652448673 & -2.31265244867262 \tabularnewline
25 & 110.6 & 111.067388052266 & -0.46738805226578 \tabularnewline
26 & 104 & 104.285907210285 & -0.285907210284583 \tabularnewline
27 & 112.6 & 112.867244543568 & -0.267244543568163 \tabularnewline
28 & 107.3 & 107.532999930987 & -0.232999930986981 \tabularnewline
29 & 98.9 & 99.2232081098778 & -0.323208109877778 \tabularnewline
30 & 109.8 & 110.513494502152 & -0.713494502152117 \tabularnewline
31 & 104.9 & 105.425718902514 & -0.525718902514363 \tabularnewline
32 & 102.2 & 102.794407380558 & -0.59440738055769 \tabularnewline
33 & 123.9 & 123.564292581309 & 0.335707418691071 \tabularnewline
34 & 124.9 & 125.166572296075 & -0.266572296074500 \tabularnewline
35 & 112.7 & 112.362289710075 & 0.337710289924902 \tabularnewline
36 & 121.9 & 121.646319948068 & 0.253680051931641 \tabularnewline
37 & 100.6 & 100.930840466022 & -0.330840466021845 \tabularnewline
38 & 104.3 & 104.418813625571 & -0.118813625570833 \tabularnewline
39 & 120.4 & 120.479514075329 & -0.0795140753288577 \tabularnewline
40 & 107.5 & 107.735464985040 & -0.235464985039839 \tabularnewline
41 & 102.9 & 102.872558171840 & 0.0274418281604338 \tabularnewline
42 & 125.6 & 125.715578536975 & -0.115578536975179 \tabularnewline
43 & 107.5 & 108.391640876849 & -0.891640876849039 \tabularnewline
44 & 108.8 & 109.577046253289 & -0.777046253289476 \tabularnewline
45 & 128.4 & 128.209138050031 & 0.190861949969342 \tabularnewline
46 & 121.1 & 121.569775519642 & -0.469775519641559 \tabularnewline
47 & 119.5 & 119.53065383807 & -0.0306538380700469 \tabularnewline
48 & 128.7 & 128.839581056756 & -0.139581056756431 \tabularnewline
49 & 108.7 & 109.110468220753 & -0.410468220752892 \tabularnewline
50 & 105.5 & 105.669015988695 & -0.169015988694799 \tabularnewline
51 & 119.8 & 119.755697283152 & 0.0443027168478744 \tabularnewline
52 & 111.3 & 111.513830875397 & -0.213830875397224 \tabularnewline
53 & 110.6 & 110.984832651544 & -0.384832651543857 \tabularnewline
54 & 120.1 & 120.124388935764 & -0.0243889357639288 \tabularnewline
55 & 97.5 & 97.832269846795 & -0.332269846794936 \tabularnewline
56 & 107.7 & 108.137269502667 & -0.437269502667028 \tabularnewline
57 & 127.3 & 126.519984690943 & 0.780015309057217 \tabularnewline
58 & 117.2 & 117.495225446645 & -0.295225446645365 \tabularnewline
59 & 119.8 & 118.766818896486 & 1.03318110351429 \tabularnewline
60 & 116.2 & 115.374410306947 & 0.82558969305282 \tabularnewline
61 & 111 & 110.983757910452 & 0.016242089547506 \tabularnewline
62 & 112.4 & 111.970002759860 & 0.429997240140147 \tabularnewline
63 & 130.6 & 130.39090489677 & 0.209095103229893 \tabularnewline
64 & 109.1 & 108.817795281279 & 0.28220471872121 \tabularnewline
65 & 118.8 & 118.477455026445 & 0.322544973555076 \tabularnewline
66 & 123.9 & 123.449802263620 & 0.45019773637979 \tabularnewline
67 & 101.6 & 101.903719011670 & -0.303719011669791 \tabularnewline
68 & 112.8 & 113.014221875572 & -0.21422187557207 \tabularnewline
69 & 128 & 127.364109028396 & 0.635890971604458 \tabularnewline
70 & 129.6 & 129.478539430081 & 0.121460569919273 \tabularnewline
71 & 125.8 & 125.328505297502 & 0.471494702497667 \tabularnewline
72 & 119.5 & 119.020155198924 & 0.479844801075742 \tabularnewline
73 & 115.7 & 115.403708559638 & 0.296291440361599 \tabularnewline
74 & 113.6 & 113.384868275848 & 0.21513172415214 \tabularnewline
75 & 129.7 & 129.648875433048 & 0.0511245669515757 \tabularnewline
76 & 112 & 111.949837042895 & 0.0501629571054628 \tabularnewline
77 & 116.8 & 116.783004800787 & 0.0169951992132756 \tabularnewline
78 & 126.3 & 126.421384415465 & -0.121384415464915 \tabularnewline
79 & 112.9 & 113.037364922747 & -0.137364922746547 \tabularnewline
80 & 115.9 & 116.147211937183 & -0.247211937182799 \tabularnewline
\hline
\end{tabular}
%Source: https://freestatistics.org/blog/index.php?pk=3704&T=4

[TABLE]
[ROW][C]Multiple Linear Regression - Actuals, Interpolation, and Residuals[/C][/ROW]
[ROW][C]Time or Index[/C][C]Actuals[/C][C]InterpolationForecast[/C][C]ResidualsPrediction Error[/C][/ROW]
[ROW][C]1[/C][C]98.6[/C][C]98.693820820494[/C][C]-0.0938208204939932[/C][/ROW]
[ROW][C]2[/C][C]98[/C][C]98.4210869725206[/C][C]-0.421086972520612[/C][/ROW]
[ROW][C]3[/C][C]106.8[/C][C]107.104655813211[/C][C]-0.304655813211284[/C][/ROW]
[ROW][C]4[/C][C]96.6[/C][C]96.677335061513[/C][C]-0.0773350615129729[/C][/ROW]
[ROW][C]5[/C][C]100.1[/C][C]100.244166915197[/C][C]-0.144166915197194[/C][/ROW]
[ROW][C]6[/C][C]107.7[/C][C]107.752818623171[/C][C]-0.0528186231711168[/C][/ROW]
[ROW][C]7[/C][C]91.5[/C][C]90.0076782793031[/C][C]1.49232172069685[/C][/ROW]
[ROW][C]8[/C][C]97.8[/C][C]96.1800880553004[/C][C]1.61991194469960[/C][/ROW]
[ROW][C]9[/C][C]107.4[/C][C]106.657192028285[/C][C]0.742807971714512[/C][/ROW]
[ROW][C]10[/C][C]117.5[/C][C]117.152397904380[/C][C]0.347602095620312[/C][/ROW]
[ROW][C]11[/C][C]105.6[/C][C]104.822719362253[/C][C]0.777280637747145[/C][/ROW]
[ROW][C]12[/C][C]97.4[/C][C]96.5068810406312[/C][C]0.893118959368851[/C][/ROW]
[ROW][C]13[/C][C]99.5[/C][C]98.5100159703746[/C][C]0.989984029625405[/C][/ROW]
[ROW][C]14[/C][C]98[/C][C]97.6503051672215[/C][C]0.349694832778541[/C][/ROW]
[ROW][C]15[/C][C]104.3[/C][C]103.953107954921[/C][C]0.346892045078962[/C][/ROW]
[ROW][C]16[/C][C]100.6[/C][C]100.172736822890[/C][C]0.427263177110341[/C][/ROW]
[ROW][C]17[/C][C]101.1[/C][C]100.61477432431[/C][C]0.485225675690042[/C][/ROW]
[ROW][C]18[/C][C]103.9[/C][C]103.322532722853[/C][C]0.577467277147464[/C][/ROW]
[ROW][C]19[/C][C]96.9[/C][C]96.2016081601222[/C][C]0.69839183987783[/C][/ROW]
[ROW][C]20[/C][C]95.5[/C][C]94.8497549954305[/C][C]0.650245004569463[/C][/ROW]
[ROW][C]21[/C][C]108.4[/C][C]111.085283621037[/C][C]-2.6852836210366[/C][/ROW]
[ROW][C]22[/C][C]117[/C][C]116.437489403178[/C][C]0.56251059682184[/C][/ROW]
[ROW][C]23[/C][C]103.8[/C][C]106.389012895614[/C][C]-2.58901289561396[/C][/ROW]
[ROW][C]24[/C][C]100.8[/C][C]103.112652448673[/C][C]-2.31265244867262[/C][/ROW]
[ROW][C]25[/C][C]110.6[/C][C]111.067388052266[/C][C]-0.46738805226578[/C][/ROW]
[ROW][C]26[/C][C]104[/C][C]104.285907210285[/C][C]-0.285907210284583[/C][/ROW]
[ROW][C]27[/C][C]112.6[/C][C]112.867244543568[/C][C]-0.267244543568163[/C][/ROW]
[ROW][C]28[/C][C]107.3[/C][C]107.532999930987[/C][C]-0.232999930986981[/C][/ROW]
[ROW][C]29[/C][C]98.9[/C][C]99.2232081098778[/C][C]-0.323208109877778[/C][/ROW]
[ROW][C]30[/C][C]109.8[/C][C]110.513494502152[/C][C]-0.713494502152117[/C][/ROW]
[ROW][C]31[/C][C]104.9[/C][C]105.425718902514[/C][C]-0.525718902514363[/C][/ROW]
[ROW][C]32[/C][C]102.2[/C][C]102.794407380558[/C][C]-0.59440738055769[/C][/ROW]
[ROW][C]33[/C][C]123.9[/C][C]123.564292581309[/C][C]0.335707418691071[/C][/ROW]
[ROW][C]34[/C][C]124.9[/C][C]125.166572296075[/C][C]-0.266572296074500[/C][/ROW]
[ROW][C]35[/C][C]112.7[/C][C]112.362289710075[/C][C]0.337710289924902[/C][/ROW]
[ROW][C]36[/C][C]121.9[/C][C]121.646319948068[/C][C]0.253680051931641[/C][/ROW]
[ROW][C]37[/C][C]100.6[/C][C]100.930840466022[/C][C]-0.330840466021845[/C][/ROW]
[ROW][C]38[/C][C]104.3[/C][C]104.418813625571[/C][C]-0.118813625570833[/C][/ROW]
[ROW][C]39[/C][C]120.4[/C][C]120.479514075329[/C][C]-0.0795140753288577[/C][/ROW]
[ROW][C]40[/C][C]107.5[/C][C]107.735464985040[/C][C]-0.235464985039839[/C][/ROW]
[ROW][C]41[/C][C]102.9[/C][C]102.872558171840[/C][C]0.0274418281604338[/C][/ROW]
[ROW][C]42[/C][C]125.6[/C][C]125.715578536975[/C][C]-0.115578536975179[/C][/ROW]
[ROW][C]43[/C][C]107.5[/C][C]108.391640876849[/C][C]-0.891640876849039[/C][/ROW]
[ROW][C]44[/C][C]108.8[/C][C]109.577046253289[/C][C]-0.777046253289476[/C][/ROW]
[ROW][C]45[/C][C]128.4[/C][C]128.209138050031[/C][C]0.190861949969342[/C][/ROW]
[ROW][C]46[/C][C]121.1[/C][C]121.569775519642[/C][C]-0.469775519641559[/C][/ROW]
[ROW][C]47[/C][C]119.5[/C][C]119.53065383807[/C][C]-0.0306538380700469[/C][/ROW]
[ROW][C]48[/C][C]128.7[/C][C]128.839581056756[/C][C]-0.139581056756431[/C][/ROW]
[ROW][C]49[/C][C]108.7[/C][C]109.110468220753[/C][C]-0.410468220752892[/C][/ROW]
[ROW][C]50[/C][C]105.5[/C][C]105.669015988695[/C][C]-0.169015988694799[/C][/ROW]
[ROW][C]51[/C][C]119.8[/C][C]119.755697283152[/C][C]0.0443027168478744[/C][/ROW]
[ROW][C]52[/C][C]111.3[/C][C]111.513830875397[/C][C]-0.213830875397224[/C][/ROW]
[ROW][C]53[/C][C]110.6[/C][C]110.984832651544[/C][C]-0.384832651543857[/C][/ROW]
[ROW][C]54[/C][C]120.1[/C][C]120.124388935764[/C][C]-0.0243889357639288[/C][/ROW]
[ROW][C]55[/C][C]97.5[/C][C]97.832269846795[/C][C]-0.332269846794936[/C][/ROW]
[ROW][C]56[/C][C]107.7[/C][C]108.137269502667[/C][C]-0.437269502667028[/C][/ROW]
[ROW][C]57[/C][C]127.3[/C][C]126.519984690943[/C][C]0.780015309057217[/C][/ROW]
[ROW][C]58[/C][C]117.2[/C][C]117.495225446645[/C][C]-0.295225446645365[/C][/ROW]
[ROW][C]59[/C][C]119.8[/C][C]118.766818896486[/C][C]1.03318110351429[/C][/ROW]
[ROW][C]60[/C][C]116.2[/C][C]115.374410306947[/C][C]0.82558969305282[/C][/ROW]
[ROW][C]61[/C][C]111[/C][C]110.983757910452[/C][C]0.016242089547506[/C][/ROW]
[ROW][C]62[/C][C]112.4[/C][C]111.970002759860[/C][C]0.429997240140147[/C][/ROW]
[ROW][C]63[/C][C]130.6[/C][C]130.39090489677[/C][C]0.209095103229893[/C][/ROW]
[ROW][C]64[/C][C]109.1[/C][C]108.817795281279[/C][C]0.28220471872121[/C][/ROW]
[ROW][C]65[/C][C]118.8[/C][C]118.477455026445[/C][C]0.322544973555076[/C][/ROW]
[ROW][C]66[/C][C]123.9[/C][C]123.449802263620[/C][C]0.45019773637979[/C][/ROW]
[ROW][C]67[/C][C]101.6[/C][C]101.903719011670[/C][C]-0.303719011669791[/C][/ROW]
[ROW][C]68[/C][C]112.8[/C][C]113.014221875572[/C][C]-0.21422187557207[/C][/ROW]
[ROW][C]69[/C][C]128[/C][C]127.364109028396[/C][C]0.635890971604458[/C][/ROW]
[ROW][C]70[/C][C]129.6[/C][C]129.478539430081[/C][C]0.121460569919273[/C][/ROW]
[ROW][C]71[/C][C]125.8[/C][C]125.328505297502[/C][C]0.471494702497667[/C][/ROW]
[ROW][C]72[/C][C]119.5[/C][C]119.020155198924[/C][C]0.479844801075742[/C][/ROW]
[ROW][C]73[/C][C]115.7[/C][C]115.403708559638[/C][C]0.296291440361599[/C][/ROW]
[ROW][C]74[/C][C]113.6[/C][C]113.384868275848[/C][C]0.21513172415214[/C][/ROW]
[ROW][C]75[/C][C]129.7[/C][C]129.648875433048[/C][C]0.0511245669515757[/C][/ROW]
[ROW][C]76[/C][C]112[/C][C]111.949837042895[/C][C]0.0501629571054628[/C][/ROW]
[ROW][C]77[/C][C]116.8[/C][C]116.783004800787[/C][C]0.0169951992132756[/C][/ROW]
[ROW][C]78[/C][C]126.3[/C][C]126.421384415465[/C][C]-0.121384415464915[/C][/ROW]
[ROW][C]79[/C][C]112.9[/C][C]113.037364922747[/C][C]-0.137364922746547[/C][/ROW]
[ROW][C]80[/C][C]115.9[/C][C]116.147211937183[/C][C]-0.247211937182799[/C][/ROW]
[/TABLE]
Source: https://freestatistics.org/blog/index.php?pk=3704&T=4

Globally Unique Identifier (entire table): ba.freestatistics.org/blog/index.php?pk=3704&T=4

As an alternative you can also use a QR Code:  

The GUIDs for individual cells are displayed in the table below:

Multiple Linear Regression - Actuals, Interpolation, and Residuals
Time or IndexActualsInterpolationForecastResidualsPrediction Error
198.698.693820820494-0.0938208204939932
29898.4210869725206-0.421086972520612
3106.8107.104655813211-0.304655813211284
496.696.677335061513-0.0773350615129729
5100.1100.244166915197-0.144166915197194
6107.7107.752818623171-0.0528186231711168
791.590.00767827930311.49232172069685
897.896.18008805530041.61991194469960
9107.4106.6571920282850.742807971714512
10117.5117.1523979043800.347602095620312
11105.6104.8227193622530.777280637747145
1297.496.50688104063120.893118959368851
1399.598.51001597037460.989984029625405
149897.65030516722150.349694832778541
15104.3103.9531079549210.346892045078962
16100.6100.1727368228900.427263177110341
17101.1100.614774324310.485225675690042
18103.9103.3225327228530.577467277147464
1996.996.20160816012220.69839183987783
2095.594.84975499543050.650245004569463
21108.4111.085283621037-2.6852836210366
22117116.4374894031780.56251059682184
23103.8106.389012895614-2.58901289561396
24100.8103.112652448673-2.31265244867262
25110.6111.067388052266-0.46738805226578
26104104.285907210285-0.285907210284583
27112.6112.867244543568-0.267244543568163
28107.3107.532999930987-0.232999930986981
2998.999.2232081098778-0.323208109877778
30109.8110.513494502152-0.713494502152117
31104.9105.425718902514-0.525718902514363
32102.2102.794407380558-0.59440738055769
33123.9123.5642925813090.335707418691071
34124.9125.166572296075-0.266572296074500
35112.7112.3622897100750.337710289924902
36121.9121.6463199480680.253680051931641
37100.6100.930840466022-0.330840466021845
38104.3104.418813625571-0.118813625570833
39120.4120.479514075329-0.0795140753288577
40107.5107.735464985040-0.235464985039839
41102.9102.8725581718400.0274418281604338
42125.6125.715578536975-0.115578536975179
43107.5108.391640876849-0.891640876849039
44108.8109.577046253289-0.777046253289476
45128.4128.2091380500310.190861949969342
46121.1121.569775519642-0.469775519641559
47119.5119.53065383807-0.0306538380700469
48128.7128.839581056756-0.139581056756431
49108.7109.110468220753-0.410468220752892
50105.5105.669015988695-0.169015988694799
51119.8119.7556972831520.0443027168478744
52111.3111.513830875397-0.213830875397224
53110.6110.984832651544-0.384832651543857
54120.1120.124388935764-0.0243889357639288
5597.597.832269846795-0.332269846794936
56107.7108.137269502667-0.437269502667028
57127.3126.5199846909430.780015309057217
58117.2117.495225446645-0.295225446645365
59119.8118.7668188964861.03318110351429
60116.2115.3744103069470.82558969305282
61111110.9837579104520.016242089547506
62112.4111.9700027598600.429997240140147
63130.6130.390904896770.209095103229893
64109.1108.8177952812790.28220471872121
65118.8118.4774550264450.322544973555076
66123.9123.4498022636200.45019773637979
67101.6101.903719011670-0.303719011669791
68112.8113.014221875572-0.21422187557207
69128127.3641090283960.635890971604458
70129.6129.4785394300810.121460569919273
71125.8125.3285052975020.471494702497667
72119.5119.0201551989240.479844801075742
73115.7115.4037085596380.296291440361599
74113.6113.3848682758480.21513172415214
75129.7129.6488754330480.0511245669515757
76112111.9498370428950.0501629571054628
77116.8116.7830048007870.0169951992132756
78126.3126.421384415465-0.121384415464915
79112.9113.037364922747-0.137364922746547
80115.9116.147211937183-0.247211937182799


Parameters (Session):
par1 = 2 ; par2 = Include Monthly Dummies ; par3 = Linear Trend ;
Parameters (R input):
par1 = 2 ; par2 = Include Monthly Dummies ; par3 = Linear Trend ;
R code (references can be found in the software module):
library(lattice)
par1 <- as.numeric(par1)
x <- t(y)
k <- length(x[1,])
n <- length(x[,1])
x1 <- cbind(x[,par1], x[,1:k!=par1])
mycolnames <- c(colnames(x)[par1], colnames(x)[1:k!=par1])
colnames(x1) <- mycolnames #colnames(x)[par1]
x <- x1
if (par3 == 'First Differences'){
x2 <- array(0, dim=c(n-1,k), dimnames=list(1:(n-1), paste('(1-B)',colnames(x),sep='')))
for (i in 1:n-1) {
for (j in 1:k) {
x2[i,j] <- x[i+1,j] - x[i,j]
}
}
x <- x2
}
if (par2 == 'Include Monthly Dummies'){
x2 <- array(0, dim=c(n,11), dimnames=list(1:n, paste('M', seq(1:11), sep ='')))
for (i in 1:11){
x2[seq(i,n,12),i] <- 1
}
x <- cbind(x, x2)
}
if (par2 == 'Include Quarterly Dummies'){
x2 <- array(0, dim=c(n,3), dimnames=list(1:n, paste('Q', seq(1:3), sep ='')))
for (i in 1:3){
x2[seq(i,n,4),i] <- 1
}
x <- cbind(x, x2)
}
k <- length(x[1,])
if (par3 == 'Linear Trend'){
x <- cbind(x, c(1:n))
colnames(x)[k+1] <- 't'
}
x
k <- length(x[1,])
df <- as.data.frame(x)
(mylm <- lm(df))
(mysum <- summary(mylm))
bitmap(file='test0.png')
plot(x[,1], type='l', main='Actuals and Interpolation', ylab='value of Actuals and Interpolation (dots)', xlab='time or index')
points(x[,1]-mysum$resid)
grid()
dev.off()
bitmap(file='test1.png')
plot(mysum$resid, type='b', pch=19, main='Residuals', ylab='value of Residuals', xlab='time or index')
grid()
dev.off()
bitmap(file='test2.png')
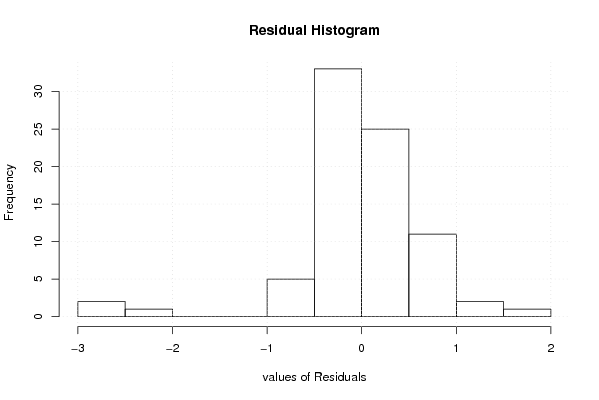
hist(mysum$resid, main='Residual Histogram', xlab='values of Residuals')
grid()
dev.off()
bitmap(file='test3.png')
densityplot(~mysum$resid,col='black',main='Residual Density Plot', xlab='values of Residuals')
dev.off()
bitmap(file='test4.png')
qqnorm(mysum$resid, main='Residual Normal Q-Q Plot')
grid()
dev.off()
(myerror <- as.ts(mysum$resid))
bitmap(file='test5.png')
dum <- cbind(lag(myerror,k=1),myerror)
dum
dum1 <- dum[2:length(myerror),]
dum1
z <- as.data.frame(dum1)
z
plot(z,main=paste('Residual Lag plot, lowess, and regression line'), ylab='values of Residuals', xlab='lagged values of Residuals')
lines(lowess(z))
abline(lm(z))
grid()
dev.off()
bitmap(file='test6.png')
acf(mysum$resid, lag.max=length(mysum$resid)/2, main='Residual Autocorrelation Function')
grid()
dev.off()
bitmap(file='test7.png')
pacf(mysum$resid, lag.max=length(mysum$resid)/2, main='Residual Partial Autocorrelation Function')
grid()
dev.off()
bitmap(file='test8.png')
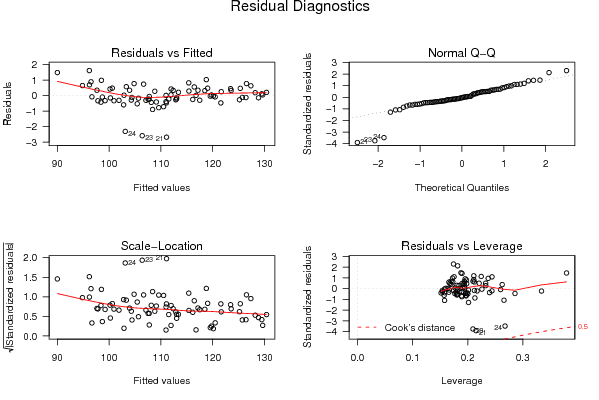
opar <- par(mfrow = c(2,2), oma = c(0, 0, 1.1, 0))
plot(mylm, las = 1, sub='Residual Diagnostics')
par(opar)
dev.off()
load(file='createtable')
a<-table.start()
a<-table.row.start(a)
a<-table.element(a, 'Multiple Linear Regression - Estimated Regression Equation', 1, TRUE)
a<-table.row.end(a)
myeq <- colnames(x)[1]
myeq <- paste(myeq, '[t] = ', sep='')
for (i in 1:k){
if (mysum$coefficients[i,1] > 0) myeq <- paste(myeq, '+', '')
myeq <- paste(myeq, mysum$coefficients[i,1], sep=' ')
if (rownames(mysum$coefficients)[i] != '(Intercept)') {
myeq <- paste(myeq, rownames(mysum$coefficients)[i], sep='')
if (rownames(mysum$coefficients)[i] != 't') myeq <- paste(myeq, '[t]', sep='')
}
}
myeq <- paste(myeq, ' + e[t]')
a<-table.row.start(a)
a<-table.element(a, myeq)
a<-table.row.end(a)
a<-table.end(a)
table.save(a,file='mytable1.tab')
a<-table.start()
a<-table.row.start(a)
a<-table.element(a,hyperlink('ols1.htm','Multiple Linear Regression - Ordinary Least Squares',''), 6, TRUE)
a<-table.row.end(a)
a<-table.row.start(a)
a<-table.element(a,'Variable',header=TRUE)
a<-table.element(a,'Parameter',header=TRUE)
a<-table.element(a,'S.D.',header=TRUE)
a<-table.element(a,'T-STAT
H0: parameter = 0',header=TRUE)
a<-table.element(a,'2-tail p-value',header=TRUE)
a<-table.element(a,'1-tail p-value',header=TRUE)
a<-table.row.end(a)
for (i in 1:k){
a<-table.row.start(a)
a<-table.element(a,rownames(mysum$coefficients)[i],header=TRUE)
a<-table.element(a,mysum$coefficients[i,1])
a<-table.element(a, round(mysum$coefficients[i,2],6))
a<-table.element(a, round(mysum$coefficients[i,3],4))
a<-table.element(a, round(mysum$coefficients[i,4],6))
a<-table.element(a, round(mysum$coefficients[i,4]/2,6))
a<-table.row.end(a)
}
a<-table.end(a)
table.save(a,file='mytable2.tab')
a<-table.start()
a<-table.row.start(a)
a<-table.element(a, 'Multiple Linear Regression - Regression Statistics', 2, TRUE)
a<-table.row.end(a)
a<-table.row.start(a)
a<-table.element(a, 'Multiple R',1,TRUE)
a<-table.element(a, sqrt(mysum$r.squared))
a<-table.row.end(a)
a<-table.row.start(a)
a<-table.element(a, 'R-squared',1,TRUE)
a<-table.element(a, mysum$r.squared)
a<-table.row.end(a)
a<-table.row.start(a)
a<-table.element(a, 'Adjusted R-squared',1,TRUE)
a<-table.element(a, mysum$adj.r.squared)
a<-table.row.end(a)
a<-table.row.start(a)
a<-table.element(a, 'F-TEST (value)',1,TRUE)
a<-table.element(a, mysum$fstatistic[1])
a<-table.row.end(a)
a<-table.row.start(a)
a<-table.element(a, 'F-TEST (DF numerator)',1,TRUE)
a<-table.element(a, mysum$fstatistic[2])
a<-table.row.end(a)
a<-table.row.start(a)
a<-table.element(a, 'F-TEST (DF denominator)',1,TRUE)
a<-table.element(a, mysum$fstatistic[3])
a<-table.row.end(a)
a<-table.row.start(a)
a<-table.element(a, 'p-value',1,TRUE)
a<-table.element(a, 1-pf(mysum$fstatistic[1],mysum$fstatistic[2],mysum$fstatistic[3]))
a<-table.row.end(a)
a<-table.row.start(a)
a<-table.element(a, 'Multiple Linear Regression - Residual Statistics', 2, TRUE)
a<-table.row.end(a)
a<-table.row.start(a)
a<-table.element(a, 'Residual Standard Deviation',1,TRUE)
a<-table.element(a, mysum$sigma)
a<-table.row.end(a)
a<-table.row.start(a)
a<-table.element(a, 'Sum Squared Residuals',1,TRUE)
a<-table.element(a, sum(myerror*myerror))
a<-table.row.end(a)
a<-table.end(a)
table.save(a,file='mytable3.tab')
a<-table.start()
a<-table.row.start(a)
a<-table.element(a, 'Multiple Linear Regression - Actuals, Interpolation, and Residuals', 4, TRUE)
a<-table.row.end(a)
a<-table.row.start(a)
a<-table.element(a, 'Time or Index', 1, TRUE)
a<-table.element(a, 'Actuals', 1, TRUE)
a<-table.element(a, 'Interpolation
Forecast', 1, TRUE)
a<-table.element(a, 'Residuals
Prediction Error', 1, TRUE)
a<-table.row.end(a)
for (i in 1:n) {
a<-table.row.start(a)
a<-table.element(a,i, 1, TRUE)
a<-table.element(a,x[i])
a<-table.element(a,x[i]-mysum$resid[i])
a<-table.element(a,mysum$resid[i])
a<-table.row.end(a)
}
a<-table.end(a)
table.save(a,file='mytable4.tab')