Free Statistics

of Irreproducible Research!

Author's title

Author*Unverified author*
R Software Modulerwasp_autocorrelation.wasp
Title produced by software(Partial) Autocorrelation Function
Date of computationThu, 13 Dec 2007 09:33:31 -0700
Cite this page as followsStatistical Computations at FreeStatistics.org, Office for Research Development and Education, URL https://freestatistics.org/blog/index.php?v=date/2007/Dec/13/t1197562865susckp0juplyiy7.htm/, Retrieved Sun, 05 May 2024 19:43:13 +0000
Statistical Computations at FreeStatistics.org, Office for Research Development and Education, URL https://freestatistics.org/blog/index.php?pk=3655, Retrieved Sun, 05 May 2024 19:43:13 +0000
QR Codes:

Original text written by user:
IsPrivate?No (this computation is public)
User-defined keywords
Estimated Impact181
Family? (F = Feedback message, R = changed R code, M = changed R Module, P = changed Parameters, D = changed Data)
-       [(Partial) Autocorrelation Function] [PAPER, TIM, GIEL,...] [2007-12-13 16:33:31] [5ac545ffb613273067e3916533dda4e8] [Current]
Feedback Forum

Post a new message
Dataseries X:
513
503
471
471
476
475
470
461
455
456
517
525
523
519
509
512
519
517
510
509
501
507
569
580
578
565
547
555
562
561
555
544
537
543
594
611
613
611
594
595
591
589
584
573
567
569
621
629
628
612
595
597
593
590
580
574
573
573
620
626
620
588
566
557
561
549
532
526
511
499
555
565
542


Summary of compuational transaction
Raw Inputview raw input (R code)
Raw Outputview raw output of R engine
Computing time1 seconds
R Server'Gwilym Jenkins' @ 72.249.127.135

\begin{tabular}{lllllllll}
\hline
Summary of compuational transaction \tabularnewline
Raw Input & view raw input (R code)  \tabularnewline
Raw Output & view raw output of R engine  \tabularnewline
Computing time & 1 seconds \tabularnewline
R Server & 'Gwilym Jenkins' @ 72.249.127.135 \tabularnewline
\hline
\end{tabular}
%Source: https://freestatistics.org/blog/index.php?pk=3655&T=0

[TABLE]
[ROW][C]Summary of compuational transaction[/C][/ROW]
[ROW][C]Raw Input[/C][C]view raw input (R code) [/C][/ROW]
[ROW][C]Raw Output[/C][C]view raw output of R engine [/C][/ROW]
[ROW][C]Computing time[/C][C]1 seconds[/C][/ROW]
[ROW][C]R Server[/C][C]'Gwilym Jenkins' @ 72.249.127.135[/C][/ROW]
[/TABLE]
Source: https://freestatistics.org/blog/index.php?pk=3655&T=0

Globally Unique Identifier (entire table): ba.freestatistics.org/blog/index.php?pk=3655&T=0

As an alternative you can also use a QR Code:  

The GUIDs for individual cells are displayed in the table below:

Summary of compuational transaction
Raw Inputview raw input (R code)
Raw Outputview raw output of R engine
Computing time1 seconds
R Server'Gwilym Jenkins' @ 72.249.127.135


Autocorrelation Function
Time lag kACF(k)T-STATP-value
018.48530
10.2318231.96710.026514
2-0.163654-1.38870.91539
3-0.248199-2.1060.980656
4-0.238425-2.02310.976612
50.0370470.31440.377079
60.1677161.42310.079511
70.0450140.3820.35181
8-0.319281-2.70920.995788
9-0.27859-2.36390.989608
10-0.10506-0.89150.812175
110.2033221.72520.044387
120.716756.08180
130.1835781.55770.061844
14-0.12772-1.08370.858951
15-0.250593-2.12640.981549
16-0.215187-1.82590.963996
170.027690.2350.407455
180.1153620.97890.165458
190.0329680.27970.390239
20-0.266399-2.26050.986592
21-0.226498-1.92190.970712
22-0.071974-0.61070.728345
230.1638971.39070.084298
240.5672154.8134e-06
250.1419961.20490.116098
26-0.138785-1.17760.878589
27-0.209975-1.78170.960492
28-0.166367-1.41170.918823
290.0209330.17760.429758
300.0697220.59160.277981
310.0123090.10440.458554
32-0.215953-1.83240.964488
33-0.172925-1.46730.926677
34-0.064995-0.55150.7085
350.0948160.80450.211867
360.4376643.71372e-04
370.104420.8860.189274
38-0.11119-0.94350.825704
39-0.183249-1.55490.937825
40-0.118015-1.00140.840004
410.0147960.12550.450219
420.0794730.67440.251124
430.0224740.19070.424651
44-0.181401-1.53920.935936
45-0.124267-1.05440.852396
46-0.045688-0.38770.650299
470.057670.48930.313043

\begin{tabular}{lllllllll}
\hline
Autocorrelation Function \tabularnewline
Time lag k & ACF(k) & T-STAT & P-value \tabularnewline
0 & 1 & 8.4853 & 0 \tabularnewline
1 & 0.231823 & 1.9671 & 0.026514 \tabularnewline
2 & -0.163654 & -1.3887 & 0.91539 \tabularnewline
3 & -0.248199 & -2.106 & 0.980656 \tabularnewline
4 & -0.238425 & -2.0231 & 0.976612 \tabularnewline
5 & 0.037047 & 0.3144 & 0.377079 \tabularnewline
6 & 0.167716 & 1.4231 & 0.079511 \tabularnewline
7 & 0.045014 & 0.382 & 0.35181 \tabularnewline
8 & -0.319281 & -2.7092 & 0.995788 \tabularnewline
9 & -0.27859 & -2.3639 & 0.989608 \tabularnewline
10 & -0.10506 & -0.8915 & 0.812175 \tabularnewline
11 & 0.203322 & 1.7252 & 0.044387 \tabularnewline
12 & 0.71675 & 6.0818 & 0 \tabularnewline
13 & 0.183578 & 1.5577 & 0.061844 \tabularnewline
14 & -0.12772 & -1.0837 & 0.858951 \tabularnewline
15 & -0.250593 & -2.1264 & 0.981549 \tabularnewline
16 & -0.215187 & -1.8259 & 0.963996 \tabularnewline
17 & 0.02769 & 0.235 & 0.407455 \tabularnewline
18 & 0.115362 & 0.9789 & 0.165458 \tabularnewline
19 & 0.032968 & 0.2797 & 0.390239 \tabularnewline
20 & -0.266399 & -2.2605 & 0.986592 \tabularnewline
21 & -0.226498 & -1.9219 & 0.970712 \tabularnewline
22 & -0.071974 & -0.6107 & 0.728345 \tabularnewline
23 & 0.163897 & 1.3907 & 0.084298 \tabularnewline
24 & 0.567215 & 4.813 & 4e-06 \tabularnewline
25 & 0.141996 & 1.2049 & 0.116098 \tabularnewline
26 & -0.138785 & -1.1776 & 0.878589 \tabularnewline
27 & -0.209975 & -1.7817 & 0.960492 \tabularnewline
28 & -0.166367 & -1.4117 & 0.918823 \tabularnewline
29 & 0.020933 & 0.1776 & 0.429758 \tabularnewline
30 & 0.069722 & 0.5916 & 0.277981 \tabularnewline
31 & 0.012309 & 0.1044 & 0.458554 \tabularnewline
32 & -0.215953 & -1.8324 & 0.964488 \tabularnewline
33 & -0.172925 & -1.4673 & 0.926677 \tabularnewline
34 & -0.064995 & -0.5515 & 0.7085 \tabularnewline
35 & 0.094816 & 0.8045 & 0.211867 \tabularnewline
36 & 0.437664 & 3.7137 & 2e-04 \tabularnewline
37 & 0.10442 & 0.886 & 0.189274 \tabularnewline
38 & -0.11119 & -0.9435 & 0.825704 \tabularnewline
39 & -0.183249 & -1.5549 & 0.937825 \tabularnewline
40 & -0.118015 & -1.0014 & 0.840004 \tabularnewline
41 & 0.014796 & 0.1255 & 0.450219 \tabularnewline
42 & 0.079473 & 0.6744 & 0.251124 \tabularnewline
43 & 0.022474 & 0.1907 & 0.424651 \tabularnewline
44 & -0.181401 & -1.5392 & 0.935936 \tabularnewline
45 & -0.124267 & -1.0544 & 0.852396 \tabularnewline
46 & -0.045688 & -0.3877 & 0.650299 \tabularnewline
47 & 0.05767 & 0.4893 & 0.313043 \tabularnewline
\hline
\end{tabular}
%Source: https://freestatistics.org/blog/index.php?pk=3655&T=1

[TABLE]
[ROW][C]Autocorrelation Function[/C][/ROW]
[ROW][C]Time lag k[/C][C]ACF(k)[/C][C]T-STAT[/C][C]P-value[/C][/ROW]
[ROW][C]0[/C][C]1[/C][C]8.4853[/C][C]0[/C][/ROW]
[ROW][C]1[/C][C]0.231823[/C][C]1.9671[/C][C]0.026514[/C][/ROW]
[ROW][C]2[/C][C]-0.163654[/C][C]-1.3887[/C][C]0.91539[/C][/ROW]
[ROW][C]3[/C][C]-0.248199[/C][C]-2.106[/C][C]0.980656[/C][/ROW]
[ROW][C]4[/C][C]-0.238425[/C][C]-2.0231[/C][C]0.976612[/C][/ROW]
[ROW][C]5[/C][C]0.037047[/C][C]0.3144[/C][C]0.377079[/C][/ROW]
[ROW][C]6[/C][C]0.167716[/C][C]1.4231[/C][C]0.079511[/C][/ROW]
[ROW][C]7[/C][C]0.045014[/C][C]0.382[/C][C]0.35181[/C][/ROW]
[ROW][C]8[/C][C]-0.319281[/C][C]-2.7092[/C][C]0.995788[/C][/ROW]
[ROW][C]9[/C][C]-0.27859[/C][C]-2.3639[/C][C]0.989608[/C][/ROW]
[ROW][C]10[/C][C]-0.10506[/C][C]-0.8915[/C][C]0.812175[/C][/ROW]
[ROW][C]11[/C][C]0.203322[/C][C]1.7252[/C][C]0.044387[/C][/ROW]
[ROW][C]12[/C][C]0.71675[/C][C]6.0818[/C][C]0[/C][/ROW]
[ROW][C]13[/C][C]0.183578[/C][C]1.5577[/C][C]0.061844[/C][/ROW]
[ROW][C]14[/C][C]-0.12772[/C][C]-1.0837[/C][C]0.858951[/C][/ROW]
[ROW][C]15[/C][C]-0.250593[/C][C]-2.1264[/C][C]0.981549[/C][/ROW]
[ROW][C]16[/C][C]-0.215187[/C][C]-1.8259[/C][C]0.963996[/C][/ROW]
[ROW][C]17[/C][C]0.02769[/C][C]0.235[/C][C]0.407455[/C][/ROW]
[ROW][C]18[/C][C]0.115362[/C][C]0.9789[/C][C]0.165458[/C][/ROW]
[ROW][C]19[/C][C]0.032968[/C][C]0.2797[/C][C]0.390239[/C][/ROW]
[ROW][C]20[/C][C]-0.266399[/C][C]-2.2605[/C][C]0.986592[/C][/ROW]
[ROW][C]21[/C][C]-0.226498[/C][C]-1.9219[/C][C]0.970712[/C][/ROW]
[ROW][C]22[/C][C]-0.071974[/C][C]-0.6107[/C][C]0.728345[/C][/ROW]
[ROW][C]23[/C][C]0.163897[/C][C]1.3907[/C][C]0.084298[/C][/ROW]
[ROW][C]24[/C][C]0.567215[/C][C]4.813[/C][C]4e-06[/C][/ROW]
[ROW][C]25[/C][C]0.141996[/C][C]1.2049[/C][C]0.116098[/C][/ROW]
[ROW][C]26[/C][C]-0.138785[/C][C]-1.1776[/C][C]0.878589[/C][/ROW]
[ROW][C]27[/C][C]-0.209975[/C][C]-1.7817[/C][C]0.960492[/C][/ROW]
[ROW][C]28[/C][C]-0.166367[/C][C]-1.4117[/C][C]0.918823[/C][/ROW]
[ROW][C]29[/C][C]0.020933[/C][C]0.1776[/C][C]0.429758[/C][/ROW]
[ROW][C]30[/C][C]0.069722[/C][C]0.5916[/C][C]0.277981[/C][/ROW]
[ROW][C]31[/C][C]0.012309[/C][C]0.1044[/C][C]0.458554[/C][/ROW]
[ROW][C]32[/C][C]-0.215953[/C][C]-1.8324[/C][C]0.964488[/C][/ROW]
[ROW][C]33[/C][C]-0.172925[/C][C]-1.4673[/C][C]0.926677[/C][/ROW]
[ROW][C]34[/C][C]-0.064995[/C][C]-0.5515[/C][C]0.7085[/C][/ROW]
[ROW][C]35[/C][C]0.094816[/C][C]0.8045[/C][C]0.211867[/C][/ROW]
[ROW][C]36[/C][C]0.437664[/C][C]3.7137[/C][C]2e-04[/C][/ROW]
[ROW][C]37[/C][C]0.10442[/C][C]0.886[/C][C]0.189274[/C][/ROW]
[ROW][C]38[/C][C]-0.11119[/C][C]-0.9435[/C][C]0.825704[/C][/ROW]
[ROW][C]39[/C][C]-0.183249[/C][C]-1.5549[/C][C]0.937825[/C][/ROW]
[ROW][C]40[/C][C]-0.118015[/C][C]-1.0014[/C][C]0.840004[/C][/ROW]
[ROW][C]41[/C][C]0.014796[/C][C]0.1255[/C][C]0.450219[/C][/ROW]
[ROW][C]42[/C][C]0.079473[/C][C]0.6744[/C][C]0.251124[/C][/ROW]
[ROW][C]43[/C][C]0.022474[/C][C]0.1907[/C][C]0.424651[/C][/ROW]
[ROW][C]44[/C][C]-0.181401[/C][C]-1.5392[/C][C]0.935936[/C][/ROW]
[ROW][C]45[/C][C]-0.124267[/C][C]-1.0544[/C][C]0.852396[/C][/ROW]
[ROW][C]46[/C][C]-0.045688[/C][C]-0.3877[/C][C]0.650299[/C][/ROW]
[ROW][C]47[/C][C]0.05767[/C][C]0.4893[/C][C]0.313043[/C][/ROW]
[/TABLE]
Source: https://freestatistics.org/blog/index.php?pk=3655&T=1

Globally Unique Identifier (entire table): ba.freestatistics.org/blog/index.php?pk=3655&T=1

As an alternative you can also use a QR Code:  

The GUIDs for individual cells are displayed in the table below:

Autocorrelation Function
Time lag kACF(k)T-STATP-value
018.48530
10.2318231.96710.026514
2-0.163654-1.38870.91539
3-0.248199-2.1060.980656
4-0.238425-2.02310.976612
50.0370470.31440.377079
60.1677161.42310.079511
70.0450140.3820.35181
8-0.319281-2.70920.995788
9-0.27859-2.36390.989608
10-0.10506-0.89150.812175
110.2033221.72520.044387
120.716756.08180
130.1835781.55770.061844
14-0.12772-1.08370.858951
15-0.250593-2.12640.981549
16-0.215187-1.82590.963996
170.027690.2350.407455
180.1153620.97890.165458
190.0329680.27970.390239
20-0.266399-2.26050.986592
21-0.226498-1.92190.970712
22-0.071974-0.61070.728345
230.1638971.39070.084298
240.5672154.8134e-06
250.1419961.20490.116098
26-0.138785-1.17760.878589
27-0.209975-1.78170.960492
28-0.166367-1.41170.918823
290.0209330.17760.429758
300.0697220.59160.277981
310.0123090.10440.458554
32-0.215953-1.83240.964488
33-0.172925-1.46730.926677
34-0.064995-0.55150.7085
350.0948160.80450.211867
360.4376643.71372e-04
370.104420.8860.189274
38-0.11119-0.94350.825704
39-0.183249-1.55490.937825
40-0.118015-1.00140.840004
410.0147960.12550.450219
420.0794730.67440.251124
430.0224740.19070.424651
44-0.181401-1.53920.935936
45-0.124267-1.05440.852396
46-0.045688-0.38770.650299
470.057670.48930.313043


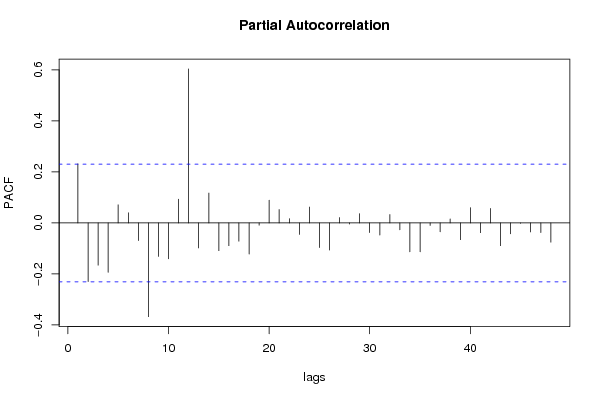
Partial Autocorrelation Function
Time lag kPACF(k)T-STATP-value
00.2318231.96710.026514
1-0.229742-1.94940.97243
2-0.165439-1.40380.91766
3-0.19343-1.64130.947453
40.0713010.6050.273539
50.0398220.33790.368211
6-0.069119-0.58650.720312
7-0.367328-3.11690.998687
8-0.131399-1.1150.865713
9-0.140488-1.19210.881429
100.0934020.79250.215325
110.6040215.12531e-06
12-0.098079-0.83220.795983
130.117320.99550.161415
14-0.108707-0.92240.820302
15-0.089263-0.75740.774367
16-0.071292-0.60490.726436
17-0.121729-1.03290.847447
18-0.008751-0.07430.529492
190.0895640.760.224876
200.0526090.44640.328322
210.0169940.14420.442874
22-0.045094-0.38260.64844
230.0624860.53020.2988
24-0.096261-0.81680.791631
25-0.106255-0.90160.814863
260.02150.18240.427878
27-0.004347-0.03690.514662
280.0363090.30810.379452
29-0.037797-0.32070.625322
30-0.047495-0.4030.655931
310.0328420.27870.390648
32-0.027019-0.22930.590343
33-0.113216-0.96070.830033
34-0.113183-0.96040.829963
35-0.009417-0.07990.531734
36-0.034776-0.29510.615611
370.0156370.13270.447406
38-0.065528-0.5560.710041
390.0598740.5080.306488
40-0.038199-0.32410.62661
410.0568920.48270.315372
42-0.08881-0.75360.773219
43-0.042498-0.36060.640277
44-0.001177-0.010.503969
45-0.034959-0.29660.616202
46-0.037762-0.32040.62521
47-0.075205-0.63810.737294

\begin{tabular}{lllllllll}
\hline
Partial Autocorrelation Function \tabularnewline
Time lag k & PACF(k) & T-STAT & P-value \tabularnewline
0 & 0.231823 & 1.9671 & 0.026514 \tabularnewline
1 & -0.229742 & -1.9494 & 0.97243 \tabularnewline
2 & -0.165439 & -1.4038 & 0.91766 \tabularnewline
3 & -0.19343 & -1.6413 & 0.947453 \tabularnewline
4 & 0.071301 & 0.605 & 0.273539 \tabularnewline
5 & 0.039822 & 0.3379 & 0.368211 \tabularnewline
6 & -0.069119 & -0.5865 & 0.720312 \tabularnewline
7 & -0.367328 & -3.1169 & 0.998687 \tabularnewline
8 & -0.131399 & -1.115 & 0.865713 \tabularnewline
9 & -0.140488 & -1.1921 & 0.881429 \tabularnewline
10 & 0.093402 & 0.7925 & 0.215325 \tabularnewline
11 & 0.604021 & 5.1253 & 1e-06 \tabularnewline
12 & -0.098079 & -0.8322 & 0.795983 \tabularnewline
13 & 0.11732 & 0.9955 & 0.161415 \tabularnewline
14 & -0.108707 & -0.9224 & 0.820302 \tabularnewline
15 & -0.089263 & -0.7574 & 0.774367 \tabularnewline
16 & -0.071292 & -0.6049 & 0.726436 \tabularnewline
17 & -0.121729 & -1.0329 & 0.847447 \tabularnewline
18 & -0.008751 & -0.0743 & 0.529492 \tabularnewline
19 & 0.089564 & 0.76 & 0.224876 \tabularnewline
20 & 0.052609 & 0.4464 & 0.328322 \tabularnewline
21 & 0.016994 & 0.1442 & 0.442874 \tabularnewline
22 & -0.045094 & -0.3826 & 0.64844 \tabularnewline
23 & 0.062486 & 0.5302 & 0.2988 \tabularnewline
24 & -0.096261 & -0.8168 & 0.791631 \tabularnewline
25 & -0.106255 & -0.9016 & 0.814863 \tabularnewline
26 & 0.0215 & 0.1824 & 0.427878 \tabularnewline
27 & -0.004347 & -0.0369 & 0.514662 \tabularnewline
28 & 0.036309 & 0.3081 & 0.379452 \tabularnewline
29 & -0.037797 & -0.3207 & 0.625322 \tabularnewline
30 & -0.047495 & -0.403 & 0.655931 \tabularnewline
31 & 0.032842 & 0.2787 & 0.390648 \tabularnewline
32 & -0.027019 & -0.2293 & 0.590343 \tabularnewline
33 & -0.113216 & -0.9607 & 0.830033 \tabularnewline
34 & -0.113183 & -0.9604 & 0.829963 \tabularnewline
35 & -0.009417 & -0.0799 & 0.531734 \tabularnewline
36 & -0.034776 & -0.2951 & 0.615611 \tabularnewline
37 & 0.015637 & 0.1327 & 0.447406 \tabularnewline
38 & -0.065528 & -0.556 & 0.710041 \tabularnewline
39 & 0.059874 & 0.508 & 0.306488 \tabularnewline
40 & -0.038199 & -0.3241 & 0.62661 \tabularnewline
41 & 0.056892 & 0.4827 & 0.315372 \tabularnewline
42 & -0.08881 & -0.7536 & 0.773219 \tabularnewline
43 & -0.042498 & -0.3606 & 0.640277 \tabularnewline
44 & -0.001177 & -0.01 & 0.503969 \tabularnewline
45 & -0.034959 & -0.2966 & 0.616202 \tabularnewline
46 & -0.037762 & -0.3204 & 0.62521 \tabularnewline
47 & -0.075205 & -0.6381 & 0.737294 \tabularnewline
\hline
\end{tabular}
%Source: https://freestatistics.org/blog/index.php?pk=3655&T=2

[TABLE]
[ROW][C]Partial Autocorrelation Function[/C][/ROW]
[ROW][C]Time lag k[/C][C]PACF(k)[/C][C]T-STAT[/C][C]P-value[/C][/ROW]
[ROW][C]0[/C][C]0.231823[/C][C]1.9671[/C][C]0.026514[/C][/ROW]
[ROW][C]1[/C][C]-0.229742[/C][C]-1.9494[/C][C]0.97243[/C][/ROW]
[ROW][C]2[/C][C]-0.165439[/C][C]-1.4038[/C][C]0.91766[/C][/ROW]
[ROW][C]3[/C][C]-0.19343[/C][C]-1.6413[/C][C]0.947453[/C][/ROW]
[ROW][C]4[/C][C]0.071301[/C][C]0.605[/C][C]0.273539[/C][/ROW]
[ROW][C]5[/C][C]0.039822[/C][C]0.3379[/C][C]0.368211[/C][/ROW]
[ROW][C]6[/C][C]-0.069119[/C][C]-0.5865[/C][C]0.720312[/C][/ROW]
[ROW][C]7[/C][C]-0.367328[/C][C]-3.1169[/C][C]0.998687[/C][/ROW]
[ROW][C]8[/C][C]-0.131399[/C][C]-1.115[/C][C]0.865713[/C][/ROW]
[ROW][C]9[/C][C]-0.140488[/C][C]-1.1921[/C][C]0.881429[/C][/ROW]
[ROW][C]10[/C][C]0.093402[/C][C]0.7925[/C][C]0.215325[/C][/ROW]
[ROW][C]11[/C][C]0.604021[/C][C]5.1253[/C][C]1e-06[/C][/ROW]
[ROW][C]12[/C][C]-0.098079[/C][C]-0.8322[/C][C]0.795983[/C][/ROW]
[ROW][C]13[/C][C]0.11732[/C][C]0.9955[/C][C]0.161415[/C][/ROW]
[ROW][C]14[/C][C]-0.108707[/C][C]-0.9224[/C][C]0.820302[/C][/ROW]
[ROW][C]15[/C][C]-0.089263[/C][C]-0.7574[/C][C]0.774367[/C][/ROW]
[ROW][C]16[/C][C]-0.071292[/C][C]-0.6049[/C][C]0.726436[/C][/ROW]
[ROW][C]17[/C][C]-0.121729[/C][C]-1.0329[/C][C]0.847447[/C][/ROW]
[ROW][C]18[/C][C]-0.008751[/C][C]-0.0743[/C][C]0.529492[/C][/ROW]
[ROW][C]19[/C][C]0.089564[/C][C]0.76[/C][C]0.224876[/C][/ROW]
[ROW][C]20[/C][C]0.052609[/C][C]0.4464[/C][C]0.328322[/C][/ROW]
[ROW][C]21[/C][C]0.016994[/C][C]0.1442[/C][C]0.442874[/C][/ROW]
[ROW][C]22[/C][C]-0.045094[/C][C]-0.3826[/C][C]0.64844[/C][/ROW]
[ROW][C]23[/C][C]0.062486[/C][C]0.5302[/C][C]0.2988[/C][/ROW]
[ROW][C]24[/C][C]-0.096261[/C][C]-0.8168[/C][C]0.791631[/C][/ROW]
[ROW][C]25[/C][C]-0.106255[/C][C]-0.9016[/C][C]0.814863[/C][/ROW]
[ROW][C]26[/C][C]0.0215[/C][C]0.1824[/C][C]0.427878[/C][/ROW]
[ROW][C]27[/C][C]-0.004347[/C][C]-0.0369[/C][C]0.514662[/C][/ROW]
[ROW][C]28[/C][C]0.036309[/C][C]0.3081[/C][C]0.379452[/C][/ROW]
[ROW][C]29[/C][C]-0.037797[/C][C]-0.3207[/C][C]0.625322[/C][/ROW]
[ROW][C]30[/C][C]-0.047495[/C][C]-0.403[/C][C]0.655931[/C][/ROW]
[ROW][C]31[/C][C]0.032842[/C][C]0.2787[/C][C]0.390648[/C][/ROW]
[ROW][C]32[/C][C]-0.027019[/C][C]-0.2293[/C][C]0.590343[/C][/ROW]
[ROW][C]33[/C][C]-0.113216[/C][C]-0.9607[/C][C]0.830033[/C][/ROW]
[ROW][C]34[/C][C]-0.113183[/C][C]-0.9604[/C][C]0.829963[/C][/ROW]
[ROW][C]35[/C][C]-0.009417[/C][C]-0.0799[/C][C]0.531734[/C][/ROW]
[ROW][C]36[/C][C]-0.034776[/C][C]-0.2951[/C][C]0.615611[/C][/ROW]
[ROW][C]37[/C][C]0.015637[/C][C]0.1327[/C][C]0.447406[/C][/ROW]
[ROW][C]38[/C][C]-0.065528[/C][C]-0.556[/C][C]0.710041[/C][/ROW]
[ROW][C]39[/C][C]0.059874[/C][C]0.508[/C][C]0.306488[/C][/ROW]
[ROW][C]40[/C][C]-0.038199[/C][C]-0.3241[/C][C]0.62661[/C][/ROW]
[ROW][C]41[/C][C]0.056892[/C][C]0.4827[/C][C]0.315372[/C][/ROW]
[ROW][C]42[/C][C]-0.08881[/C][C]-0.7536[/C][C]0.773219[/C][/ROW]
[ROW][C]43[/C][C]-0.042498[/C][C]-0.3606[/C][C]0.640277[/C][/ROW]
[ROW][C]44[/C][C]-0.001177[/C][C]-0.01[/C][C]0.503969[/C][/ROW]
[ROW][C]45[/C][C]-0.034959[/C][C]-0.2966[/C][C]0.616202[/C][/ROW]
[ROW][C]46[/C][C]-0.037762[/C][C]-0.3204[/C][C]0.62521[/C][/ROW]
[ROW][C]47[/C][C]-0.075205[/C][C]-0.6381[/C][C]0.737294[/C][/ROW]
[/TABLE]
Source: https://freestatistics.org/blog/index.php?pk=3655&T=2

Globally Unique Identifier (entire table): ba.freestatistics.org/blog/index.php?pk=3655&T=2

As an alternative you can also use a QR Code:  

The GUIDs for individual cells are displayed in the table below:

Partial Autocorrelation Function
Time lag kPACF(k)T-STATP-value
00.2318231.96710.026514
1-0.229742-1.94940.97243
2-0.165439-1.40380.91766
3-0.19343-1.64130.947453
40.0713010.6050.273539
50.0398220.33790.368211
6-0.069119-0.58650.720312
7-0.367328-3.11690.998687
8-0.131399-1.1150.865713
9-0.140488-1.19210.881429
100.0934020.79250.215325
110.6040215.12531e-06
12-0.098079-0.83220.795983
130.117320.99550.161415
14-0.108707-0.92240.820302
15-0.089263-0.75740.774367
16-0.071292-0.60490.726436
17-0.121729-1.03290.847447
18-0.008751-0.07430.529492
190.0895640.760.224876
200.0526090.44640.328322
210.0169940.14420.442874
22-0.045094-0.38260.64844
230.0624860.53020.2988
24-0.096261-0.81680.791631
25-0.106255-0.90160.814863
260.02150.18240.427878
27-0.004347-0.03690.514662
280.0363090.30810.379452
29-0.037797-0.32070.625322
30-0.047495-0.4030.655931
310.0328420.27870.390648
32-0.027019-0.22930.590343
33-0.113216-0.96070.830033
34-0.113183-0.96040.829963
35-0.009417-0.07990.531734
36-0.034776-0.29510.615611
370.0156370.13270.447406
38-0.065528-0.5560.710041
390.0598740.5080.306488
40-0.038199-0.32410.62661
410.0568920.48270.315372
42-0.08881-0.75360.773219
43-0.042498-0.36060.640277
44-0.001177-0.010.503969
45-0.034959-0.29660.616202
46-0.037762-0.32040.62521
47-0.075205-0.63810.737294


Parameters (Session):
Parameters (R input):
par1 = 48 ; par2 = 1 ; par3 = 1 ; par4 = 0 ; par5 = 12 ;
R code (references can be found in the software module):
if (par1 == 'Default') {
par1 = 10*log10(length(x))
} else {
par1 <- as.numeric(par1)
}
par2 <- as.numeric(par2)
par3 <- as.numeric(par3)
par4 <- as.numeric(par4)
par5 <- as.numeric(par5)
if (par2 == 0) {
x <- log(x)
} else {
x <- (x ^ par2 - 1) / par2
}
if (par3 > 0) x <- diff(x,lag=1,difference=par3)
if (par4 > 0) x <- diff(x,lag=par5,difference=par4)
bitmap(file='pic1.png')
racf <- acf(x,par1,main='Autocorrelation',xlab='lags',ylab='ACF')
dev.off()
bitmap(file='pic2.png')
rpacf <- pacf(x,par1,main='Partial Autocorrelation',xlab='lags',ylab='PACF')
dev.off()
(myacf <- c(racf$acf))
(mypacf <- c(rpacf$acf))
lengthx <- length(x)
sqrtn <- sqrt(lengthx)
load(file='createtable')
a<-table.start()
a<-table.row.start(a)
a<-table.element(a,'Autocorrelation Function',4,TRUE)
a<-table.row.end(a)
a<-table.row.start(a)
a<-table.element(a,'Time lag k',header=TRUE)
a<-table.element(a,hyperlink('basics.htm','ACF(k)','click here for more information about the Autocorrelation Function'),header=TRUE)
a<-table.element(a,'T-STAT',header=TRUE)
a<-table.element(a,'P-value',header=TRUE)
a<-table.row.end(a)
for (i in 1:par1) {
a<-table.row.start(a)
a<-table.element(a,i-1,header=TRUE)
a<-table.element(a,round(myacf[i],6))
mytstat <- myacf[i]*sqrtn
a<-table.element(a,round(mytstat,4))
a<-table.element(a,round(1-pt(mytstat,lengthx),6))
a<-table.row.end(a)
}
a<-table.end(a)
table.save(a,file='mytable.tab')
a<-table.start()
a<-table.row.start(a)
a<-table.element(a,'Partial Autocorrelation Function',4,TRUE)
a<-table.row.end(a)
a<-table.row.start(a)
a<-table.element(a,'Time lag k',header=TRUE)
a<-table.element(a,hyperlink('basics.htm','PACF(k)','click here for more information about the Partial Autocorrelation Function'),header=TRUE)
a<-table.element(a,'T-STAT',header=TRUE)
a<-table.element(a,'P-value',header=TRUE)
a<-table.row.end(a)
for (i in 1:par1) {
a<-table.row.start(a)
a<-table.element(a,i-1,header=TRUE)
a<-table.element(a,round(mypacf[i],6))
mytstat <- mypacf[i]*sqrtn
a<-table.element(a,round(mytstat,4))
a<-table.element(a,round(1-pt(mytstat,lengthx),6))
a<-table.row.end(a)
}
a<-table.end(a)
table.save(a,file='mytable1.tab')