Free Statistics

of Irreproducible Research!

Author's title

Author*Unverified author*
R Software Modulerwasp_autocorrelation.wasp
Title produced by software(Partial) Autocorrelation Function
Date of computationThu, 13 Dec 2007 09:27:01 -0700
Cite this page as followsStatistical Computations at FreeStatistics.org, Office for Research Development and Education, URL https://freestatistics.org/blog/index.php?v=date/2007/Dec/13/t1197562304g7kjykqt19t4ntw.htm/, Retrieved Sun, 05 May 2024 14:25:34 +0000
Statistical Computations at FreeStatistics.org, Office for Research Development and Education, URL https://freestatistics.org/blog/index.php?pk=3648, Retrieved Sun, 05 May 2024 14:25:34 +0000
QR Codes:

Original text written by user:
IsPrivate?No (this computation is public)
User-defined keywords
Estimated Impact176
Family? (F = Feedback message, R = changed R code, M = changed R Module, P = changed Parameters, D = changed Data)
-       [(Partial) Autocorrelation Function] [autocorrelatie: e...] [2007-12-13 16:27:01] [cb51ec34031fa6f7825ad77351c1efd8] [Current]
Feedback Forum

Post a new message
Dataseries X:
544.5
619.8
777.6
640.4
633
722
860.1
495.1
692.8
766.7
648.5
640
681.6
752.5
1031.7
685.5
887.6
655.4
944.2
626.6
1221.8
939.6
886.6
811.3
774.7
910.6
911.6
697.7
829.8
824.3
885.6
538.9
686
878.7
812.7
640.4
773.9
795.9
836.3
876.1
851.7
692.4
877.3
536.8
705.9
951
755.7
695.5
744.8
672.1
666.6
760.8
756
604.4
883.9
527.9
756.2
812.9
655.6
707.6


Summary of compuational transaction
Raw Inputview raw input (R code)
Raw Outputview raw output of R engine
Computing time2 seconds
R Server'Herman Ole Andreas Wold' @ 193.190.124.10:1001

\begin{tabular}{lllllllll}
\hline
Summary of compuational transaction \tabularnewline
Raw Input & view raw input (R code)  \tabularnewline
Raw Output & view raw output of R engine  \tabularnewline
Computing time & 2 seconds \tabularnewline
R Server & 'Herman Ole Andreas Wold' @ 193.190.124.10:1001 \tabularnewline
\hline
\end{tabular}
%Source: https://freestatistics.org/blog/index.php?pk=3648&T=0

[TABLE]
[ROW][C]Summary of compuational transaction[/C][/ROW]
[ROW][C]Raw Input[/C][C]view raw input (R code) [/C][/ROW]
[ROW][C]Raw Output[/C][C]view raw output of R engine [/C][/ROW]
[ROW][C]Computing time[/C][C]2 seconds[/C][/ROW]
[ROW][C]R Server[/C][C]'Herman Ole Andreas Wold' @ 193.190.124.10:1001[/C][/ROW]
[/TABLE]
Source: https://freestatistics.org/blog/index.php?pk=3648&T=0

Globally Unique Identifier (entire table): ba.freestatistics.org/blog/index.php?pk=3648&T=0

As an alternative you can also use a QR Code:  

The GUIDs for individual cells are displayed in the table below:

Summary of compuational transaction
Raw Inputview raw input (R code)
Raw Outputview raw output of R engine
Computing time2 seconds
R Server'Herman Ole Andreas Wold' @ 193.190.124.10:1001


Autocorrelation Function
Time lag kACF(k)T-STATP-value
017.7460
1-0.03081-0.23870.593906
20.1432331.10950.135825
30.105870.82010.207713
40.2484781.92470.029506
50.0395960.30670.380065
60.1948541.50930.068231
70.0475680.36850.356913
80.1451521.12430.132674
9-0.00969-0.07510.529792
10-0.076971-0.59620.723364
11-0.19402-1.50290.930941
120.2844862.20360.0157
13-0.281811-2.18290.983516
14-0.078177-0.60560.726453
15-0.082344-0.63780.736995
160.0129350.10020.460263
17-0.130567-1.01140.842049
18-0.084222-0.65240.741675
19-0.017901-0.13870.55491
20-0.017029-0.13190.552251
21-0.154068-1.19340.881295
22-0.076315-0.59110.721675
23-0.168571-1.30570.901689
240.1717281.33020.094243
25-0.088243-0.68350.751548
26-0.084327-0.65320.741938
27-0.069434-0.53780.703659
280.0213490.16540.434605
29-0.194853-1.50930.931767
30-0.139746-1.08250.858312
310.0848310.65710.256815
32-0.036763-0.28480.611598
33-0.144762-1.12130.86669
340.0066160.05120.479648
35-0.198658-1.53880.935444
360.0856450.66340.254806
37-0.097619-0.75620.773741
38-0.077188-0.59790.72392
39-0.05682-0.44010.669285
400.071470.55360.290955
41-0.06294-0.48750.686171
420.007410.05740.477211
430.1094310.84760.200001
44-0.024932-0.19310.576244
45-0.006754-0.05230.520773
460.0575190.44550.328766
47-0.00065-0.0050.502001
480.1020250.79030.216238
490.0218640.16940.433043
500.0194690.15080.440316
510.0431330.33410.369733
520.0485290.37590.354157
530.0022410.01740.493104
540.0118980.09220.46344
550.0641680.4970.310486
56-0.00331-0.02560.510184
570.0011740.00910.496387
580.0268370.20790.418014
590.0099860.07730.469302

\begin{tabular}{lllllllll}
\hline
Autocorrelation Function \tabularnewline
Time lag k & ACF(k) & T-STAT & P-value \tabularnewline
0 & 1 & 7.746 & 0 \tabularnewline
1 & -0.03081 & -0.2387 & 0.593906 \tabularnewline
2 & 0.143233 & 1.1095 & 0.135825 \tabularnewline
3 & 0.10587 & 0.8201 & 0.207713 \tabularnewline
4 & 0.248478 & 1.9247 & 0.029506 \tabularnewline
5 & 0.039596 & 0.3067 & 0.380065 \tabularnewline
6 & 0.194854 & 1.5093 & 0.068231 \tabularnewline
7 & 0.047568 & 0.3685 & 0.356913 \tabularnewline
8 & 0.145152 & 1.1243 & 0.132674 \tabularnewline
9 & -0.00969 & -0.0751 & 0.529792 \tabularnewline
10 & -0.076971 & -0.5962 & 0.723364 \tabularnewline
11 & -0.19402 & -1.5029 & 0.930941 \tabularnewline
12 & 0.284486 & 2.2036 & 0.0157 \tabularnewline
13 & -0.281811 & -2.1829 & 0.983516 \tabularnewline
14 & -0.078177 & -0.6056 & 0.726453 \tabularnewline
15 & -0.082344 & -0.6378 & 0.736995 \tabularnewline
16 & 0.012935 & 0.1002 & 0.460263 \tabularnewline
17 & -0.130567 & -1.0114 & 0.842049 \tabularnewline
18 & -0.084222 & -0.6524 & 0.741675 \tabularnewline
19 & -0.017901 & -0.1387 & 0.55491 \tabularnewline
20 & -0.017029 & -0.1319 & 0.552251 \tabularnewline
21 & -0.154068 & -1.1934 & 0.881295 \tabularnewline
22 & -0.076315 & -0.5911 & 0.721675 \tabularnewline
23 & -0.168571 & -1.3057 & 0.901689 \tabularnewline
24 & 0.171728 & 1.3302 & 0.094243 \tabularnewline
25 & -0.088243 & -0.6835 & 0.751548 \tabularnewline
26 & -0.084327 & -0.6532 & 0.741938 \tabularnewline
27 & -0.069434 & -0.5378 & 0.703659 \tabularnewline
28 & 0.021349 & 0.1654 & 0.434605 \tabularnewline
29 & -0.194853 & -1.5093 & 0.931767 \tabularnewline
30 & -0.139746 & -1.0825 & 0.858312 \tabularnewline
31 & 0.084831 & 0.6571 & 0.256815 \tabularnewline
32 & -0.036763 & -0.2848 & 0.611598 \tabularnewline
33 & -0.144762 & -1.1213 & 0.86669 \tabularnewline
34 & 0.006616 & 0.0512 & 0.479648 \tabularnewline
35 & -0.198658 & -1.5388 & 0.935444 \tabularnewline
36 & 0.085645 & 0.6634 & 0.254806 \tabularnewline
37 & -0.097619 & -0.7562 & 0.773741 \tabularnewline
38 & -0.077188 & -0.5979 & 0.72392 \tabularnewline
39 & -0.05682 & -0.4401 & 0.669285 \tabularnewline
40 & 0.07147 & 0.5536 & 0.290955 \tabularnewline
41 & -0.06294 & -0.4875 & 0.686171 \tabularnewline
42 & 0.00741 & 0.0574 & 0.477211 \tabularnewline
43 & 0.109431 & 0.8476 & 0.200001 \tabularnewline
44 & -0.024932 & -0.1931 & 0.576244 \tabularnewline
45 & -0.006754 & -0.0523 & 0.520773 \tabularnewline
46 & 0.057519 & 0.4455 & 0.328766 \tabularnewline
47 & -0.00065 & -0.005 & 0.502001 \tabularnewline
48 & 0.102025 & 0.7903 & 0.216238 \tabularnewline
49 & 0.021864 & 0.1694 & 0.433043 \tabularnewline
50 & 0.019469 & 0.1508 & 0.440316 \tabularnewline
51 & 0.043133 & 0.3341 & 0.369733 \tabularnewline
52 & 0.048529 & 0.3759 & 0.354157 \tabularnewline
53 & 0.002241 & 0.0174 & 0.493104 \tabularnewline
54 & 0.011898 & 0.0922 & 0.46344 \tabularnewline
55 & 0.064168 & 0.497 & 0.310486 \tabularnewline
56 & -0.00331 & -0.0256 & 0.510184 \tabularnewline
57 & 0.001174 & 0.0091 & 0.496387 \tabularnewline
58 & 0.026837 & 0.2079 & 0.418014 \tabularnewline
59 & 0.009986 & 0.0773 & 0.469302 \tabularnewline
\hline
\end{tabular}
%Source: https://freestatistics.org/blog/index.php?pk=3648&T=1

[TABLE]
[ROW][C]Autocorrelation Function[/C][/ROW]
[ROW][C]Time lag k[/C][C]ACF(k)[/C][C]T-STAT[/C][C]P-value[/C][/ROW]
[ROW][C]0[/C][C]1[/C][C]7.746[/C][C]0[/C][/ROW]
[ROW][C]1[/C][C]-0.03081[/C][C]-0.2387[/C][C]0.593906[/C][/ROW]
[ROW][C]2[/C][C]0.143233[/C][C]1.1095[/C][C]0.135825[/C][/ROW]
[ROW][C]3[/C][C]0.10587[/C][C]0.8201[/C][C]0.207713[/C][/ROW]
[ROW][C]4[/C][C]0.248478[/C][C]1.9247[/C][C]0.029506[/C][/ROW]
[ROW][C]5[/C][C]0.039596[/C][C]0.3067[/C][C]0.380065[/C][/ROW]
[ROW][C]6[/C][C]0.194854[/C][C]1.5093[/C][C]0.068231[/C][/ROW]
[ROW][C]7[/C][C]0.047568[/C][C]0.3685[/C][C]0.356913[/C][/ROW]
[ROW][C]8[/C][C]0.145152[/C][C]1.1243[/C][C]0.132674[/C][/ROW]
[ROW][C]9[/C][C]-0.00969[/C][C]-0.0751[/C][C]0.529792[/C][/ROW]
[ROW][C]10[/C][C]-0.076971[/C][C]-0.5962[/C][C]0.723364[/C][/ROW]
[ROW][C]11[/C][C]-0.19402[/C][C]-1.5029[/C][C]0.930941[/C][/ROW]
[ROW][C]12[/C][C]0.284486[/C][C]2.2036[/C][C]0.0157[/C][/ROW]
[ROW][C]13[/C][C]-0.281811[/C][C]-2.1829[/C][C]0.983516[/C][/ROW]
[ROW][C]14[/C][C]-0.078177[/C][C]-0.6056[/C][C]0.726453[/C][/ROW]
[ROW][C]15[/C][C]-0.082344[/C][C]-0.6378[/C][C]0.736995[/C][/ROW]
[ROW][C]16[/C][C]0.012935[/C][C]0.1002[/C][C]0.460263[/C][/ROW]
[ROW][C]17[/C][C]-0.130567[/C][C]-1.0114[/C][C]0.842049[/C][/ROW]
[ROW][C]18[/C][C]-0.084222[/C][C]-0.6524[/C][C]0.741675[/C][/ROW]
[ROW][C]19[/C][C]-0.017901[/C][C]-0.1387[/C][C]0.55491[/C][/ROW]
[ROW][C]20[/C][C]-0.017029[/C][C]-0.1319[/C][C]0.552251[/C][/ROW]
[ROW][C]21[/C][C]-0.154068[/C][C]-1.1934[/C][C]0.881295[/C][/ROW]
[ROW][C]22[/C][C]-0.076315[/C][C]-0.5911[/C][C]0.721675[/C][/ROW]
[ROW][C]23[/C][C]-0.168571[/C][C]-1.3057[/C][C]0.901689[/C][/ROW]
[ROW][C]24[/C][C]0.171728[/C][C]1.3302[/C][C]0.094243[/C][/ROW]
[ROW][C]25[/C][C]-0.088243[/C][C]-0.6835[/C][C]0.751548[/C][/ROW]
[ROW][C]26[/C][C]-0.084327[/C][C]-0.6532[/C][C]0.741938[/C][/ROW]
[ROW][C]27[/C][C]-0.069434[/C][C]-0.5378[/C][C]0.703659[/C][/ROW]
[ROW][C]28[/C][C]0.021349[/C][C]0.1654[/C][C]0.434605[/C][/ROW]
[ROW][C]29[/C][C]-0.194853[/C][C]-1.5093[/C][C]0.931767[/C][/ROW]
[ROW][C]30[/C][C]-0.139746[/C][C]-1.0825[/C][C]0.858312[/C][/ROW]
[ROW][C]31[/C][C]0.084831[/C][C]0.6571[/C][C]0.256815[/C][/ROW]
[ROW][C]32[/C][C]-0.036763[/C][C]-0.2848[/C][C]0.611598[/C][/ROW]
[ROW][C]33[/C][C]-0.144762[/C][C]-1.1213[/C][C]0.86669[/C][/ROW]
[ROW][C]34[/C][C]0.006616[/C][C]0.0512[/C][C]0.479648[/C][/ROW]
[ROW][C]35[/C][C]-0.198658[/C][C]-1.5388[/C][C]0.935444[/C][/ROW]
[ROW][C]36[/C][C]0.085645[/C][C]0.6634[/C][C]0.254806[/C][/ROW]
[ROW][C]37[/C][C]-0.097619[/C][C]-0.7562[/C][C]0.773741[/C][/ROW]
[ROW][C]38[/C][C]-0.077188[/C][C]-0.5979[/C][C]0.72392[/C][/ROW]
[ROW][C]39[/C][C]-0.05682[/C][C]-0.4401[/C][C]0.669285[/C][/ROW]
[ROW][C]40[/C][C]0.07147[/C][C]0.5536[/C][C]0.290955[/C][/ROW]
[ROW][C]41[/C][C]-0.06294[/C][C]-0.4875[/C][C]0.686171[/C][/ROW]
[ROW][C]42[/C][C]0.00741[/C][C]0.0574[/C][C]0.477211[/C][/ROW]
[ROW][C]43[/C][C]0.109431[/C][C]0.8476[/C][C]0.200001[/C][/ROW]
[ROW][C]44[/C][C]-0.024932[/C][C]-0.1931[/C][C]0.576244[/C][/ROW]
[ROW][C]45[/C][C]-0.006754[/C][C]-0.0523[/C][C]0.520773[/C][/ROW]
[ROW][C]46[/C][C]0.057519[/C][C]0.4455[/C][C]0.328766[/C][/ROW]
[ROW][C]47[/C][C]-0.00065[/C][C]-0.005[/C][C]0.502001[/C][/ROW]
[ROW][C]48[/C][C]0.102025[/C][C]0.7903[/C][C]0.216238[/C][/ROW]
[ROW][C]49[/C][C]0.021864[/C][C]0.1694[/C][C]0.433043[/C][/ROW]
[ROW][C]50[/C][C]0.019469[/C][C]0.1508[/C][C]0.440316[/C][/ROW]
[ROW][C]51[/C][C]0.043133[/C][C]0.3341[/C][C]0.369733[/C][/ROW]
[ROW][C]52[/C][C]0.048529[/C][C]0.3759[/C][C]0.354157[/C][/ROW]
[ROW][C]53[/C][C]0.002241[/C][C]0.0174[/C][C]0.493104[/C][/ROW]
[ROW][C]54[/C][C]0.011898[/C][C]0.0922[/C][C]0.46344[/C][/ROW]
[ROW][C]55[/C][C]0.064168[/C][C]0.497[/C][C]0.310486[/C][/ROW]
[ROW][C]56[/C][C]-0.00331[/C][C]-0.0256[/C][C]0.510184[/C][/ROW]
[ROW][C]57[/C][C]0.001174[/C][C]0.0091[/C][C]0.496387[/C][/ROW]
[ROW][C]58[/C][C]0.026837[/C][C]0.2079[/C][C]0.418014[/C][/ROW]
[ROW][C]59[/C][C]0.009986[/C][C]0.0773[/C][C]0.469302[/C][/ROW]
[/TABLE]
Source: https://freestatistics.org/blog/index.php?pk=3648&T=1

Globally Unique Identifier (entire table): ba.freestatistics.org/blog/index.php?pk=3648&T=1

As an alternative you can also use a QR Code:  

The GUIDs for individual cells are displayed in the table below:

Autocorrelation Function
Time lag kACF(k)T-STATP-value
017.7460
1-0.03081-0.23870.593906
20.1432331.10950.135825
30.105870.82010.207713
40.2484781.92470.029506
50.0395960.30670.380065
60.1948541.50930.068231
70.0475680.36850.356913
80.1451521.12430.132674
9-0.00969-0.07510.529792
10-0.076971-0.59620.723364
11-0.19402-1.50290.930941
120.2844862.20360.0157
13-0.281811-2.18290.983516
14-0.078177-0.60560.726453
15-0.082344-0.63780.736995
160.0129350.10020.460263
17-0.130567-1.01140.842049
18-0.084222-0.65240.741675
19-0.017901-0.13870.55491
20-0.017029-0.13190.552251
21-0.154068-1.19340.881295
22-0.076315-0.59110.721675
23-0.168571-1.30570.901689
240.1717281.33020.094243
25-0.088243-0.68350.751548
26-0.084327-0.65320.741938
27-0.069434-0.53780.703659
280.0213490.16540.434605
29-0.194853-1.50930.931767
30-0.139746-1.08250.858312
310.0848310.65710.256815
32-0.036763-0.28480.611598
33-0.144762-1.12130.86669
340.0066160.05120.479648
35-0.198658-1.53880.935444
360.0856450.66340.254806
37-0.097619-0.75620.773741
38-0.077188-0.59790.72392
39-0.05682-0.44010.669285
400.071470.55360.290955
41-0.06294-0.48750.686171
420.007410.05740.477211
430.1094310.84760.200001
44-0.024932-0.19310.576244
45-0.006754-0.05230.520773
460.0575190.44550.328766
47-0.00065-0.0050.502001
480.1020250.79030.216238
490.0218640.16940.433043
500.0194690.15080.440316
510.0431330.33410.369733
520.0485290.37590.354157
530.0022410.01740.493104
540.0118980.09220.46344
550.0641680.4970.310486
56-0.00331-0.02560.510184
570.0011740.00910.496387
580.0268370.20790.418014
590.0099860.07730.469302


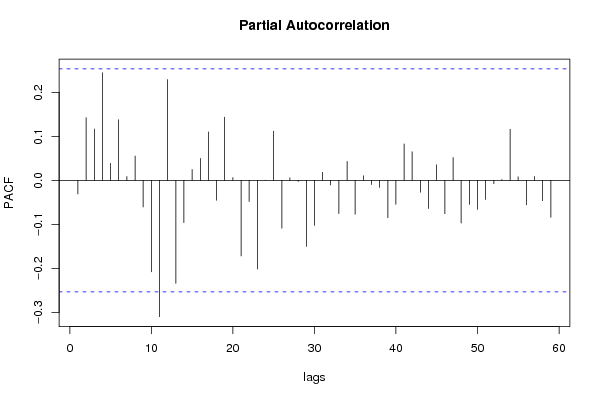
Partial Autocorrelation Function
Time lag kPACF(k)T-STATP-value
0-0.03081-0.23870.593906
10.1424191.10320.137178
20.1165140.90250.185197
30.2442071.89160.031686
40.0385970.2990.382999
50.1376281.06610.145334
60.0087090.06750.473221
70.0552520.4280.335098
8-0.0604-0.46790.679208
9-0.20763-1.60830.94349
10-0.309533-2.39760.990185
110.2289171.77320.040637
12-0.233947-1.81210.962516
13-0.095752-0.74170.769417
140.0245680.19030.424858
150.0498850.38640.350281
160.1099290.85150.198937
17-0.045013-0.34870.635721
180.1433491.11040.135633
190.0064950.05030.480021
20-0.171793-1.33070.905839
21-0.047801-0.37030.643754
22-0.20114-1.5580.937757
230.0003040.00240.499066
240.1116460.86480.195295
25-0.108612-0.84130.798241
260.0058730.04550.481933
27-0.002589-0.02010.507968
28-0.14995-1.16150.874982
29-0.102129-0.79110.783995
300.0182470.14130.444036
31-0.010532-0.08160.532375
32-0.075295-0.58320.719039
330.0429720.33290.3702
34-0.076808-0.59490.722943
350.0102350.07930.468538
36-0.009587-0.07430.529476
37-0.016118-0.12480.549469
38-0.084695-0.6560.742849
39-0.054501-0.42220.662794
400.0827040.64060.262105
410.0647920.50190.308795
42-0.026726-0.2070.581653
43-0.064097-0.49650.68932
440.0354210.27440.392371
45-0.075827-0.58740.720414
460.0517390.40080.345008
47-0.097097-0.75210.772537
48-0.05469-0.42360.663323
49-0.065727-0.50910.693731
50-0.043371-0.3360.63096
51-0.007705-0.05970.523696
520.0017880.01380.494499
530.1158930.89770.186465
540.0081180.06290.475035
55-0.055675-0.43130.666086
560.0090270.06990.472243
57-0.046317-0.35880.639486
58-0.084016-0.65080.741165
59NANANA

\begin{tabular}{lllllllll}
\hline
Partial Autocorrelation Function \tabularnewline
Time lag k & PACF(k) & T-STAT & P-value \tabularnewline
0 & -0.03081 & -0.2387 & 0.593906 \tabularnewline
1 & 0.142419 & 1.1032 & 0.137178 \tabularnewline
2 & 0.116514 & 0.9025 & 0.185197 \tabularnewline
3 & 0.244207 & 1.8916 & 0.031686 \tabularnewline
4 & 0.038597 & 0.299 & 0.382999 \tabularnewline
5 & 0.137628 & 1.0661 & 0.145334 \tabularnewline
6 & 0.008709 & 0.0675 & 0.473221 \tabularnewline
7 & 0.055252 & 0.428 & 0.335098 \tabularnewline
8 & -0.0604 & -0.4679 & 0.679208 \tabularnewline
9 & -0.20763 & -1.6083 & 0.94349 \tabularnewline
10 & -0.309533 & -2.3976 & 0.990185 \tabularnewline
11 & 0.228917 & 1.7732 & 0.040637 \tabularnewline
12 & -0.233947 & -1.8121 & 0.962516 \tabularnewline
13 & -0.095752 & -0.7417 & 0.769417 \tabularnewline
14 & 0.024568 & 0.1903 & 0.424858 \tabularnewline
15 & 0.049885 & 0.3864 & 0.350281 \tabularnewline
16 & 0.109929 & 0.8515 & 0.198937 \tabularnewline
17 & -0.045013 & -0.3487 & 0.635721 \tabularnewline
18 & 0.143349 & 1.1104 & 0.135633 \tabularnewline
19 & 0.006495 & 0.0503 & 0.480021 \tabularnewline
20 & -0.171793 & -1.3307 & 0.905839 \tabularnewline
21 & -0.047801 & -0.3703 & 0.643754 \tabularnewline
22 & -0.20114 & -1.558 & 0.937757 \tabularnewline
23 & 0.000304 & 0.0024 & 0.499066 \tabularnewline
24 & 0.111646 & 0.8648 & 0.195295 \tabularnewline
25 & -0.108612 & -0.8413 & 0.798241 \tabularnewline
26 & 0.005873 & 0.0455 & 0.481933 \tabularnewline
27 & -0.002589 & -0.0201 & 0.507968 \tabularnewline
28 & -0.14995 & -1.1615 & 0.874982 \tabularnewline
29 & -0.102129 & -0.7911 & 0.783995 \tabularnewline
30 & 0.018247 & 0.1413 & 0.444036 \tabularnewline
31 & -0.010532 & -0.0816 & 0.532375 \tabularnewline
32 & -0.075295 & -0.5832 & 0.719039 \tabularnewline
33 & 0.042972 & 0.3329 & 0.3702 \tabularnewline
34 & -0.076808 & -0.5949 & 0.722943 \tabularnewline
35 & 0.010235 & 0.0793 & 0.468538 \tabularnewline
36 & -0.009587 & -0.0743 & 0.529476 \tabularnewline
37 & -0.016118 & -0.1248 & 0.549469 \tabularnewline
38 & -0.084695 & -0.656 & 0.742849 \tabularnewline
39 & -0.054501 & -0.4222 & 0.662794 \tabularnewline
40 & 0.082704 & 0.6406 & 0.262105 \tabularnewline
41 & 0.064792 & 0.5019 & 0.308795 \tabularnewline
42 & -0.026726 & -0.207 & 0.581653 \tabularnewline
43 & -0.064097 & -0.4965 & 0.68932 \tabularnewline
44 & 0.035421 & 0.2744 & 0.392371 \tabularnewline
45 & -0.075827 & -0.5874 & 0.720414 \tabularnewline
46 & 0.051739 & 0.4008 & 0.345008 \tabularnewline
47 & -0.097097 & -0.7521 & 0.772537 \tabularnewline
48 & -0.05469 & -0.4236 & 0.663323 \tabularnewline
49 & -0.065727 & -0.5091 & 0.693731 \tabularnewline
50 & -0.043371 & -0.336 & 0.63096 \tabularnewline
51 & -0.007705 & -0.0597 & 0.523696 \tabularnewline
52 & 0.001788 & 0.0138 & 0.494499 \tabularnewline
53 & 0.115893 & 0.8977 & 0.186465 \tabularnewline
54 & 0.008118 & 0.0629 & 0.475035 \tabularnewline
55 & -0.055675 & -0.4313 & 0.666086 \tabularnewline
56 & 0.009027 & 0.0699 & 0.472243 \tabularnewline
57 & -0.046317 & -0.3588 & 0.639486 \tabularnewline
58 & -0.084016 & -0.6508 & 0.741165 \tabularnewline
59 & NA & NA & NA \tabularnewline
\hline
\end{tabular}
%Source: https://freestatistics.org/blog/index.php?pk=3648&T=2

[TABLE]
[ROW][C]Partial Autocorrelation Function[/C][/ROW]
[ROW][C]Time lag k[/C][C]PACF(k)[/C][C]T-STAT[/C][C]P-value[/C][/ROW]
[ROW][C]0[/C][C]-0.03081[/C][C]-0.2387[/C][C]0.593906[/C][/ROW]
[ROW][C]1[/C][C]0.142419[/C][C]1.1032[/C][C]0.137178[/C][/ROW]
[ROW][C]2[/C][C]0.116514[/C][C]0.9025[/C][C]0.185197[/C][/ROW]
[ROW][C]3[/C][C]0.244207[/C][C]1.8916[/C][C]0.031686[/C][/ROW]
[ROW][C]4[/C][C]0.038597[/C][C]0.299[/C][C]0.382999[/C][/ROW]
[ROW][C]5[/C][C]0.137628[/C][C]1.0661[/C][C]0.145334[/C][/ROW]
[ROW][C]6[/C][C]0.008709[/C][C]0.0675[/C][C]0.473221[/C][/ROW]
[ROW][C]7[/C][C]0.055252[/C][C]0.428[/C][C]0.335098[/C][/ROW]
[ROW][C]8[/C][C]-0.0604[/C][C]-0.4679[/C][C]0.679208[/C][/ROW]
[ROW][C]9[/C][C]-0.20763[/C][C]-1.6083[/C][C]0.94349[/C][/ROW]
[ROW][C]10[/C][C]-0.309533[/C][C]-2.3976[/C][C]0.990185[/C][/ROW]
[ROW][C]11[/C][C]0.228917[/C][C]1.7732[/C][C]0.040637[/C][/ROW]
[ROW][C]12[/C][C]-0.233947[/C][C]-1.8121[/C][C]0.962516[/C][/ROW]
[ROW][C]13[/C][C]-0.095752[/C][C]-0.7417[/C][C]0.769417[/C][/ROW]
[ROW][C]14[/C][C]0.024568[/C][C]0.1903[/C][C]0.424858[/C][/ROW]
[ROW][C]15[/C][C]0.049885[/C][C]0.3864[/C][C]0.350281[/C][/ROW]
[ROW][C]16[/C][C]0.109929[/C][C]0.8515[/C][C]0.198937[/C][/ROW]
[ROW][C]17[/C][C]-0.045013[/C][C]-0.3487[/C][C]0.635721[/C][/ROW]
[ROW][C]18[/C][C]0.143349[/C][C]1.1104[/C][C]0.135633[/C][/ROW]
[ROW][C]19[/C][C]0.006495[/C][C]0.0503[/C][C]0.480021[/C][/ROW]
[ROW][C]20[/C][C]-0.171793[/C][C]-1.3307[/C][C]0.905839[/C][/ROW]
[ROW][C]21[/C][C]-0.047801[/C][C]-0.3703[/C][C]0.643754[/C][/ROW]
[ROW][C]22[/C][C]-0.20114[/C][C]-1.558[/C][C]0.937757[/C][/ROW]
[ROW][C]23[/C][C]0.000304[/C][C]0.0024[/C][C]0.499066[/C][/ROW]
[ROW][C]24[/C][C]0.111646[/C][C]0.8648[/C][C]0.195295[/C][/ROW]
[ROW][C]25[/C][C]-0.108612[/C][C]-0.8413[/C][C]0.798241[/C][/ROW]
[ROW][C]26[/C][C]0.005873[/C][C]0.0455[/C][C]0.481933[/C][/ROW]
[ROW][C]27[/C][C]-0.002589[/C][C]-0.0201[/C][C]0.507968[/C][/ROW]
[ROW][C]28[/C][C]-0.14995[/C][C]-1.1615[/C][C]0.874982[/C][/ROW]
[ROW][C]29[/C][C]-0.102129[/C][C]-0.7911[/C][C]0.783995[/C][/ROW]
[ROW][C]30[/C][C]0.018247[/C][C]0.1413[/C][C]0.444036[/C][/ROW]
[ROW][C]31[/C][C]-0.010532[/C][C]-0.0816[/C][C]0.532375[/C][/ROW]
[ROW][C]32[/C][C]-0.075295[/C][C]-0.5832[/C][C]0.719039[/C][/ROW]
[ROW][C]33[/C][C]0.042972[/C][C]0.3329[/C][C]0.3702[/C][/ROW]
[ROW][C]34[/C][C]-0.076808[/C][C]-0.5949[/C][C]0.722943[/C][/ROW]
[ROW][C]35[/C][C]0.010235[/C][C]0.0793[/C][C]0.468538[/C][/ROW]
[ROW][C]36[/C][C]-0.009587[/C][C]-0.0743[/C][C]0.529476[/C][/ROW]
[ROW][C]37[/C][C]-0.016118[/C][C]-0.1248[/C][C]0.549469[/C][/ROW]
[ROW][C]38[/C][C]-0.084695[/C][C]-0.656[/C][C]0.742849[/C][/ROW]
[ROW][C]39[/C][C]-0.054501[/C][C]-0.4222[/C][C]0.662794[/C][/ROW]
[ROW][C]40[/C][C]0.082704[/C][C]0.6406[/C][C]0.262105[/C][/ROW]
[ROW][C]41[/C][C]0.064792[/C][C]0.5019[/C][C]0.308795[/C][/ROW]
[ROW][C]42[/C][C]-0.026726[/C][C]-0.207[/C][C]0.581653[/C][/ROW]
[ROW][C]43[/C][C]-0.064097[/C][C]-0.4965[/C][C]0.68932[/C][/ROW]
[ROW][C]44[/C][C]0.035421[/C][C]0.2744[/C][C]0.392371[/C][/ROW]
[ROW][C]45[/C][C]-0.075827[/C][C]-0.5874[/C][C]0.720414[/C][/ROW]
[ROW][C]46[/C][C]0.051739[/C][C]0.4008[/C][C]0.345008[/C][/ROW]
[ROW][C]47[/C][C]-0.097097[/C][C]-0.7521[/C][C]0.772537[/C][/ROW]
[ROW][C]48[/C][C]-0.05469[/C][C]-0.4236[/C][C]0.663323[/C][/ROW]
[ROW][C]49[/C][C]-0.065727[/C][C]-0.5091[/C][C]0.693731[/C][/ROW]
[ROW][C]50[/C][C]-0.043371[/C][C]-0.336[/C][C]0.63096[/C][/ROW]
[ROW][C]51[/C][C]-0.007705[/C][C]-0.0597[/C][C]0.523696[/C][/ROW]
[ROW][C]52[/C][C]0.001788[/C][C]0.0138[/C][C]0.494499[/C][/ROW]
[ROW][C]53[/C][C]0.115893[/C][C]0.8977[/C][C]0.186465[/C][/ROW]
[ROW][C]54[/C][C]0.008118[/C][C]0.0629[/C][C]0.475035[/C][/ROW]
[ROW][C]55[/C][C]-0.055675[/C][C]-0.4313[/C][C]0.666086[/C][/ROW]
[ROW][C]56[/C][C]0.009027[/C][C]0.0699[/C][C]0.472243[/C][/ROW]
[ROW][C]57[/C][C]-0.046317[/C][C]-0.3588[/C][C]0.639486[/C][/ROW]
[ROW][C]58[/C][C]-0.084016[/C][C]-0.6508[/C][C]0.741165[/C][/ROW]
[ROW][C]59[/C][C]NA[/C][C]NA[/C][C]NA[/C][/ROW]
[/TABLE]
Source: https://freestatistics.org/blog/index.php?pk=3648&T=2

Globally Unique Identifier (entire table): ba.freestatistics.org/blog/index.php?pk=3648&T=2

As an alternative you can also use a QR Code:  

The GUIDs for individual cells are displayed in the table below:

Partial Autocorrelation Function
Time lag kPACF(k)T-STATP-value
0-0.03081-0.23870.593906
10.1424191.10320.137178
20.1165140.90250.185197
30.2442071.89160.031686
40.0385970.2990.382999
50.1376281.06610.145334
60.0087090.06750.473221
70.0552520.4280.335098
8-0.0604-0.46790.679208
9-0.20763-1.60830.94349
10-0.309533-2.39760.990185
110.2289171.77320.040637
12-0.233947-1.81210.962516
13-0.095752-0.74170.769417
140.0245680.19030.424858
150.0498850.38640.350281
160.1099290.85150.198937
17-0.045013-0.34870.635721
180.1433491.11040.135633
190.0064950.05030.480021
20-0.171793-1.33070.905839
21-0.047801-0.37030.643754
22-0.20114-1.5580.937757
230.0003040.00240.499066
240.1116460.86480.195295
25-0.108612-0.84130.798241
260.0058730.04550.481933
27-0.002589-0.02010.507968
28-0.14995-1.16150.874982
29-0.102129-0.79110.783995
300.0182470.14130.444036
31-0.010532-0.08160.532375
32-0.075295-0.58320.719039
330.0429720.33290.3702
34-0.076808-0.59490.722943
350.0102350.07930.468538
36-0.009587-0.07430.529476
37-0.016118-0.12480.549469
38-0.084695-0.6560.742849
39-0.054501-0.42220.662794
400.0827040.64060.262105
410.0647920.50190.308795
42-0.026726-0.2070.581653
43-0.064097-0.49650.68932
440.0354210.27440.392371
45-0.075827-0.58740.720414
460.0517390.40080.345008
47-0.097097-0.75210.772537
48-0.05469-0.42360.663323
49-0.065727-0.50910.693731
50-0.043371-0.3360.63096
51-0.007705-0.05970.523696
520.0017880.01380.494499
530.1158930.89770.186465
540.0081180.06290.475035
55-0.055675-0.43130.666086
560.0090270.06990.472243
57-0.046317-0.35880.639486
58-0.084016-0.65080.741165
59NANANA


Parameters (Session):
par1 = 60 ; par2 = 1 ; par3 = 0 ; par4 = 0 ; par5 = 12 ;
Parameters (R input):
par1 = 60 ; par2 = 1 ; par3 = 0 ; par4 = 0 ; par5 = 12 ;
R code (references can be found in the software module):
if (par1 == 'Default') {
par1 = 10*log10(length(x))
} else {
par1 <- as.numeric(par1)
}
par2 <- as.numeric(par2)
par3 <- as.numeric(par3)
par4 <- as.numeric(par4)
par5 <- as.numeric(par5)
if (par2 == 0) {
x <- log(x)
} else {
x <- (x ^ par2 - 1) / par2
}
if (par3 > 0) x <- diff(x,lag=1,difference=par3)
if (par4 > 0) x <- diff(x,lag=par5,difference=par4)
bitmap(file='pic1.png')
racf <- acf(x,par1,main='Autocorrelation',xlab='lags',ylab='ACF')
dev.off()
bitmap(file='pic2.png')
rpacf <- pacf(x,par1,main='Partial Autocorrelation',xlab='lags',ylab='PACF')
dev.off()
(myacf <- c(racf$acf))
(mypacf <- c(rpacf$acf))
lengthx <- length(x)
sqrtn <- sqrt(lengthx)
load(file='createtable')
a<-table.start()
a<-table.row.start(a)
a<-table.element(a,'Autocorrelation Function',4,TRUE)
a<-table.row.end(a)
a<-table.row.start(a)
a<-table.element(a,'Time lag k',header=TRUE)
a<-table.element(a,hyperlink('basics.htm','ACF(k)','click here for more information about the Autocorrelation Function'),header=TRUE)
a<-table.element(a,'T-STAT',header=TRUE)
a<-table.element(a,'P-value',header=TRUE)
a<-table.row.end(a)
for (i in 1:par1) {
a<-table.row.start(a)
a<-table.element(a,i-1,header=TRUE)
a<-table.element(a,round(myacf[i],6))
mytstat <- myacf[i]*sqrtn
a<-table.element(a,round(mytstat,4))
a<-table.element(a,round(1-pt(mytstat,lengthx),6))
a<-table.row.end(a)
}
a<-table.end(a)
table.save(a,file='mytable.tab')
a<-table.start()
a<-table.row.start(a)
a<-table.element(a,'Partial Autocorrelation Function',4,TRUE)
a<-table.row.end(a)
a<-table.row.start(a)
a<-table.element(a,'Time lag k',header=TRUE)
a<-table.element(a,hyperlink('basics.htm','PACF(k)','click here for more information about the Partial Autocorrelation Function'),header=TRUE)
a<-table.element(a,'T-STAT',header=TRUE)
a<-table.element(a,'P-value',header=TRUE)
a<-table.row.end(a)
for (i in 1:par1) {
a<-table.row.start(a)
a<-table.element(a,i-1,header=TRUE)
a<-table.element(a,round(mypacf[i],6))
mytstat <- mypacf[i]*sqrtn
a<-table.element(a,round(mytstat,4))
a<-table.element(a,round(1-pt(mytstat,lengthx),6))
a<-table.row.end(a)
}
a<-table.end(a)
table.save(a,file='mytable1.tab')