Free Statistics

of Irreproducible Research!

Author's title

Author*Unverified author*
R Software Modulerwasp_multipleregression.wasp
Title produced by softwareMultiple Regression
Date of computationThu, 13 Dec 2007 07:31:43 -0700
Cite this page as followsStatistical Computations at FreeStatistics.org, Office for Research Development and Education, URL https://freestatistics.org/blog/index.php?v=date/2007/Dec/13/t1197555490wzoadlo5t7ujr1j.htm/, Retrieved Sun, 05 May 2024 09:26:27 +0000
Statistical Computations at FreeStatistics.org, Office for Research Development and Education, URL https://freestatistics.org/blog/index.php?pk=14360, Retrieved Sun, 05 May 2024 09:26:27 +0000
QR Codes:

Original text written by user:
IsPrivate?No (this computation is public)
User-defined keywordsAfzetprijzen en sector productie Tinne Van der Eycken
Estimated Impact210
Family? (F = Feedback message, R = changed R code, M = changed R Module, P = changed Parameters, D = changed Data)
-       [Multiple Regression] [paper: multiple r...] [2007-12-13 14:31:43] [90363522466987ceff6d31d9a5808903] [Current]
Feedback Forum

Post a new message
Dataseries X:
86.5	109.2
104.1	126.3
110.9	104
114.5	96
112.2	262
96.4	89.8
92	86
102	92.7
99.7	126.8
102	92.8
98.9	87.8
87.4	100
94.4	72.4
109.3	104.9
116.4	52.3
101	65.3
105.5	110.2
97.8	54.4
95.5	47.5
113.7	65.2
103.7	69.8
100.8	53.6
113.8	116.1
84.6	56.6
95.3	47.2
110	90.6
107.5	60.4
107.6	59.3
116	131.6
96.9	59.4
97	65.5
108.1	70.5
101.9	81
107.2	73.3
110.2	107.5
78.7	88.9
96.5	55.8
115.2	80.5
104.7	86.3
109.1	112.6
108.4	148.6
95.5	47.1
97.8	57.8
115.1	81
96.2	60.1
112	76.1
111.8	82.5
82.5	66.8
100.8	58.7
116	54.2
116.3	103.3
116.6	77.8
112.9	118.4
100.9	64.9
104.1	40.8
117.4	77.7
103.3	66.8
111.6	69.2
115	82.4
92.6	62.7
105.2	58.2


Summary of compuational transaction
Raw Inputview raw input (R code)
Raw Outputview raw output of R engine
Computing time3 seconds
R Server'Gwilym Jenkins' @ 72.249.127.135

\begin{tabular}{lllllllll}
\hline
Summary of compuational transaction \tabularnewline
Raw Input & view raw input (R code)  \tabularnewline
Raw Output & view raw output of R engine  \tabularnewline
Computing time & 3 seconds \tabularnewline
R Server & 'Gwilym Jenkins' @ 72.249.127.135 \tabularnewline
\hline
\end{tabular}
%Source: https://freestatistics.org/blog/index.php?pk=14360&T=0

[TABLE]
[ROW][C]Summary of compuational transaction[/C][/ROW]
[ROW][C]Raw Input[/C][C]view raw input (R code) [/C][/ROW]
[ROW][C]Raw Output[/C][C]view raw output of R engine [/C][/ROW]
[ROW][C]Computing time[/C][C]3 seconds[/C][/ROW]
[ROW][C]R Server[/C][C]'Gwilym Jenkins' @ 72.249.127.135[/C][/ROW]
[/TABLE]
Source: https://freestatistics.org/blog/index.php?pk=14360&T=0

Globally Unique Identifier (entire table): ba.freestatistics.org/blog/index.php?pk=14360&T=0

As an alternative you can also use a QR Code:  

The GUIDs for individual cells are displayed in the table below:

Summary of compuational transaction
Raw Inputview raw input (R code)
Raw Outputview raw output of R engine
Computing time3 seconds
R Server'Gwilym Jenkins' @ 72.249.127.135


Multiple Linear Regression - Estimated Regression Equation
Secpr[t] = + 76.9508311655516 + 0.0273171128015187Afzpr[t] + 12.3664224082476M1[t] + 27.0259492208726M2[t] + 27.3690912174461M3[t] + 25.7722913154589M4[t] + 24.8754300623079M5[t] + 13.6912581958045M6[t] + 13.3984779859362M7[t] + 26.7183798508353M8[t] + 16.1521944823323M9[t] + 21.9568778575105M10[t] + 24.3976771105950M11[t] + 0.171121815953736t + e[t]

\begin{tabular}{lllllllll}
\hline
Multiple Linear Regression - Estimated Regression Equation \tabularnewline
Secpr[t] =  +  76.9508311655516 +  0.0273171128015187Afzpr[t] +  12.3664224082476M1[t] +  27.0259492208726M2[t] +  27.3690912174461M3[t] +  25.7722913154589M4[t] +  24.8754300623079M5[t] +  13.6912581958045M6[t] +  13.3984779859362M7[t] +  26.7183798508353M8[t] +  16.1521944823323M9[t] +  21.9568778575105M10[t] +  24.3976771105950M11[t] +  0.171121815953736t  + e[t] \tabularnewline
\hline
\end{tabular}
%Source: https://freestatistics.org/blog/index.php?pk=14360&T=1

[TABLE]
[ROW][C]Multiple Linear Regression - Estimated Regression Equation[/C][/ROW]
[ROW][C]Secpr[t] =  +  76.9508311655516 +  0.0273171128015187Afzpr[t] +  12.3664224082476M1[t] +  27.0259492208726M2[t] +  27.3690912174461M3[t] +  25.7722913154589M4[t] +  24.8754300623079M5[t] +  13.6912581958045M6[t] +  13.3984779859362M7[t] +  26.7183798508353M8[t] +  16.1521944823323M9[t] +  21.9568778575105M10[t] +  24.3976771105950M11[t] +  0.171121815953736t  + e[t][/C][/ROW]
[/TABLE]
Source: https://freestatistics.org/blog/index.php?pk=14360&T=1

Globally Unique Identifier (entire table): ba.freestatistics.org/blog/index.php?pk=14360&T=1

As an alternative you can also use a QR Code:  

The GUIDs for individual cells are displayed in the table below:

Multiple Linear Regression - Estimated Regression Equation
Secpr[t] = + 76.9508311655516 + 0.0273171128015187Afzpr[t] + 12.3664224082476M1[t] + 27.0259492208726M2[t] + 27.3690912174461M3[t] + 25.7722913154589M4[t] + 24.8754300623079M5[t] + 13.6912581958045M6[t] + 13.3984779859362M7[t] + 26.7183798508353M8[t] + 16.1521944823323M9[t] + 21.9568778575105M10[t] + 24.3976771105950M11[t] + 0.171121815953736t + e[t]


Multiple Linear Regression - Ordinary Least Squares
VariableParameterS.D.T-STATH0: parameter = 02-tail p-value1-tail p-value
(Intercept)76.95083116555163.31803823.191700
Afzpr0.02731711280151870.025691.06340.2930550.146528
M112.36642240824762.5731914.80591.6e-058e-06
M227.02594922087262.69688810.021200
M327.36909121744612.68075710.209500
M425.77229131545892.6782799.622700
M524.87543006230793.2949877.549500
M613.69125819580452.7021845.06677e-063e-06
M713.39847798593622.7126344.93931e-055e-06
M826.71837985083532.66892410.010900
M916.15219448233232.6697056.050200
M1021.95687785751052.6680298.229600
M1124.39767711059502.7135738.99100
t0.1711218159537360.0348264.91361.1e-056e-06

\begin{tabular}{lllllllll}
\hline
Multiple Linear Regression - Ordinary Least Squares \tabularnewline
Variable & Parameter & S.D. & T-STATH0: parameter = 0 & 2-tail p-value & 1-tail p-value \tabularnewline
(Intercept) & 76.9508311655516 & 3.318038 & 23.1917 & 0 & 0 \tabularnewline
Afzpr & 0.0273171128015187 & 0.02569 & 1.0634 & 0.293055 & 0.146528 \tabularnewline
M1 & 12.3664224082476 & 2.573191 & 4.8059 & 1.6e-05 & 8e-06 \tabularnewline
M2 & 27.0259492208726 & 2.696888 & 10.0212 & 0 & 0 \tabularnewline
M3 & 27.3690912174461 & 2.680757 & 10.2095 & 0 & 0 \tabularnewline
M4 & 25.7722913154589 & 2.678279 & 9.6227 & 0 & 0 \tabularnewline
M5 & 24.8754300623079 & 3.294987 & 7.5495 & 0 & 0 \tabularnewline
M6 & 13.6912581958045 & 2.702184 & 5.0667 & 7e-06 & 3e-06 \tabularnewline
M7 & 13.3984779859362 & 2.712634 & 4.9393 & 1e-05 & 5e-06 \tabularnewline
M8 & 26.7183798508353 & 2.668924 & 10.0109 & 0 & 0 \tabularnewline
M9 & 16.1521944823323 & 2.669705 & 6.0502 & 0 & 0 \tabularnewline
M10 & 21.9568778575105 & 2.668029 & 8.2296 & 0 & 0 \tabularnewline
M11 & 24.3976771105950 & 2.713573 & 8.991 & 0 & 0 \tabularnewline
t & 0.171121815953736 & 0.034826 & 4.9136 & 1.1e-05 & 6e-06 \tabularnewline
\hline
\end{tabular}
%Source: https://freestatistics.org/blog/index.php?pk=14360&T=2

[TABLE]
[ROW][C]Multiple Linear Regression - Ordinary Least Squares[/C][/ROW]
[ROW][C]Variable[/C][C]Parameter[/C][C]S.D.[/C][C]T-STATH0: parameter = 0[/C][C]2-tail p-value[/C][C]1-tail p-value[/C][/ROW]
[ROW][C](Intercept)[/C][C]76.9508311655516[/C][C]3.318038[/C][C]23.1917[/C][C]0[/C][C]0[/C][/ROW]
[ROW][C]Afzpr[/C][C]0.0273171128015187[/C][C]0.02569[/C][C]1.0634[/C][C]0.293055[/C][C]0.146528[/C][/ROW]
[ROW][C]M1[/C][C]12.3664224082476[/C][C]2.573191[/C][C]4.8059[/C][C]1.6e-05[/C][C]8e-06[/C][/ROW]
[ROW][C]M2[/C][C]27.0259492208726[/C][C]2.696888[/C][C]10.0212[/C][C]0[/C][C]0[/C][/ROW]
[ROW][C]M3[/C][C]27.3690912174461[/C][C]2.680757[/C][C]10.2095[/C][C]0[/C][C]0[/C][/ROW]
[ROW][C]M4[/C][C]25.7722913154589[/C][C]2.678279[/C][C]9.6227[/C][C]0[/C][C]0[/C][/ROW]
[ROW][C]M5[/C][C]24.8754300623079[/C][C]3.294987[/C][C]7.5495[/C][C]0[/C][C]0[/C][/ROW]
[ROW][C]M6[/C][C]13.6912581958045[/C][C]2.702184[/C][C]5.0667[/C][C]7e-06[/C][C]3e-06[/C][/ROW]
[ROW][C]M7[/C][C]13.3984779859362[/C][C]2.712634[/C][C]4.9393[/C][C]1e-05[/C][C]5e-06[/C][/ROW]
[ROW][C]M8[/C][C]26.7183798508353[/C][C]2.668924[/C][C]10.0109[/C][C]0[/C][C]0[/C][/ROW]
[ROW][C]M9[/C][C]16.1521944823323[/C][C]2.669705[/C][C]6.0502[/C][C]0[/C][C]0[/C][/ROW]
[ROW][C]M10[/C][C]21.9568778575105[/C][C]2.668029[/C][C]8.2296[/C][C]0[/C][C]0[/C][/ROW]
[ROW][C]M11[/C][C]24.3976771105950[/C][C]2.713573[/C][C]8.991[/C][C]0[/C][C]0[/C][/ROW]
[ROW][C]t[/C][C]0.171121815953736[/C][C]0.034826[/C][C]4.9136[/C][C]1.1e-05[/C][C]6e-06[/C][/ROW]
[/TABLE]
Source: https://freestatistics.org/blog/index.php?pk=14360&T=2

Globally Unique Identifier (entire table): ba.freestatistics.org/blog/index.php?pk=14360&T=2

As an alternative you can also use a QR Code:  

The GUIDs for individual cells are displayed in the table below:

Multiple Linear Regression - Ordinary Least Squares
VariableParameterS.D.T-STATH0: parameter = 02-tail p-value1-tail p-value
(Intercept)76.95083116555163.31803823.191700
Afzpr0.02731711280151870.025691.06340.2930550.146528
M112.36642240824762.5731914.80591.6e-058e-06
M227.02594922087262.69688810.021200
M327.36909121744612.68075710.209500
M425.77229131545892.6782799.622700
M524.87543006230793.2949877.549500
M613.69125819580452.7021845.06677e-063e-06
M713.39847798593622.7126344.93931e-055e-06
M826.71837985083532.66892410.010900
M916.15219448233232.6697056.050200
M1021.95687785751052.6680298.229600
M1124.39767711059502.7135738.99100
t0.1711218159537360.0348264.91361.1e-056e-06


Multiple Linear Regression - Regression Statistics
Multiple R0.917448763333296
R-squared0.841712233341794
Adjusted R-squared0.797930510649099
F-TEST (value)19.2251967618951
F-TEST (DF numerator)13
F-TEST (DF denominator)47
p-value1.50990331349021e-14
Multiple Linear Regression - Residual Statistics
Residual Standard Deviation4.21534951973288
Sum Squared Residuals835.151063955076

\begin{tabular}{lllllllll}
\hline
Multiple Linear Regression - Regression Statistics \tabularnewline
Multiple R & 0.917448763333296 \tabularnewline
R-squared & 0.841712233341794 \tabularnewline
Adjusted R-squared & 0.797930510649099 \tabularnewline
F-TEST (value) & 19.2251967618951 \tabularnewline
F-TEST (DF numerator) & 13 \tabularnewline
F-TEST (DF denominator) & 47 \tabularnewline
p-value & 1.50990331349021e-14 \tabularnewline
Multiple Linear Regression - Residual Statistics \tabularnewline
Residual Standard Deviation & 4.21534951973288 \tabularnewline
Sum Squared Residuals & 835.151063955076 \tabularnewline
\hline
\end{tabular}
%Source: https://freestatistics.org/blog/index.php?pk=14360&T=3

[TABLE]
[ROW][C]Multiple Linear Regression - Regression Statistics[/C][/ROW]
[ROW][C]Multiple R[/C][C]0.917448763333296[/C][/ROW]
[ROW][C]R-squared[/C][C]0.841712233341794[/C][/ROW]
[ROW][C]Adjusted R-squared[/C][C]0.797930510649099[/C][/ROW]
[ROW][C]F-TEST (value)[/C][C]19.2251967618951[/C][/ROW]
[ROW][C]F-TEST (DF numerator)[/C][C]13[/C][/ROW]
[ROW][C]F-TEST (DF denominator)[/C][C]47[/C][/ROW]
[ROW][C]p-value[/C][C]1.50990331349021e-14[/C][/ROW]
[ROW][C]Multiple Linear Regression - Residual Statistics[/C][/ROW]
[ROW][C]Residual Standard Deviation[/C][C]4.21534951973288[/C][/ROW]
[ROW][C]Sum Squared Residuals[/C][C]835.151063955076[/C][/ROW]
[/TABLE]
Source: https://freestatistics.org/blog/index.php?pk=14360&T=3

Globally Unique Identifier (entire table): ba.freestatistics.org/blog/index.php?pk=14360&T=3

As an alternative you can also use a QR Code:  

The GUIDs for individual cells are displayed in the table below:

Multiple Linear Regression - Regression Statistics
Multiple R0.917448763333296
R-squared0.841712233341794
Adjusted R-squared0.797930510649099
F-TEST (value)19.2251967618951
F-TEST (DF numerator)13
F-TEST (DF denominator)47
p-value1.50990331349021e-14
Multiple Linear Regression - Residual Statistics
Residual Standard Deviation4.21534951973288
Sum Squared Residuals835.151063955076


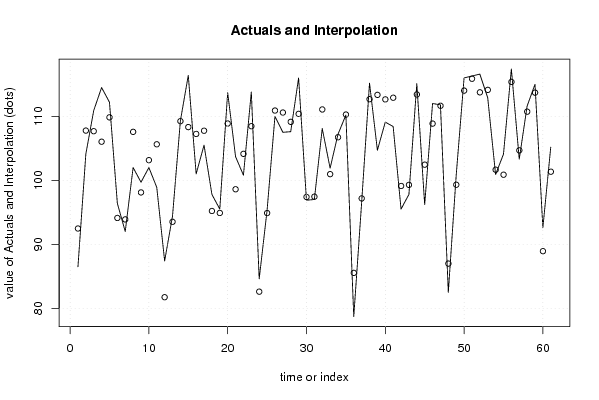
Multiple Linear Regression - Actuals, Interpolation, and Residuals
Time or IndexActualsInterpolationForecastResidualsPrediction Error
186.592.471404107679-5.97140410767898
2104.1107.769175365163-3.6691753651635
3110.9107.6742675622173.22573243778312
4114.5106.0300525737718.46994742622872
5112.2109.8389538616262.36104613837392
696.494.12189698665482.27810301334516
79293.8964335640945-1.89643356409454
8102107.570481900718-5.57048190071753
999.798.10693189471.59306810529995
10102103.153955250580-1.15395525058041
1198.9105.629290755611-6.72929075561101
1287.481.73600423714835.66399576285171
1394.493.51959614802770.880403851972294
14109.3109.2380509426560.0619490573441767
15116.4108.3154346218238.08456537817682
16101107.244879002210-6.2448790022095
17105.5107.745677929800-2.24567792980042
1897.895.2083329849262.59166701507407
1995.594.8981865126810.601813487319091
20113.7108.8727230901214.8272769098794
21103.798.60331825645835.09668174354169
22100.8104.136586220206-3.33658622020570
23113.8108.4558268393395.34417316066118
2484.682.60390333300721.99609666699276
2595.394.88466669687430.415333303125725
26110110.900878021039-0.900878021038933
27107.5110.590165026960-3.09016502696032
28107.6109.134438116845-1.53443811684522
29116110.3837259351985.61627406480226
3096.997.3983803403784-0.498380340378351
319797.443356334553-0.443356334553083
32108.1111.070965579413-2.97096557941350
33101.9100.9627317112800.937268288719855
34107.2106.7281951338400.471804866159551
35110.2110.274361460691-0.0743614606905861
3678.785.5397078679411-6.83970786794111
3796.597.1730556584122-0.673055658412168
38115.2112.6784369731882.52156302681157
39104.7113.351140039964-8.65114003996448
40109.1112.643902020611-3.54390202061101
41108.4112.901578644268-4.50157864426839
4295.599.1158416443645-3.61584164436451
4397.899.2864763574262-1.48647635742622
44115.1113.4112570552741.68874294472572
4596.2102.445265845173-6.24526584517324
46112108.8581448411303.14185515887046
47111.8111.6448954320970.155104567902546
4882.586.9894614664724-4.48946146647238
49100.899.30573707698141.49426292301859
50116114.0134586979531.98654130204668
51116.3115.8689927490350.431007250964857
52116.6113.7467282865632.85327171343702
53112.9114.130063629107-1.23006362910736
54100.9101.655548043676-0.75554804367637
55104.1100.8755472312453.22445276875476
56117.4115.3745723744742.02542762552591
57103.3104.681752292388-1.38175229238826
58111.6110.7231185542440.876881445756102
59115113.6956255122621.30437448773787
6092.688.9309230954313.669076904569
61105.2101.3455403120253.85445968797453

\begin{tabular}{lllllllll}
\hline
Multiple Linear Regression - Actuals, Interpolation, and Residuals \tabularnewline
Time or Index & Actuals & InterpolationForecast & ResidualsPrediction Error \tabularnewline
1 & 86.5 & 92.471404107679 & -5.97140410767898 \tabularnewline
2 & 104.1 & 107.769175365163 & -3.6691753651635 \tabularnewline
3 & 110.9 & 107.674267562217 & 3.22573243778312 \tabularnewline
4 & 114.5 & 106.030052573771 & 8.46994742622872 \tabularnewline
5 & 112.2 & 109.838953861626 & 2.36104613837392 \tabularnewline
6 & 96.4 & 94.1218969866548 & 2.27810301334516 \tabularnewline
7 & 92 & 93.8964335640945 & -1.89643356409454 \tabularnewline
8 & 102 & 107.570481900718 & -5.57048190071753 \tabularnewline
9 & 99.7 & 98.1069318947 & 1.59306810529995 \tabularnewline
10 & 102 & 103.153955250580 & -1.15395525058041 \tabularnewline
11 & 98.9 & 105.629290755611 & -6.72929075561101 \tabularnewline
12 & 87.4 & 81.7360042371483 & 5.66399576285171 \tabularnewline
13 & 94.4 & 93.5195961480277 & 0.880403851972294 \tabularnewline
14 & 109.3 & 109.238050942656 & 0.0619490573441767 \tabularnewline
15 & 116.4 & 108.315434621823 & 8.08456537817682 \tabularnewline
16 & 101 & 107.244879002210 & -6.2448790022095 \tabularnewline
17 & 105.5 & 107.745677929800 & -2.24567792980042 \tabularnewline
18 & 97.8 & 95.208332984926 & 2.59166701507407 \tabularnewline
19 & 95.5 & 94.898186512681 & 0.601813487319091 \tabularnewline
20 & 113.7 & 108.872723090121 & 4.8272769098794 \tabularnewline
21 & 103.7 & 98.6033182564583 & 5.09668174354169 \tabularnewline
22 & 100.8 & 104.136586220206 & -3.33658622020570 \tabularnewline
23 & 113.8 & 108.455826839339 & 5.34417316066118 \tabularnewline
24 & 84.6 & 82.6039033330072 & 1.99609666699276 \tabularnewline
25 & 95.3 & 94.8846666968743 & 0.415333303125725 \tabularnewline
26 & 110 & 110.900878021039 & -0.900878021038933 \tabularnewline
27 & 107.5 & 110.590165026960 & -3.09016502696032 \tabularnewline
28 & 107.6 & 109.134438116845 & -1.53443811684522 \tabularnewline
29 & 116 & 110.383725935198 & 5.61627406480226 \tabularnewline
30 & 96.9 & 97.3983803403784 & -0.498380340378351 \tabularnewline
31 & 97 & 97.443356334553 & -0.443356334553083 \tabularnewline
32 & 108.1 & 111.070965579413 & -2.97096557941350 \tabularnewline
33 & 101.9 & 100.962731711280 & 0.937268288719855 \tabularnewline
34 & 107.2 & 106.728195133840 & 0.471804866159551 \tabularnewline
35 & 110.2 & 110.274361460691 & -0.0743614606905861 \tabularnewline
36 & 78.7 & 85.5397078679411 & -6.83970786794111 \tabularnewline
37 & 96.5 & 97.1730556584122 & -0.673055658412168 \tabularnewline
38 & 115.2 & 112.678436973188 & 2.52156302681157 \tabularnewline
39 & 104.7 & 113.351140039964 & -8.65114003996448 \tabularnewline
40 & 109.1 & 112.643902020611 & -3.54390202061101 \tabularnewline
41 & 108.4 & 112.901578644268 & -4.50157864426839 \tabularnewline
42 & 95.5 & 99.1158416443645 & -3.61584164436451 \tabularnewline
43 & 97.8 & 99.2864763574262 & -1.48647635742622 \tabularnewline
44 & 115.1 & 113.411257055274 & 1.68874294472572 \tabularnewline
45 & 96.2 & 102.445265845173 & -6.24526584517324 \tabularnewline
46 & 112 & 108.858144841130 & 3.14185515887046 \tabularnewline
47 & 111.8 & 111.644895432097 & 0.155104567902546 \tabularnewline
48 & 82.5 & 86.9894614664724 & -4.48946146647238 \tabularnewline
49 & 100.8 & 99.3057370769814 & 1.49426292301859 \tabularnewline
50 & 116 & 114.013458697953 & 1.98654130204668 \tabularnewline
51 & 116.3 & 115.868992749035 & 0.431007250964857 \tabularnewline
52 & 116.6 & 113.746728286563 & 2.85327171343702 \tabularnewline
53 & 112.9 & 114.130063629107 & -1.23006362910736 \tabularnewline
54 & 100.9 & 101.655548043676 & -0.75554804367637 \tabularnewline
55 & 104.1 & 100.875547231245 & 3.22445276875476 \tabularnewline
56 & 117.4 & 115.374572374474 & 2.02542762552591 \tabularnewline
57 & 103.3 & 104.681752292388 & -1.38175229238826 \tabularnewline
58 & 111.6 & 110.723118554244 & 0.876881445756102 \tabularnewline
59 & 115 & 113.695625512262 & 1.30437448773787 \tabularnewline
60 & 92.6 & 88.930923095431 & 3.669076904569 \tabularnewline
61 & 105.2 & 101.345540312025 & 3.85445968797453 \tabularnewline
\hline
\end{tabular}
%Source: https://freestatistics.org/blog/index.php?pk=14360&T=4

[TABLE]
[ROW][C]Multiple Linear Regression - Actuals, Interpolation, and Residuals[/C][/ROW]
[ROW][C]Time or Index[/C][C]Actuals[/C][C]InterpolationForecast[/C][C]ResidualsPrediction Error[/C][/ROW]
[ROW][C]1[/C][C]86.5[/C][C]92.471404107679[/C][C]-5.97140410767898[/C][/ROW]
[ROW][C]2[/C][C]104.1[/C][C]107.769175365163[/C][C]-3.6691753651635[/C][/ROW]
[ROW][C]3[/C][C]110.9[/C][C]107.674267562217[/C][C]3.22573243778312[/C][/ROW]
[ROW][C]4[/C][C]114.5[/C][C]106.030052573771[/C][C]8.46994742622872[/C][/ROW]
[ROW][C]5[/C][C]112.2[/C][C]109.838953861626[/C][C]2.36104613837392[/C][/ROW]
[ROW][C]6[/C][C]96.4[/C][C]94.1218969866548[/C][C]2.27810301334516[/C][/ROW]
[ROW][C]7[/C][C]92[/C][C]93.8964335640945[/C][C]-1.89643356409454[/C][/ROW]
[ROW][C]8[/C][C]102[/C][C]107.570481900718[/C][C]-5.57048190071753[/C][/ROW]
[ROW][C]9[/C][C]99.7[/C][C]98.1069318947[/C][C]1.59306810529995[/C][/ROW]
[ROW][C]10[/C][C]102[/C][C]103.153955250580[/C][C]-1.15395525058041[/C][/ROW]
[ROW][C]11[/C][C]98.9[/C][C]105.629290755611[/C][C]-6.72929075561101[/C][/ROW]
[ROW][C]12[/C][C]87.4[/C][C]81.7360042371483[/C][C]5.66399576285171[/C][/ROW]
[ROW][C]13[/C][C]94.4[/C][C]93.5195961480277[/C][C]0.880403851972294[/C][/ROW]
[ROW][C]14[/C][C]109.3[/C][C]109.238050942656[/C][C]0.0619490573441767[/C][/ROW]
[ROW][C]15[/C][C]116.4[/C][C]108.315434621823[/C][C]8.08456537817682[/C][/ROW]
[ROW][C]16[/C][C]101[/C][C]107.244879002210[/C][C]-6.2448790022095[/C][/ROW]
[ROW][C]17[/C][C]105.5[/C][C]107.745677929800[/C][C]-2.24567792980042[/C][/ROW]
[ROW][C]18[/C][C]97.8[/C][C]95.208332984926[/C][C]2.59166701507407[/C][/ROW]
[ROW][C]19[/C][C]95.5[/C][C]94.898186512681[/C][C]0.601813487319091[/C][/ROW]
[ROW][C]20[/C][C]113.7[/C][C]108.872723090121[/C][C]4.8272769098794[/C][/ROW]
[ROW][C]21[/C][C]103.7[/C][C]98.6033182564583[/C][C]5.09668174354169[/C][/ROW]
[ROW][C]22[/C][C]100.8[/C][C]104.136586220206[/C][C]-3.33658622020570[/C][/ROW]
[ROW][C]23[/C][C]113.8[/C][C]108.455826839339[/C][C]5.34417316066118[/C][/ROW]
[ROW][C]24[/C][C]84.6[/C][C]82.6039033330072[/C][C]1.99609666699276[/C][/ROW]
[ROW][C]25[/C][C]95.3[/C][C]94.8846666968743[/C][C]0.415333303125725[/C][/ROW]
[ROW][C]26[/C][C]110[/C][C]110.900878021039[/C][C]-0.900878021038933[/C][/ROW]
[ROW][C]27[/C][C]107.5[/C][C]110.590165026960[/C][C]-3.09016502696032[/C][/ROW]
[ROW][C]28[/C][C]107.6[/C][C]109.134438116845[/C][C]-1.53443811684522[/C][/ROW]
[ROW][C]29[/C][C]116[/C][C]110.383725935198[/C][C]5.61627406480226[/C][/ROW]
[ROW][C]30[/C][C]96.9[/C][C]97.3983803403784[/C][C]-0.498380340378351[/C][/ROW]
[ROW][C]31[/C][C]97[/C][C]97.443356334553[/C][C]-0.443356334553083[/C][/ROW]
[ROW][C]32[/C][C]108.1[/C][C]111.070965579413[/C][C]-2.97096557941350[/C][/ROW]
[ROW][C]33[/C][C]101.9[/C][C]100.962731711280[/C][C]0.937268288719855[/C][/ROW]
[ROW][C]34[/C][C]107.2[/C][C]106.728195133840[/C][C]0.471804866159551[/C][/ROW]
[ROW][C]35[/C][C]110.2[/C][C]110.274361460691[/C][C]-0.0743614606905861[/C][/ROW]
[ROW][C]36[/C][C]78.7[/C][C]85.5397078679411[/C][C]-6.83970786794111[/C][/ROW]
[ROW][C]37[/C][C]96.5[/C][C]97.1730556584122[/C][C]-0.673055658412168[/C][/ROW]
[ROW][C]38[/C][C]115.2[/C][C]112.678436973188[/C][C]2.52156302681157[/C][/ROW]
[ROW][C]39[/C][C]104.7[/C][C]113.351140039964[/C][C]-8.65114003996448[/C][/ROW]
[ROW][C]40[/C][C]109.1[/C][C]112.643902020611[/C][C]-3.54390202061101[/C][/ROW]
[ROW][C]41[/C][C]108.4[/C][C]112.901578644268[/C][C]-4.50157864426839[/C][/ROW]
[ROW][C]42[/C][C]95.5[/C][C]99.1158416443645[/C][C]-3.61584164436451[/C][/ROW]
[ROW][C]43[/C][C]97.8[/C][C]99.2864763574262[/C][C]-1.48647635742622[/C][/ROW]
[ROW][C]44[/C][C]115.1[/C][C]113.411257055274[/C][C]1.68874294472572[/C][/ROW]
[ROW][C]45[/C][C]96.2[/C][C]102.445265845173[/C][C]-6.24526584517324[/C][/ROW]
[ROW][C]46[/C][C]112[/C][C]108.858144841130[/C][C]3.14185515887046[/C][/ROW]
[ROW][C]47[/C][C]111.8[/C][C]111.644895432097[/C][C]0.155104567902546[/C][/ROW]
[ROW][C]48[/C][C]82.5[/C][C]86.9894614664724[/C][C]-4.48946146647238[/C][/ROW]
[ROW][C]49[/C][C]100.8[/C][C]99.3057370769814[/C][C]1.49426292301859[/C][/ROW]
[ROW][C]50[/C][C]116[/C][C]114.013458697953[/C][C]1.98654130204668[/C][/ROW]
[ROW][C]51[/C][C]116.3[/C][C]115.868992749035[/C][C]0.431007250964857[/C][/ROW]
[ROW][C]52[/C][C]116.6[/C][C]113.746728286563[/C][C]2.85327171343702[/C][/ROW]
[ROW][C]53[/C][C]112.9[/C][C]114.130063629107[/C][C]-1.23006362910736[/C][/ROW]
[ROW][C]54[/C][C]100.9[/C][C]101.655548043676[/C][C]-0.75554804367637[/C][/ROW]
[ROW][C]55[/C][C]104.1[/C][C]100.875547231245[/C][C]3.22445276875476[/C][/ROW]
[ROW][C]56[/C][C]117.4[/C][C]115.374572374474[/C][C]2.02542762552591[/C][/ROW]
[ROW][C]57[/C][C]103.3[/C][C]104.681752292388[/C][C]-1.38175229238826[/C][/ROW]
[ROW][C]58[/C][C]111.6[/C][C]110.723118554244[/C][C]0.876881445756102[/C][/ROW]
[ROW][C]59[/C][C]115[/C][C]113.695625512262[/C][C]1.30437448773787[/C][/ROW]
[ROW][C]60[/C][C]92.6[/C][C]88.930923095431[/C][C]3.669076904569[/C][/ROW]
[ROW][C]61[/C][C]105.2[/C][C]101.345540312025[/C][C]3.85445968797453[/C][/ROW]
[/TABLE]
Source: https://freestatistics.org/blog/index.php?pk=14360&T=4

Globally Unique Identifier (entire table): ba.freestatistics.org/blog/index.php?pk=14360&T=4

As an alternative you can also use a QR Code:  

The GUIDs for individual cells are displayed in the table below:

Multiple Linear Regression - Actuals, Interpolation, and Residuals
Time or IndexActualsInterpolationForecastResidualsPrediction Error
186.592.471404107679-5.97140410767898
2104.1107.769175365163-3.6691753651635
3110.9107.6742675622173.22573243778312
4114.5106.0300525737718.46994742622872
5112.2109.8389538616262.36104613837392
696.494.12189698665482.27810301334516
79293.8964335640945-1.89643356409454
8102107.570481900718-5.57048190071753
999.798.10693189471.59306810529995
10102103.153955250580-1.15395525058041
1198.9105.629290755611-6.72929075561101
1287.481.73600423714835.66399576285171
1394.493.51959614802770.880403851972294
14109.3109.2380509426560.0619490573441767
15116.4108.3154346218238.08456537817682
16101107.244879002210-6.2448790022095
17105.5107.745677929800-2.24567792980042
1897.895.2083329849262.59166701507407
1995.594.8981865126810.601813487319091
20113.7108.8727230901214.8272769098794
21103.798.60331825645835.09668174354169
22100.8104.136586220206-3.33658622020570
23113.8108.4558268393395.34417316066118
2484.682.60390333300721.99609666699276
2595.394.88466669687430.415333303125725
26110110.900878021039-0.900878021038933
27107.5110.590165026960-3.09016502696032
28107.6109.134438116845-1.53443811684522
29116110.3837259351985.61627406480226
3096.997.3983803403784-0.498380340378351
319797.443356334553-0.443356334553083
32108.1111.070965579413-2.97096557941350
33101.9100.9627317112800.937268288719855
34107.2106.7281951338400.471804866159551
35110.2110.274361460691-0.0743614606905861
3678.785.5397078679411-6.83970786794111
3796.597.1730556584122-0.673055658412168
38115.2112.6784369731882.52156302681157
39104.7113.351140039964-8.65114003996448
40109.1112.643902020611-3.54390202061101
41108.4112.901578644268-4.50157864426839
4295.599.1158416443645-3.61584164436451
4397.899.2864763574262-1.48647635742622
44115.1113.4112570552741.68874294472572
4596.2102.445265845173-6.24526584517324
46112108.8581448411303.14185515887046
47111.8111.6448954320970.155104567902546
4882.586.9894614664724-4.48946146647238
49100.899.30573707698141.49426292301859
50116114.0134586979531.98654130204668
51116.3115.8689927490350.431007250964857
52116.6113.7467282865632.85327171343702
53112.9114.130063629107-1.23006362910736
54100.9101.655548043676-0.75554804367637
55104.1100.8755472312453.22445276875476
56117.4115.3745723744742.02542762552591
57103.3104.681752292388-1.38175229238826
58111.6110.7231185542440.876881445756102
59115113.6956255122621.30437448773787
6092.688.9309230954313.669076904569
61105.2101.3455403120253.85445968797453


Parameters (Session):
par1 = 1 ; par2 = Do not include Seasonal Dummies ; par3 = No Linear Trend ;
Parameters (R input):
par1 = 1 ; par2 = Include Monthly Dummies ; par3 = Linear Trend ;
R code (references can be found in the software module):
library(lattice)
par1 <- as.numeric(par1)
x <- t(y)
k <- length(x[1,])
n <- length(x[,1])
x1 <- cbind(x[,par1], x[,1:k!=par1])
mycolnames <- c(colnames(x)[par1], colnames(x)[1:k!=par1])
colnames(x1) <- mycolnames #colnames(x)[par1]
x <- x1
if (par3 == 'First Differences'){
x2 <- array(0, dim=c(n-1,k), dimnames=list(1:(n-1), paste('(1-B)',colnames(x),sep='')))
for (i in 1:n-1) {
for (j in 1:k) {
x2[i,j] <- x[i+1,j] - x[i,j]
}
}
x <- x2
}
if (par2 == 'Include Monthly Dummies'){
x2 <- array(0, dim=c(n,11), dimnames=list(1:n, paste('M', seq(1:11), sep ='')))
for (i in 1:11){
x2[seq(i,n,12),i] <- 1
}
x <- cbind(x, x2)
}
if (par2 == 'Include Quarterly Dummies'){
x2 <- array(0, dim=c(n,3), dimnames=list(1:n, paste('Q', seq(1:3), sep ='')))
for (i in 1:3){
x2[seq(i,n,4),i] <- 1
}
x <- cbind(x, x2)
}
k <- length(x[1,])
if (par3 == 'Linear Trend'){
x <- cbind(x, c(1:n))
colnames(x)[k+1] <- 't'
}
x
k <- length(x[1,])
df <- as.data.frame(x)
(mylm <- lm(df))
(mysum <- summary(mylm))
bitmap(file='test0.png')
plot(x[,1], type='l', main='Actuals and Interpolation', ylab='value of Actuals and Interpolation (dots)', xlab='time or index')
points(x[,1]-mysum$resid)
grid()
dev.off()
bitmap(file='test1.png')
plot(mysum$resid, type='b', pch=19, main='Residuals', ylab='value of Residuals', xlab='time or index')
grid()
dev.off()
bitmap(file='test2.png')
hist(mysum$resid, main='Residual Histogram', xlab='values of Residuals')
grid()
dev.off()
bitmap(file='test3.png')
densityplot(~mysum$resid,col='black',main='Residual Density Plot', xlab='values of Residuals')
dev.off()
bitmap(file='test4.png')
qqnorm(mysum$resid, main='Residual Normal Q-Q Plot')
grid()
dev.off()
(myerror <- as.ts(mysum$resid))
bitmap(file='test5.png')
dum <- cbind(lag(myerror,k=1),myerror)
dum
dum1 <- dum[2:length(myerror),]
dum1
z <- as.data.frame(dum1)
z
plot(z,main=paste('Residual Lag plot, lowess, and regression line'), ylab='values of Residuals', xlab='lagged values of Residuals')
lines(lowess(z))
abline(lm(z))
grid()
dev.off()
bitmap(file='test6.png')
acf(mysum$resid, lag.max=length(mysum$resid)/2, main='Residual Autocorrelation Function')
grid()
dev.off()
bitmap(file='test7.png')
pacf(mysum$resid, lag.max=length(mysum$resid)/2, main='Residual Partial Autocorrelation Function')
grid()
dev.off()
bitmap(file='test8.png')
opar <- par(mfrow = c(2,2), oma = c(0, 0, 1.1, 0))
plot(mylm, las = 1, sub='Residual Diagnostics')
par(opar)
dev.off()
load(file='createtable')
a<-table.start()
a<-table.row.start(a)
a<-table.element(a, 'Multiple Linear Regression - Estimated Regression Equation', 1, TRUE)
a<-table.row.end(a)
myeq <- colnames(x)[1]
myeq <- paste(myeq, '[t] = ', sep='')
for (i in 1:k){
if (mysum$coefficients[i,1] > 0) myeq <- paste(myeq, '+', '')
myeq <- paste(myeq, mysum$coefficients[i,1], sep=' ')
if (rownames(mysum$coefficients)[i] != '(Intercept)') {
myeq <- paste(myeq, rownames(mysum$coefficients)[i], sep='')
if (rownames(mysum$coefficients)[i] != 't') myeq <- paste(myeq, '[t]', sep='')
}
}
myeq <- paste(myeq, ' + e[t]')
a<-table.row.start(a)
a<-table.element(a, myeq)
a<-table.row.end(a)
a<-table.end(a)
table.save(a,file='mytable1.tab')
a<-table.start()
a<-table.row.start(a)
a<-table.element(a,hyperlink('ols1.htm','Multiple Linear Regression - Ordinary Least Squares',''), 6, TRUE)
a<-table.row.end(a)
a<-table.row.start(a)
a<-table.element(a,'Variable',header=TRUE)
a<-table.element(a,'Parameter',header=TRUE)
a<-table.element(a,'S.D.',header=TRUE)
a<-table.element(a,'T-STAT
H0: parameter = 0',header=TRUE)
a<-table.element(a,'2-tail p-value',header=TRUE)
a<-table.element(a,'1-tail p-value',header=TRUE)
a<-table.row.end(a)
for (i in 1:k){
a<-table.row.start(a)
a<-table.element(a,rownames(mysum$coefficients)[i],header=TRUE)
a<-table.element(a,mysum$coefficients[i,1])
a<-table.element(a, round(mysum$coefficients[i,2],6))
a<-table.element(a, round(mysum$coefficients[i,3],4))
a<-table.element(a, round(mysum$coefficients[i,4],6))
a<-table.element(a, round(mysum$coefficients[i,4]/2,6))
a<-table.row.end(a)
}
a<-table.end(a)
table.save(a,file='mytable2.tab')
a<-table.start()
a<-table.row.start(a)
a<-table.element(a, 'Multiple Linear Regression - Regression Statistics', 2, TRUE)
a<-table.row.end(a)
a<-table.row.start(a)
a<-table.element(a, 'Multiple R',1,TRUE)
a<-table.element(a, sqrt(mysum$r.squared))
a<-table.row.end(a)
a<-table.row.start(a)
a<-table.element(a, 'R-squared',1,TRUE)
a<-table.element(a, mysum$r.squared)
a<-table.row.end(a)
a<-table.row.start(a)
a<-table.element(a, 'Adjusted R-squared',1,TRUE)
a<-table.element(a, mysum$adj.r.squared)
a<-table.row.end(a)
a<-table.row.start(a)
a<-table.element(a, 'F-TEST (value)',1,TRUE)
a<-table.element(a, mysum$fstatistic[1])
a<-table.row.end(a)
a<-table.row.start(a)
a<-table.element(a, 'F-TEST (DF numerator)',1,TRUE)
a<-table.element(a, mysum$fstatistic[2])
a<-table.row.end(a)
a<-table.row.start(a)
a<-table.element(a, 'F-TEST (DF denominator)',1,TRUE)
a<-table.element(a, mysum$fstatistic[3])
a<-table.row.end(a)
a<-table.row.start(a)
a<-table.element(a, 'p-value',1,TRUE)
a<-table.element(a, 1-pf(mysum$fstatistic[1],mysum$fstatistic[2],mysum$fstatistic[3]))
a<-table.row.end(a)
a<-table.row.start(a)
a<-table.element(a, 'Multiple Linear Regression - Residual Statistics', 2, TRUE)
a<-table.row.end(a)
a<-table.row.start(a)
a<-table.element(a, 'Residual Standard Deviation',1,TRUE)
a<-table.element(a, mysum$sigma)
a<-table.row.end(a)
a<-table.row.start(a)
a<-table.element(a, 'Sum Squared Residuals',1,TRUE)
a<-table.element(a, sum(myerror*myerror))
a<-table.row.end(a)
a<-table.end(a)
table.save(a,file='mytable3.tab')
a<-table.start()
a<-table.row.start(a)
a<-table.element(a, 'Multiple Linear Regression - Actuals, Interpolation, and Residuals', 4, TRUE)
a<-table.row.end(a)
a<-table.row.start(a)
a<-table.element(a, 'Time or Index', 1, TRUE)
a<-table.element(a, 'Actuals', 1, TRUE)
a<-table.element(a, 'Interpolation
Forecast', 1, TRUE)
a<-table.element(a, 'Residuals
Prediction Error', 1, TRUE)
a<-table.row.end(a)
for (i in 1:n) {
a<-table.row.start(a)
a<-table.element(a,i, 1, TRUE)
a<-table.element(a,x[i])
a<-table.element(a,x[i]-mysum$resid[i])
a<-table.element(a,mysum$resid[i])
a<-table.row.end(a)
}
a<-table.end(a)
table.save(a,file='mytable4.tab')