Free Statistics
of Irreproducible Research!
Description of Statistical Computation | |||||||||||||||||||||||||||||||||||||||||||||||||||||
|---|---|---|---|---|---|---|---|---|---|---|---|---|---|---|---|---|---|---|---|---|---|---|---|---|---|---|---|---|---|---|---|---|---|---|---|---|---|---|---|---|---|---|---|---|---|---|---|---|---|---|---|---|---|
| Author's title | |||||||||||||||||||||||||||||||||||||||||||||||||||||
| Author | *Unverified author* | ||||||||||||||||||||||||||||||||||||||||||||||||||||
| R Software Module | rwasp_edauni.wasp | ||||||||||||||||||||||||||||||||||||||||||||||||||||
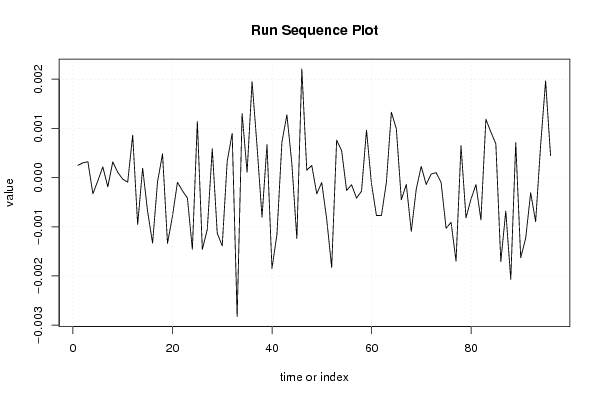
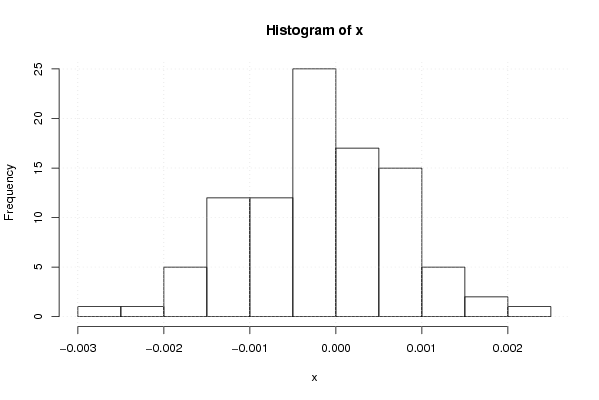
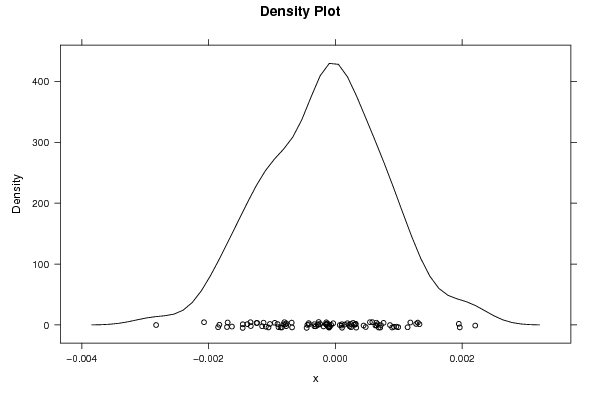
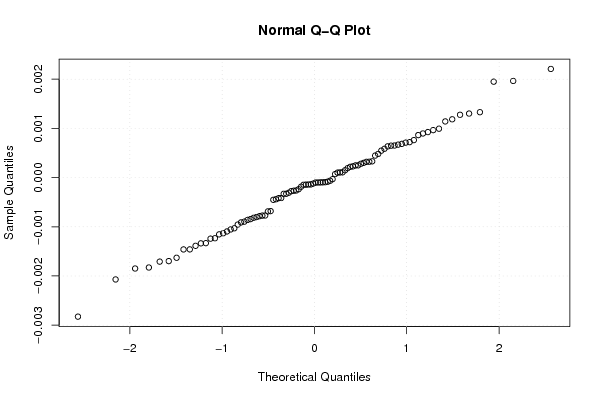
| Title produced by software | Univariate Explorative Data Analysis | ||||||||||||||||||||||||||||||||||||||||||||||||||||
| Date of computation | Thu, 13 Dec 2007 07:29:26 -0700 | ||||||||||||||||||||||||||||||||||||||||||||||||||||
| Cite this page as follows | Statistical Computations at FreeStatistics.org, Office for Research Development and Education, URL https://freestatistics.org/blog/index.php?v=date/2007/Dec/13/t1197555253epevqs2s5wuyxih.htm/, Retrieved Sun, 05 May 2024 16:48:22 +0000 | ||||||||||||||||||||||||||||||||||||||||||||||||||||
| Statistical Computations at FreeStatistics.org, Office for Research Development and Education, URL https://freestatistics.org/blog/index.php?pk=3566, Retrieved Sun, 05 May 2024 16:48:22 +0000 | |||||||||||||||||||||||||||||||||||||||||||||||||||||
| QR Codes: | |||||||||||||||||||||||||||||||||||||||||||||||||||||
|
| |||||||||||||||||||||||||||||||||||||||||||||||||||||
| Original text written by user: | |||||||||||||||||||||||||||||||||||||||||||||||||||||
| IsPrivate? | No (this computation is public) | ||||||||||||||||||||||||||||||||||||||||||||||||||||
| User-defined keywords | |||||||||||||||||||||||||||||||||||||||||||||||||||||
| Estimated Impact | 215 | ||||||||||||||||||||||||||||||||||||||||||||||||||||
Tree of Dependent Computations | |||||||||||||||||||||||||||||||||||||||||||||||||||||
| Family? (F = Feedback message, R = changed R code, M = changed R Module, P = changed Parameters, D = changed Data) | |||||||||||||||||||||||||||||||||||||||||||||||||||||
| - [Central Tendency] [Paper_EDA_output1] [2007-12-13 08:57:44] [e44956fac49704be9081ff9a6fb8481a] - RMPD [Univariate Explorative Data Analysis] [Paper_EDAres_outp...] [2007-12-13 14:29:26] [d41d8cd98f00b204e9800998ecf8427e] [Current] | |||||||||||||||||||||||||||||||||||||||||||||||||||||
| Feedback Forum | |||||||||||||||||||||||||||||||||||||||||||||||||||||
Post a new message | |||||||||||||||||||||||||||||||||||||||||||||||||||||
Dataset | |||||||||||||||||||||||||||||||||||||||||||||||||||||
| Dataseries X: | |||||||||||||||||||||||||||||||||||||||||||||||||||||
0.000249254412317267 0.000299603588409276 0.000322518965091164 -0.000329538636649367 -6.43325994869136e-05 0.000218734547908577 -0.000186123790106601 0.000320044464404368 0.000105079817925291 -3.21375723064676e-05 -9.31379372201002e-05 0.000863880329915967 -0.000955068293604838 0.000191654585176615 -0.000687217159304088 -0.00133295077536133 -8.40818637339591e-05 0.000480643586810492 -0.00133724173345948 -0.00078463864413933 -9.63012198662017e-05 -0.000267289029594886 -0.000415973064666258 -0.00145962546732839 0.00114159591731011 -0.00146064163655782 -0.00105351430012057 0.000585759739068242 -0.00113140931418457 -0.00138720915811827 0.000330704048772557 0.00089730707501226 -0.00282718491905784 0.00130177229774819 0.000106725469179531 0.00194958872561832 0.000635002216373137 -0.000802593879913022 0.000669740048378942 -0.00184856803744929 -0.00115402862422859 0.000720565693177494 0.00127635646932789 0.000280808847524822 -0.00124166740902709 0.00220850912079990 0.00014951799778537 0.000246824748826507 -0.000329567131906322 -0.000100055638308394 -0.000843374093922739 -0.00182816513524967 0.000762276721414934 0.000547214397100731 -0.000261835368196878 -0.000145977686326793 -0.000418138010040314 -0.000275994456749945 0.00096506287877901 -0.000122679144738069 -0.00077104475183501 -0.000772836964526374 -9.74711304966847e-05 0.00132936498148101 0.000993746723184863 -0.000451847013386047 -0.000138456169144319 -0.00109488862631829 -0.000236567991803771 0.000228265967558205 -0.000141243730919727 7.13248149721013e-05 0.000100146168015486 -0.000101542587067266 -0.00103071143157252 -0.000910687763439777 -0.00169775499641645 0.000648520060953617 -0.00081739205188841 -0.000440416182630077 -0.000143836644462325 -0.00086105174113707 0.00118491489582653 0.00092521493356959 0.000685499195885314 -0.00170870319900812 -0.000681671133016343 -0.00207056008076914 0.000710534206097013 -0.00163014844752510 -0.00123315260753790 -0.000307767159812872 -0.000896177657593727 0.000651475976366861 0.00196454841594412 0.000447156493560086 | |||||||||||||||||||||||||||||||||||||||||||||||||||||
Tables (Output of Computation) | |||||||||||||||||||||||||||||||||||||||||||||||||||||
| |||||||||||||||||||||||||||||||||||||||||||||||||||||
Figures (Output of Computation) | |||||||||||||||||||||||||||||||||||||||||||||||||||||
Input Parameters & R Code | |||||||||||||||||||||||||||||||||||||||||||||||||||||
| Parameters (Session): | |||||||||||||||||||||||||||||||||||||||||||||||||||||
| par1 = -0.4 ; par2 = 1 ; par3 = 1 ; par4 = 12 ; | |||||||||||||||||||||||||||||||||||||||||||||||||||||
| Parameters (R input): | |||||||||||||||||||||||||||||||||||||||||||||||||||||
| par1 = 0 ; par2 = 0 ; | |||||||||||||||||||||||||||||||||||||||||||||||||||||
| R code (references can be found in the software module): | |||||||||||||||||||||||||||||||||||||||||||||||||||||
par1 <- as.numeric(par1) | |||||||||||||||||||||||||||||||||||||||||||||||||||||