Free Statistics

of Irreproducible Research!

Author's title

Author*Unverified author*
R Software Modulerwasp_autocorrelation.wasp
Title produced by software(Partial) Autocorrelation Function
Date of computationThu, 13 Dec 2007 05:35:24 -0700
Cite this page as followsStatistical Computations at FreeStatistics.org, Office for Research Development and Education, URL https://freestatistics.org/blog/index.php?v=date/2007/Dec/13/t11975484376i7d8jgjilxrmbj.htm/, Retrieved Sun, 05 May 2024 16:27:39 +0000
Statistical Computations at FreeStatistics.org, Office for Research Development and Education, URL https://freestatistics.org/blog/index.php?pk=3481, Retrieved Sun, 05 May 2024 16:27:39 +0000
QR Codes:

Original text written by user:
IsPrivate?No (this computation is public)
User-defined keywords
Estimated Impact215
Family? (F = Feedback message, R = changed R code, M = changed R Module, P = changed Parameters, D = changed Data)
-     [Central Tendency] [Paper_EDA_output1] [2007-12-13 08:57:44] [e44956fac49704be9081ff9a6fb8481a]
- RMPD    [(Partial) Autocorrelation Function] [Paper_ACF_output7b] [2007-12-13 12:35:24] [d41d8cd98f00b204e9800998ecf8427e] [Current]
Feedback Forum

Post a new message
Dataseries X:
36409
33163
34122
35225
28249
30374
26311
22069
23651
28628
23187
14727
43080
32519
39657
33614
28671
34243
27336
22916
24537
26128
22602
15744
41086
39690
43129
37863
35953
29133
24693
22205
21725
27192
21790
13253
37702
30364
32609
30212
29965
28352
25814
22414
20506
28806
22228
13971
36845
35338
35022
34777
26887
23970
22780
17351
21382
24561
17409
11514
31514
27071
29462
26105
22397
23843
21705
18089
20764
25316
17704
15548
28029
29383
36438
32034
22679
24319
18004
17537
20366
22782
19169
13807
29743
25591
29096
26482
22405
27044
17970
18730
19684
19785
18479
10698


Summary of compuational transaction
Raw Inputview raw input (R code)
Raw Outputview raw output of R engine
Computing time3 seconds
R Server'Herman Ole Andreas Wold' @ 193.190.124.10:1001

\begin{tabular}{lllllllll}
\hline
Summary of compuational transaction \tabularnewline
Raw Input & view raw input (R code)  \tabularnewline
Raw Output & view raw output of R engine  \tabularnewline
Computing time & 3 seconds \tabularnewline
R Server & 'Herman Ole Andreas Wold' @ 193.190.124.10:1001 \tabularnewline
\hline
\end{tabular}
%Source: https://freestatistics.org/blog/index.php?pk=3481&T=0

[TABLE]
[ROW][C]Summary of compuational transaction[/C][/ROW]
[ROW][C]Raw Input[/C][C]view raw input (R code) [/C][/ROW]
[ROW][C]Raw Output[/C][C]view raw output of R engine [/C][/ROW]
[ROW][C]Computing time[/C][C]3 seconds[/C][/ROW]
[ROW][C]R Server[/C][C]'Herman Ole Andreas Wold' @ 193.190.124.10:1001[/C][/ROW]
[/TABLE]
Source: https://freestatistics.org/blog/index.php?pk=3481&T=0

Globally Unique Identifier (entire table): ba.freestatistics.org/blog/index.php?pk=3481&T=0

As an alternative you can also use a QR Code:  

The GUIDs for individual cells are displayed in the table below:

Summary of compuational transaction
Raw Inputview raw input (R code)
Raw Outputview raw output of R engine
Computing time3 seconds
R Server'Herman Ole Andreas Wold' @ 193.190.124.10:1001


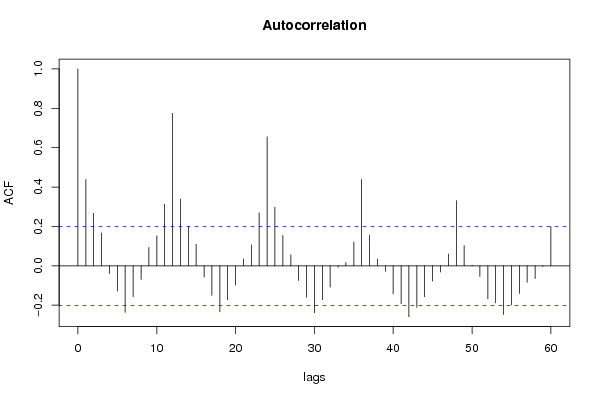
Autocorrelation Function
Time lag kACF(k)T-STATP-value
019.7980
10.4385714.29712.1e-05
20.2670932.6170.005153
30.1673261.63950.052196
4-0.038921-0.38140.648107
5-0.127548-1.24970.892778
6-0.235851-2.31090.98851
7-0.15671-1.53540.936017
8-0.068812-0.67420.749103
90.0935830.91690.180741
100.1528511.49760.068755
110.3131533.06830.001399
120.7745587.58910
130.3394313.32570.000625
140.1999071.95870.026526
150.1097821.07560.142392
16-0.055982-0.54850.707693
17-0.149873-1.46850.927375
18-0.233224-2.28510.987747
19-0.17235-1.68870.952736
20-0.09771-0.95740.829605
210.0350850.34380.36589
220.1062011.04060.150348
230.2691842.63750.004872
240.6551176.41880
250.2977172.9170.0022
260.1542081.51090.067047
270.0560840.54950.291965
28-0.074726-0.73220.767073
29-0.159491-1.56270.939291
30-0.237575-2.32780.988987
31-0.172323-1.68840.952711
32-0.107521-1.05350.852618
33-0.006679-0.06540.526022
340.0175240.17170.432019
350.1207051.18270.119932
360.4391264.30252e-05
370.1555791.52440.065354
380.0351180.34410.365769
39-0.028339-0.27770.609068
40-0.141199-1.38350.915135
41-0.192897-1.890.969113
42-0.257952-2.52740.993438
43-0.211476-2.0720.979528
44-0.156417-1.53260.935665
45-0.077243-0.75680.774494
46-0.031416-0.30780.620553
470.0600020.58790.27899
480.3311333.24440.00081
490.1033371.01250.156925
500.0026420.02590.489702
51-0.053724-0.52640.700081
52-0.166755-1.63390.947218
53-0.187886-1.84090.965638
54-0.24753-2.42530.991417
55-0.198373-1.94370.972567
56-0.140009-1.37180.913338
57-0.083663-0.81970.792799
58-0.064233-0.62940.734694
59-0.003726-0.03650.514525

\begin{tabular}{lllllllll}
\hline
Autocorrelation Function \tabularnewline
Time lag k & ACF(k) & T-STAT & P-value \tabularnewline
0 & 1 & 9.798 & 0 \tabularnewline
1 & 0.438571 & 4.2971 & 2.1e-05 \tabularnewline
2 & 0.267093 & 2.617 & 0.005153 \tabularnewline
3 & 0.167326 & 1.6395 & 0.052196 \tabularnewline
4 & -0.038921 & -0.3814 & 0.648107 \tabularnewline
5 & -0.127548 & -1.2497 & 0.892778 \tabularnewline
6 & -0.235851 & -2.3109 & 0.98851 \tabularnewline
7 & -0.15671 & -1.5354 & 0.936017 \tabularnewline
8 & -0.068812 & -0.6742 & 0.749103 \tabularnewline
9 & 0.093583 & 0.9169 & 0.180741 \tabularnewline
10 & 0.152851 & 1.4976 & 0.068755 \tabularnewline
11 & 0.313153 & 3.0683 & 0.001399 \tabularnewline
12 & 0.774558 & 7.5891 & 0 \tabularnewline
13 & 0.339431 & 3.3257 & 0.000625 \tabularnewline
14 & 0.199907 & 1.9587 & 0.026526 \tabularnewline
15 & 0.109782 & 1.0756 & 0.142392 \tabularnewline
16 & -0.055982 & -0.5485 & 0.707693 \tabularnewline
17 & -0.149873 & -1.4685 & 0.927375 \tabularnewline
18 & -0.233224 & -2.2851 & 0.987747 \tabularnewline
19 & -0.17235 & -1.6887 & 0.952736 \tabularnewline
20 & -0.09771 & -0.9574 & 0.829605 \tabularnewline
21 & 0.035085 & 0.3438 & 0.36589 \tabularnewline
22 & 0.106201 & 1.0406 & 0.150348 \tabularnewline
23 & 0.269184 & 2.6375 & 0.004872 \tabularnewline
24 & 0.655117 & 6.4188 & 0 \tabularnewline
25 & 0.297717 & 2.917 & 0.0022 \tabularnewline
26 & 0.154208 & 1.5109 & 0.067047 \tabularnewline
27 & 0.056084 & 0.5495 & 0.291965 \tabularnewline
28 & -0.074726 & -0.7322 & 0.767073 \tabularnewline
29 & -0.159491 & -1.5627 & 0.939291 \tabularnewline
30 & -0.237575 & -2.3278 & 0.988987 \tabularnewline
31 & -0.172323 & -1.6884 & 0.952711 \tabularnewline
32 & -0.107521 & -1.0535 & 0.852618 \tabularnewline
33 & -0.006679 & -0.0654 & 0.526022 \tabularnewline
34 & 0.017524 & 0.1717 & 0.432019 \tabularnewline
35 & 0.120705 & 1.1827 & 0.119932 \tabularnewline
36 & 0.439126 & 4.3025 & 2e-05 \tabularnewline
37 & 0.155579 & 1.5244 & 0.065354 \tabularnewline
38 & 0.035118 & 0.3441 & 0.365769 \tabularnewline
39 & -0.028339 & -0.2777 & 0.609068 \tabularnewline
40 & -0.141199 & -1.3835 & 0.915135 \tabularnewline
41 & -0.192897 & -1.89 & 0.969113 \tabularnewline
42 & -0.257952 & -2.5274 & 0.993438 \tabularnewline
43 & -0.211476 & -2.072 & 0.979528 \tabularnewline
44 & -0.156417 & -1.5326 & 0.935665 \tabularnewline
45 & -0.077243 & -0.7568 & 0.774494 \tabularnewline
46 & -0.031416 & -0.3078 & 0.620553 \tabularnewline
47 & 0.060002 & 0.5879 & 0.27899 \tabularnewline
48 & 0.331133 & 3.2444 & 0.00081 \tabularnewline
49 & 0.103337 & 1.0125 & 0.156925 \tabularnewline
50 & 0.002642 & 0.0259 & 0.489702 \tabularnewline
51 & -0.053724 & -0.5264 & 0.700081 \tabularnewline
52 & -0.166755 & -1.6339 & 0.947218 \tabularnewline
53 & -0.187886 & -1.8409 & 0.965638 \tabularnewline
54 & -0.24753 & -2.4253 & 0.991417 \tabularnewline
55 & -0.198373 & -1.9437 & 0.972567 \tabularnewline
56 & -0.140009 & -1.3718 & 0.913338 \tabularnewline
57 & -0.083663 & -0.8197 & 0.792799 \tabularnewline
58 & -0.064233 & -0.6294 & 0.734694 \tabularnewline
59 & -0.003726 & -0.0365 & 0.514525 \tabularnewline
\hline
\end{tabular}
%Source: https://freestatistics.org/blog/index.php?pk=3481&T=1

[TABLE]
[ROW][C]Autocorrelation Function[/C][/ROW]
[ROW][C]Time lag k[/C][C]ACF(k)[/C][C]T-STAT[/C][C]P-value[/C][/ROW]
[ROW][C]0[/C][C]1[/C][C]9.798[/C][C]0[/C][/ROW]
[ROW][C]1[/C][C]0.438571[/C][C]4.2971[/C][C]2.1e-05[/C][/ROW]
[ROW][C]2[/C][C]0.267093[/C][C]2.617[/C][C]0.005153[/C][/ROW]
[ROW][C]3[/C][C]0.167326[/C][C]1.6395[/C][C]0.052196[/C][/ROW]
[ROW][C]4[/C][C]-0.038921[/C][C]-0.3814[/C][C]0.648107[/C][/ROW]
[ROW][C]5[/C][C]-0.127548[/C][C]-1.2497[/C][C]0.892778[/C][/ROW]
[ROW][C]6[/C][C]-0.235851[/C][C]-2.3109[/C][C]0.98851[/C][/ROW]
[ROW][C]7[/C][C]-0.15671[/C][C]-1.5354[/C][C]0.936017[/C][/ROW]
[ROW][C]8[/C][C]-0.068812[/C][C]-0.6742[/C][C]0.749103[/C][/ROW]
[ROW][C]9[/C][C]0.093583[/C][C]0.9169[/C][C]0.180741[/C][/ROW]
[ROW][C]10[/C][C]0.152851[/C][C]1.4976[/C][C]0.068755[/C][/ROW]
[ROW][C]11[/C][C]0.313153[/C][C]3.0683[/C][C]0.001399[/C][/ROW]
[ROW][C]12[/C][C]0.774558[/C][C]7.5891[/C][C]0[/C][/ROW]
[ROW][C]13[/C][C]0.339431[/C][C]3.3257[/C][C]0.000625[/C][/ROW]
[ROW][C]14[/C][C]0.199907[/C][C]1.9587[/C][C]0.026526[/C][/ROW]
[ROW][C]15[/C][C]0.109782[/C][C]1.0756[/C][C]0.142392[/C][/ROW]
[ROW][C]16[/C][C]-0.055982[/C][C]-0.5485[/C][C]0.707693[/C][/ROW]
[ROW][C]17[/C][C]-0.149873[/C][C]-1.4685[/C][C]0.927375[/C][/ROW]
[ROW][C]18[/C][C]-0.233224[/C][C]-2.2851[/C][C]0.987747[/C][/ROW]
[ROW][C]19[/C][C]-0.17235[/C][C]-1.6887[/C][C]0.952736[/C][/ROW]
[ROW][C]20[/C][C]-0.09771[/C][C]-0.9574[/C][C]0.829605[/C][/ROW]
[ROW][C]21[/C][C]0.035085[/C][C]0.3438[/C][C]0.36589[/C][/ROW]
[ROW][C]22[/C][C]0.106201[/C][C]1.0406[/C][C]0.150348[/C][/ROW]
[ROW][C]23[/C][C]0.269184[/C][C]2.6375[/C][C]0.004872[/C][/ROW]
[ROW][C]24[/C][C]0.655117[/C][C]6.4188[/C][C]0[/C][/ROW]
[ROW][C]25[/C][C]0.297717[/C][C]2.917[/C][C]0.0022[/C][/ROW]
[ROW][C]26[/C][C]0.154208[/C][C]1.5109[/C][C]0.067047[/C][/ROW]
[ROW][C]27[/C][C]0.056084[/C][C]0.5495[/C][C]0.291965[/C][/ROW]
[ROW][C]28[/C][C]-0.074726[/C][C]-0.7322[/C][C]0.767073[/C][/ROW]
[ROW][C]29[/C][C]-0.159491[/C][C]-1.5627[/C][C]0.939291[/C][/ROW]
[ROW][C]30[/C][C]-0.237575[/C][C]-2.3278[/C][C]0.988987[/C][/ROW]
[ROW][C]31[/C][C]-0.172323[/C][C]-1.6884[/C][C]0.952711[/C][/ROW]
[ROW][C]32[/C][C]-0.107521[/C][C]-1.0535[/C][C]0.852618[/C][/ROW]
[ROW][C]33[/C][C]-0.006679[/C][C]-0.0654[/C][C]0.526022[/C][/ROW]
[ROW][C]34[/C][C]0.017524[/C][C]0.1717[/C][C]0.432019[/C][/ROW]
[ROW][C]35[/C][C]0.120705[/C][C]1.1827[/C][C]0.119932[/C][/ROW]
[ROW][C]36[/C][C]0.439126[/C][C]4.3025[/C][C]2e-05[/C][/ROW]
[ROW][C]37[/C][C]0.155579[/C][C]1.5244[/C][C]0.065354[/C][/ROW]
[ROW][C]38[/C][C]0.035118[/C][C]0.3441[/C][C]0.365769[/C][/ROW]
[ROW][C]39[/C][C]-0.028339[/C][C]-0.2777[/C][C]0.609068[/C][/ROW]
[ROW][C]40[/C][C]-0.141199[/C][C]-1.3835[/C][C]0.915135[/C][/ROW]
[ROW][C]41[/C][C]-0.192897[/C][C]-1.89[/C][C]0.969113[/C][/ROW]
[ROW][C]42[/C][C]-0.257952[/C][C]-2.5274[/C][C]0.993438[/C][/ROW]
[ROW][C]43[/C][C]-0.211476[/C][C]-2.072[/C][C]0.979528[/C][/ROW]
[ROW][C]44[/C][C]-0.156417[/C][C]-1.5326[/C][C]0.935665[/C][/ROW]
[ROW][C]45[/C][C]-0.077243[/C][C]-0.7568[/C][C]0.774494[/C][/ROW]
[ROW][C]46[/C][C]-0.031416[/C][C]-0.3078[/C][C]0.620553[/C][/ROW]
[ROW][C]47[/C][C]0.060002[/C][C]0.5879[/C][C]0.27899[/C][/ROW]
[ROW][C]48[/C][C]0.331133[/C][C]3.2444[/C][C]0.00081[/C][/ROW]
[ROW][C]49[/C][C]0.103337[/C][C]1.0125[/C][C]0.156925[/C][/ROW]
[ROW][C]50[/C][C]0.002642[/C][C]0.0259[/C][C]0.489702[/C][/ROW]
[ROW][C]51[/C][C]-0.053724[/C][C]-0.5264[/C][C]0.700081[/C][/ROW]
[ROW][C]52[/C][C]-0.166755[/C][C]-1.6339[/C][C]0.947218[/C][/ROW]
[ROW][C]53[/C][C]-0.187886[/C][C]-1.8409[/C][C]0.965638[/C][/ROW]
[ROW][C]54[/C][C]-0.24753[/C][C]-2.4253[/C][C]0.991417[/C][/ROW]
[ROW][C]55[/C][C]-0.198373[/C][C]-1.9437[/C][C]0.972567[/C][/ROW]
[ROW][C]56[/C][C]-0.140009[/C][C]-1.3718[/C][C]0.913338[/C][/ROW]
[ROW][C]57[/C][C]-0.083663[/C][C]-0.8197[/C][C]0.792799[/C][/ROW]
[ROW][C]58[/C][C]-0.064233[/C][C]-0.6294[/C][C]0.734694[/C][/ROW]
[ROW][C]59[/C][C]-0.003726[/C][C]-0.0365[/C][C]0.514525[/C][/ROW]
[/TABLE]
Source: https://freestatistics.org/blog/index.php?pk=3481&T=1

Globally Unique Identifier (entire table): ba.freestatistics.org/blog/index.php?pk=3481&T=1

As an alternative you can also use a QR Code:  

The GUIDs for individual cells are displayed in the table below:

Autocorrelation Function
Time lag kACF(k)T-STATP-value
019.7980
10.4385714.29712.1e-05
20.2670932.6170.005153
30.1673261.63950.052196
4-0.038921-0.38140.648107
5-0.127548-1.24970.892778
6-0.235851-2.31090.98851
7-0.15671-1.53540.936017
8-0.068812-0.67420.749103
90.0935830.91690.180741
100.1528511.49760.068755
110.3131533.06830.001399
120.7745587.58910
130.3394313.32570.000625
140.1999071.95870.026526
150.1097821.07560.142392
16-0.055982-0.54850.707693
17-0.149873-1.46850.927375
18-0.233224-2.28510.987747
19-0.17235-1.68870.952736
20-0.09771-0.95740.829605
210.0350850.34380.36589
220.1062011.04060.150348
230.2691842.63750.004872
240.6551176.41880
250.2977172.9170.0022
260.1542081.51090.067047
270.0560840.54950.291965
28-0.074726-0.73220.767073
29-0.159491-1.56270.939291
30-0.237575-2.32780.988987
31-0.172323-1.68840.952711
32-0.107521-1.05350.852618
33-0.006679-0.06540.526022
340.0175240.17170.432019
350.1207051.18270.119932
360.4391264.30252e-05
370.1555791.52440.065354
380.0351180.34410.365769
39-0.028339-0.27770.609068
40-0.141199-1.38350.915135
41-0.192897-1.890.969113
42-0.257952-2.52740.993438
43-0.211476-2.0720.979528
44-0.156417-1.53260.935665
45-0.077243-0.75680.774494
46-0.031416-0.30780.620553
470.0600020.58790.27899
480.3311333.24440.00081
490.1033371.01250.156925
500.0026420.02590.489702
51-0.053724-0.52640.700081
52-0.166755-1.63390.947218
53-0.187886-1.84090.965638
54-0.24753-2.42530.991417
55-0.198373-1.94370.972567
56-0.140009-1.37180.913338
57-0.083663-0.81970.792799
58-0.064233-0.62940.734694
59-0.003726-0.03650.514525


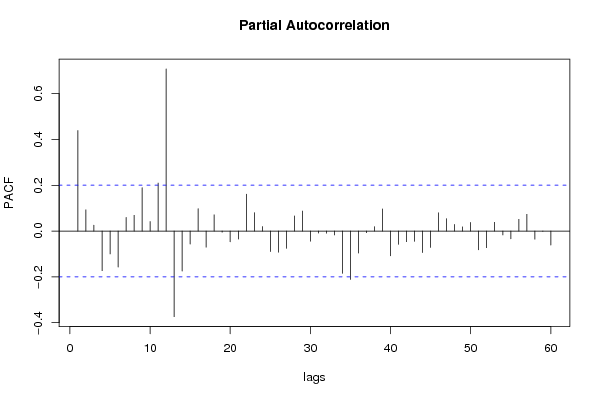
Partial Autocorrelation Function
Time lag kPACF(k)T-STATP-value
00.4385714.29712.1e-05
10.092550.90680.183391
20.0255240.25010.401528
3-0.172853-1.69360.953208
4-0.09973-0.97720.834526
5-0.157401-1.54220.936843
60.0592580.58060.281434
70.0689070.67510.250604
80.1891281.85310.033472
90.041330.40490.343208
100.2097792.05540.021278
110.7077386.93440
12-0.373669-3.66120.999795
13-0.174844-1.71310.95504
14-0.056733-0.55590.710204
150.0975960.95620.170675
16-0.070657-0.69230.754789
170.0710880.69650.243893
18-0.005108-0.05010.519908
19-0.046956-0.46010.676749
20-0.035077-0.34370.63408
210.160741.57490.059281
220.0804280.7880.216309
230.0196070.19210.424031
24-0.089541-0.87730.808748
25-0.092166-0.9030.815618
26-0.075406-0.73880.769091
270.065950.64620.259853
280.087560.85790.196539
29-0.044103-0.43210.666687
30-0.008982-0.0880.534971
31-0.009289-0.0910.536165
32-0.016819-0.16480.565272
33-0.184426-1.8070.963052
34-0.211218-2.06950.979407
35-0.096045-0.9410.825479
36-0.007263-0.07120.528291
370.0191470.18760.425791
380.0968170.94860.1726
39-0.107968-1.05790.853614
40-0.057628-0.56460.713181
41-0.046259-0.45320.674303
42-0.044711-0.43810.668842
43-0.093913-0.92020.8201
44-0.071535-0.70090.757469
450.079780.78170.218163
460.0539730.52880.299074
470.0290360.28450.388322
480.0182860.17920.429092
490.037410.36650.357383
50-0.081769-0.80120.787495
51-0.072373-0.70910.760012
520.0384440.37670.353625
53-0.017103-0.16760.566365
54-0.033673-0.32990.628913
550.0514150.50380.307791
560.0729030.71430.238388
57-0.035653-0.34930.636197
58-0.001039-0.01020.504052
59-0.06125-0.60010.725082

\begin{tabular}{lllllllll}
\hline
Partial Autocorrelation Function \tabularnewline
Time lag k & PACF(k) & T-STAT & P-value \tabularnewline
0 & 0.438571 & 4.2971 & 2.1e-05 \tabularnewline
1 & 0.09255 & 0.9068 & 0.183391 \tabularnewline
2 & 0.025524 & 0.2501 & 0.401528 \tabularnewline
3 & -0.172853 & -1.6936 & 0.953208 \tabularnewline
4 & -0.09973 & -0.9772 & 0.834526 \tabularnewline
5 & -0.157401 & -1.5422 & 0.936843 \tabularnewline
6 & 0.059258 & 0.5806 & 0.281434 \tabularnewline
7 & 0.068907 & 0.6751 & 0.250604 \tabularnewline
8 & 0.189128 & 1.8531 & 0.033472 \tabularnewline
9 & 0.04133 & 0.4049 & 0.343208 \tabularnewline
10 & 0.209779 & 2.0554 & 0.021278 \tabularnewline
11 & 0.707738 & 6.9344 & 0 \tabularnewline
12 & -0.373669 & -3.6612 & 0.999795 \tabularnewline
13 & -0.174844 & -1.7131 & 0.95504 \tabularnewline
14 & -0.056733 & -0.5559 & 0.710204 \tabularnewline
15 & 0.097596 & 0.9562 & 0.170675 \tabularnewline
16 & -0.070657 & -0.6923 & 0.754789 \tabularnewline
17 & 0.071088 & 0.6965 & 0.243893 \tabularnewline
18 & -0.005108 & -0.0501 & 0.519908 \tabularnewline
19 & -0.046956 & -0.4601 & 0.676749 \tabularnewline
20 & -0.035077 & -0.3437 & 0.63408 \tabularnewline
21 & 0.16074 & 1.5749 & 0.059281 \tabularnewline
22 & 0.080428 & 0.788 & 0.216309 \tabularnewline
23 & 0.019607 & 0.1921 & 0.424031 \tabularnewline
24 & -0.089541 & -0.8773 & 0.808748 \tabularnewline
25 & -0.092166 & -0.903 & 0.815618 \tabularnewline
26 & -0.075406 & -0.7388 & 0.769091 \tabularnewline
27 & 0.06595 & 0.6462 & 0.259853 \tabularnewline
28 & 0.08756 & 0.8579 & 0.196539 \tabularnewline
29 & -0.044103 & -0.4321 & 0.666687 \tabularnewline
30 & -0.008982 & -0.088 & 0.534971 \tabularnewline
31 & -0.009289 & -0.091 & 0.536165 \tabularnewline
32 & -0.016819 & -0.1648 & 0.565272 \tabularnewline
33 & -0.184426 & -1.807 & 0.963052 \tabularnewline
34 & -0.211218 & -2.0695 & 0.979407 \tabularnewline
35 & -0.096045 & -0.941 & 0.825479 \tabularnewline
36 & -0.007263 & -0.0712 & 0.528291 \tabularnewline
37 & 0.019147 & 0.1876 & 0.425791 \tabularnewline
38 & 0.096817 & 0.9486 & 0.1726 \tabularnewline
39 & -0.107968 & -1.0579 & 0.853614 \tabularnewline
40 & -0.057628 & -0.5646 & 0.713181 \tabularnewline
41 & -0.046259 & -0.4532 & 0.674303 \tabularnewline
42 & -0.044711 & -0.4381 & 0.668842 \tabularnewline
43 & -0.093913 & -0.9202 & 0.8201 \tabularnewline
44 & -0.071535 & -0.7009 & 0.757469 \tabularnewline
45 & 0.07978 & 0.7817 & 0.218163 \tabularnewline
46 & 0.053973 & 0.5288 & 0.299074 \tabularnewline
47 & 0.029036 & 0.2845 & 0.388322 \tabularnewline
48 & 0.018286 & 0.1792 & 0.429092 \tabularnewline
49 & 0.03741 & 0.3665 & 0.357383 \tabularnewline
50 & -0.081769 & -0.8012 & 0.787495 \tabularnewline
51 & -0.072373 & -0.7091 & 0.760012 \tabularnewline
52 & 0.038444 & 0.3767 & 0.353625 \tabularnewline
53 & -0.017103 & -0.1676 & 0.566365 \tabularnewline
54 & -0.033673 & -0.3299 & 0.628913 \tabularnewline
55 & 0.051415 & 0.5038 & 0.307791 \tabularnewline
56 & 0.072903 & 0.7143 & 0.238388 \tabularnewline
57 & -0.035653 & -0.3493 & 0.636197 \tabularnewline
58 & -0.001039 & -0.0102 & 0.504052 \tabularnewline
59 & -0.06125 & -0.6001 & 0.725082 \tabularnewline
\hline
\end{tabular}
%Source: https://freestatistics.org/blog/index.php?pk=3481&T=2

[TABLE]
[ROW][C]Partial Autocorrelation Function[/C][/ROW]
[ROW][C]Time lag k[/C][C]PACF(k)[/C][C]T-STAT[/C][C]P-value[/C][/ROW]
[ROW][C]0[/C][C]0.438571[/C][C]4.2971[/C][C]2.1e-05[/C][/ROW]
[ROW][C]1[/C][C]0.09255[/C][C]0.9068[/C][C]0.183391[/C][/ROW]
[ROW][C]2[/C][C]0.025524[/C][C]0.2501[/C][C]0.401528[/C][/ROW]
[ROW][C]3[/C][C]-0.172853[/C][C]-1.6936[/C][C]0.953208[/C][/ROW]
[ROW][C]4[/C][C]-0.09973[/C][C]-0.9772[/C][C]0.834526[/C][/ROW]
[ROW][C]5[/C][C]-0.157401[/C][C]-1.5422[/C][C]0.936843[/C][/ROW]
[ROW][C]6[/C][C]0.059258[/C][C]0.5806[/C][C]0.281434[/C][/ROW]
[ROW][C]7[/C][C]0.068907[/C][C]0.6751[/C][C]0.250604[/C][/ROW]
[ROW][C]8[/C][C]0.189128[/C][C]1.8531[/C][C]0.033472[/C][/ROW]
[ROW][C]9[/C][C]0.04133[/C][C]0.4049[/C][C]0.343208[/C][/ROW]
[ROW][C]10[/C][C]0.209779[/C][C]2.0554[/C][C]0.021278[/C][/ROW]
[ROW][C]11[/C][C]0.707738[/C][C]6.9344[/C][C]0[/C][/ROW]
[ROW][C]12[/C][C]-0.373669[/C][C]-3.6612[/C][C]0.999795[/C][/ROW]
[ROW][C]13[/C][C]-0.174844[/C][C]-1.7131[/C][C]0.95504[/C][/ROW]
[ROW][C]14[/C][C]-0.056733[/C][C]-0.5559[/C][C]0.710204[/C][/ROW]
[ROW][C]15[/C][C]0.097596[/C][C]0.9562[/C][C]0.170675[/C][/ROW]
[ROW][C]16[/C][C]-0.070657[/C][C]-0.6923[/C][C]0.754789[/C][/ROW]
[ROW][C]17[/C][C]0.071088[/C][C]0.6965[/C][C]0.243893[/C][/ROW]
[ROW][C]18[/C][C]-0.005108[/C][C]-0.0501[/C][C]0.519908[/C][/ROW]
[ROW][C]19[/C][C]-0.046956[/C][C]-0.4601[/C][C]0.676749[/C][/ROW]
[ROW][C]20[/C][C]-0.035077[/C][C]-0.3437[/C][C]0.63408[/C][/ROW]
[ROW][C]21[/C][C]0.16074[/C][C]1.5749[/C][C]0.059281[/C][/ROW]
[ROW][C]22[/C][C]0.080428[/C][C]0.788[/C][C]0.216309[/C][/ROW]
[ROW][C]23[/C][C]0.019607[/C][C]0.1921[/C][C]0.424031[/C][/ROW]
[ROW][C]24[/C][C]-0.089541[/C][C]-0.8773[/C][C]0.808748[/C][/ROW]
[ROW][C]25[/C][C]-0.092166[/C][C]-0.903[/C][C]0.815618[/C][/ROW]
[ROW][C]26[/C][C]-0.075406[/C][C]-0.7388[/C][C]0.769091[/C][/ROW]
[ROW][C]27[/C][C]0.06595[/C][C]0.6462[/C][C]0.259853[/C][/ROW]
[ROW][C]28[/C][C]0.08756[/C][C]0.8579[/C][C]0.196539[/C][/ROW]
[ROW][C]29[/C][C]-0.044103[/C][C]-0.4321[/C][C]0.666687[/C][/ROW]
[ROW][C]30[/C][C]-0.008982[/C][C]-0.088[/C][C]0.534971[/C][/ROW]
[ROW][C]31[/C][C]-0.009289[/C][C]-0.091[/C][C]0.536165[/C][/ROW]
[ROW][C]32[/C][C]-0.016819[/C][C]-0.1648[/C][C]0.565272[/C][/ROW]
[ROW][C]33[/C][C]-0.184426[/C][C]-1.807[/C][C]0.963052[/C][/ROW]
[ROW][C]34[/C][C]-0.211218[/C][C]-2.0695[/C][C]0.979407[/C][/ROW]
[ROW][C]35[/C][C]-0.096045[/C][C]-0.941[/C][C]0.825479[/C][/ROW]
[ROW][C]36[/C][C]-0.007263[/C][C]-0.0712[/C][C]0.528291[/C][/ROW]
[ROW][C]37[/C][C]0.019147[/C][C]0.1876[/C][C]0.425791[/C][/ROW]
[ROW][C]38[/C][C]0.096817[/C][C]0.9486[/C][C]0.1726[/C][/ROW]
[ROW][C]39[/C][C]-0.107968[/C][C]-1.0579[/C][C]0.853614[/C][/ROW]
[ROW][C]40[/C][C]-0.057628[/C][C]-0.5646[/C][C]0.713181[/C][/ROW]
[ROW][C]41[/C][C]-0.046259[/C][C]-0.4532[/C][C]0.674303[/C][/ROW]
[ROW][C]42[/C][C]-0.044711[/C][C]-0.4381[/C][C]0.668842[/C][/ROW]
[ROW][C]43[/C][C]-0.093913[/C][C]-0.9202[/C][C]0.8201[/C][/ROW]
[ROW][C]44[/C][C]-0.071535[/C][C]-0.7009[/C][C]0.757469[/C][/ROW]
[ROW][C]45[/C][C]0.07978[/C][C]0.7817[/C][C]0.218163[/C][/ROW]
[ROW][C]46[/C][C]0.053973[/C][C]0.5288[/C][C]0.299074[/C][/ROW]
[ROW][C]47[/C][C]0.029036[/C][C]0.2845[/C][C]0.388322[/C][/ROW]
[ROW][C]48[/C][C]0.018286[/C][C]0.1792[/C][C]0.429092[/C][/ROW]
[ROW][C]49[/C][C]0.03741[/C][C]0.3665[/C][C]0.357383[/C][/ROW]
[ROW][C]50[/C][C]-0.081769[/C][C]-0.8012[/C][C]0.787495[/C][/ROW]
[ROW][C]51[/C][C]-0.072373[/C][C]-0.7091[/C][C]0.760012[/C][/ROW]
[ROW][C]52[/C][C]0.038444[/C][C]0.3767[/C][C]0.353625[/C][/ROW]
[ROW][C]53[/C][C]-0.017103[/C][C]-0.1676[/C][C]0.566365[/C][/ROW]
[ROW][C]54[/C][C]-0.033673[/C][C]-0.3299[/C][C]0.628913[/C][/ROW]
[ROW][C]55[/C][C]0.051415[/C][C]0.5038[/C][C]0.307791[/C][/ROW]
[ROW][C]56[/C][C]0.072903[/C][C]0.7143[/C][C]0.238388[/C][/ROW]
[ROW][C]57[/C][C]-0.035653[/C][C]-0.3493[/C][C]0.636197[/C][/ROW]
[ROW][C]58[/C][C]-0.001039[/C][C]-0.0102[/C][C]0.504052[/C][/ROW]
[ROW][C]59[/C][C]-0.06125[/C][C]-0.6001[/C][C]0.725082[/C][/ROW]
[/TABLE]
Source: https://freestatistics.org/blog/index.php?pk=3481&T=2

Globally Unique Identifier (entire table): ba.freestatistics.org/blog/index.php?pk=3481&T=2

As an alternative you can also use a QR Code:  

The GUIDs for individual cells are displayed in the table below:

Partial Autocorrelation Function
Time lag kPACF(k)T-STATP-value
00.4385714.29712.1e-05
10.092550.90680.183391
20.0255240.25010.401528
3-0.172853-1.69360.953208
4-0.09973-0.97720.834526
5-0.157401-1.54220.936843
60.0592580.58060.281434
70.0689070.67510.250604
80.1891281.85310.033472
90.041330.40490.343208
100.2097792.05540.021278
110.7077386.93440
12-0.373669-3.66120.999795
13-0.174844-1.71310.95504
14-0.056733-0.55590.710204
150.0975960.95620.170675
16-0.070657-0.69230.754789
170.0710880.69650.243893
18-0.005108-0.05010.519908
19-0.046956-0.46010.676749
20-0.035077-0.34370.63408
210.160741.57490.059281
220.0804280.7880.216309
230.0196070.19210.424031
24-0.089541-0.87730.808748
25-0.092166-0.9030.815618
26-0.075406-0.73880.769091
270.065950.64620.259853
280.087560.85790.196539
29-0.044103-0.43210.666687
30-0.008982-0.0880.534971
31-0.009289-0.0910.536165
32-0.016819-0.16480.565272
33-0.184426-1.8070.963052
34-0.211218-2.06950.979407
35-0.096045-0.9410.825479
36-0.007263-0.07120.528291
370.0191470.18760.425791
380.0968170.94860.1726
39-0.107968-1.05790.853614
40-0.057628-0.56460.713181
41-0.046259-0.45320.674303
42-0.044711-0.43810.668842
43-0.093913-0.92020.8201
44-0.071535-0.70090.757469
450.079780.78170.218163
460.0539730.52880.299074
470.0290360.28450.388322
480.0182860.17920.429092
490.037410.36650.357383
50-0.081769-0.80120.787495
51-0.072373-0.70910.760012
520.0384440.37670.353625
53-0.017103-0.16760.566365
54-0.033673-0.32990.628913
550.0514150.50380.307791
560.0729030.71430.238388
57-0.035653-0.34930.636197
58-0.001039-0.01020.504052
59-0.06125-0.60010.725082


Parameters (Session):
par1 = 60 ; par2 = 1 ; par3 = 0 ; par4 = 0 ; par5 = 12 ;
Parameters (R input):
par1 = 60 ; par2 = 1 ; par3 = 0 ; par4 = 0 ; par5 = 12 ;
R code (references can be found in the software module):
if (par1 == 'Default') {
par1 = 10*log10(length(x))
} else {
par1 <- as.numeric(par1)
}
par2 <- as.numeric(par2)
par3 <- as.numeric(par3)
par4 <- as.numeric(par4)
par5 <- as.numeric(par5)
if (par2 == 0) {
x <- log(x)
} else {
x <- (x ^ par2 - 1) / par2
}
if (par3 > 0) x <- diff(x,lag=1,difference=par3)
if (par4 > 0) x <- diff(x,lag=par5,difference=par4)
bitmap(file='pic1.png')
racf <- acf(x,par1,main='Autocorrelation',xlab='lags',ylab='ACF')
dev.off()
bitmap(file='pic2.png')
rpacf <- pacf(x,par1,main='Partial Autocorrelation',xlab='lags',ylab='PACF')
dev.off()
(myacf <- c(racf$acf))
(mypacf <- c(rpacf$acf))
lengthx <- length(x)
sqrtn <- sqrt(lengthx)
load(file='createtable')
a<-table.start()
a<-table.row.start(a)
a<-table.element(a,'Autocorrelation Function',4,TRUE)
a<-table.row.end(a)
a<-table.row.start(a)
a<-table.element(a,'Time lag k',header=TRUE)
a<-table.element(a,hyperlink('basics.htm','ACF(k)','click here for more information about the Autocorrelation Function'),header=TRUE)
a<-table.element(a,'T-STAT',header=TRUE)
a<-table.element(a,'P-value',header=TRUE)
a<-table.row.end(a)
for (i in 1:par1) {
a<-table.row.start(a)
a<-table.element(a,i-1,header=TRUE)
a<-table.element(a,round(myacf[i],6))
mytstat <- myacf[i]*sqrtn
a<-table.element(a,round(mytstat,4))
a<-table.element(a,round(1-pt(mytstat,lengthx),6))
a<-table.row.end(a)
}
a<-table.end(a)
table.save(a,file='mytable.tab')
a<-table.start()
a<-table.row.start(a)
a<-table.element(a,'Partial Autocorrelation Function',4,TRUE)
a<-table.row.end(a)
a<-table.row.start(a)
a<-table.element(a,'Time lag k',header=TRUE)
a<-table.element(a,hyperlink('basics.htm','PACF(k)','click here for more information about the Partial Autocorrelation Function'),header=TRUE)
a<-table.element(a,'T-STAT',header=TRUE)
a<-table.element(a,'P-value',header=TRUE)
a<-table.row.end(a)
for (i in 1:par1) {
a<-table.row.start(a)
a<-table.element(a,i-1,header=TRUE)
a<-table.element(a,round(mypacf[i],6))
mytstat <- mypacf[i]*sqrtn
a<-table.element(a,round(mytstat,4))
a<-table.element(a,round(1-pt(mytstat,lengthx),6))
a<-table.row.end(a)
}
a<-table.end(a)
table.save(a,file='mytable1.tab')