Free Statistics

of Irreproducible Research!

Author's title

Author*Unverified author*
R Software Modulerwasp_arimabackwardselection.wasp
Title produced by softwareARIMA Backward Selection
Date of computationThu, 13 Dec 2007 04:00:45 -0700
Cite this page as followsStatistical Computations at FreeStatistics.org, Office for Research Development and Education, URL https://freestatistics.org/blog/index.php?v=date/2007/Dec/13/t1197542792jhkfauefy4b434u.htm/, Retrieved Sun, 05 May 2024 15:17:05 +0000
Statistical Computations at FreeStatistics.org, Office for Research Development and Education, URL https://freestatistics.org/blog/index.php?pk=3428, Retrieved Sun, 05 May 2024 15:17:05 +0000
QR Codes:

Original text written by user:
IsPrivate?No (this computation is public)
User-defined keywords
Estimated Impact212
Family? (F = Feedback message, R = changed R code, M = changed R Module, P = changed Parameters, D = changed Data)
-       [ARIMA Backward Selection] [ARIMA] [2007-12-13 11:00:45] [c40c597932a04e0e43159741c7e63e4c] [Current]
Feedback Forum

Post a new message
Dataseries X:
12398.4
13882.3
15861.5
13286.1
15634.9
14211
13646.8
12224.6
15916.4
16535.9
15796
14418.6
15044.5
14944.2
16754.8
14254
15454.9
15644.8
14568.3
12520.2
14803
15873.2
14755.3
12875.1
14291.1
14205.3
15859.4
15258.9
15498.6
14106.5
15023.6
15761.3
16943
15070.3
13659.6
14768.9
14725.1
15998.1
15370.6
14956.9
15469.7
15101.8
16283.6
16726.5
14968.9
14861
14583.3
15305.8
17903.9
16379.4
15420.3
17870.5
15912.8
13866.5
17823.2
17872
17420.4
16704.4
15991.2
16583.6
17838.7
17209.4


Summary of compuational transaction
Raw Inputview raw input (R code)
Raw Outputview raw output of R engine
Computing time11 seconds
R Server'Gwilym Jenkins' @ 72.249.127.135

\begin{tabular}{lllllllll}
\hline
Summary of compuational transaction \tabularnewline
Raw Input & view raw input (R code)  \tabularnewline
Raw Output & view raw output of R engine  \tabularnewline
Computing time & 11 seconds \tabularnewline
R Server & 'Gwilym Jenkins' @ 72.249.127.135 \tabularnewline
\hline
\end{tabular}
%Source: https://freestatistics.org/blog/index.php?pk=3428&T=0

[TABLE]
[ROW][C]Summary of compuational transaction[/C][/ROW]
[ROW][C]Raw Input[/C][C]view raw input (R code) [/C][/ROW]
[ROW][C]Raw Output[/C][C]view raw output of R engine [/C][/ROW]
[ROW][C]Computing time[/C][C]11 seconds[/C][/ROW]
[ROW][C]R Server[/C][C]'Gwilym Jenkins' @ 72.249.127.135[/C][/ROW]
[/TABLE]
Source: https://freestatistics.org/blog/index.php?pk=3428&T=0

Globally Unique Identifier (entire table): ba.freestatistics.org/blog/index.php?pk=3428&T=0

As an alternative you can also use a QR Code:  

The GUIDs for individual cells are displayed in the table below:

Summary of compuational transaction
Raw Inputview raw input (R code)
Raw Outputview raw output of R engine
Computing time11 seconds
R Server'Gwilym Jenkins' @ 72.249.127.135


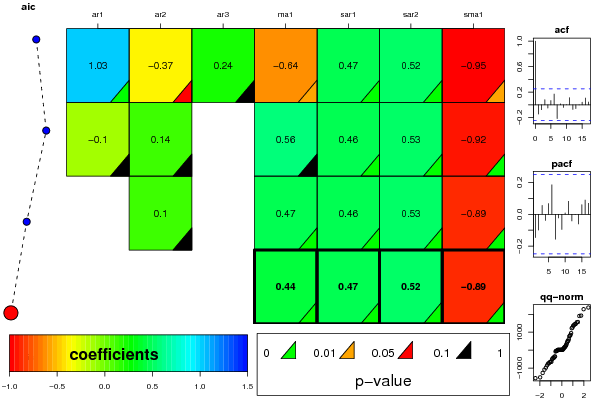
ARIMA Parameter Estimation and Backward Selection
Iterationar1ar2ar3ma1sar1sar2sma1
Estimates ( 1 )1.0277-0.3690.2354-0.64370.47220.5241-0.9512
(p-val)(5e-04 )(0.0896 )(0.1298 )(0.0199 )(0.0034 )(8e-04 )(0.0148 )
Estimates ( 2 )-0.10330.139800.56020.46110.5328-0.9236
(p-val)(0.8146 )(0.5509 )(NA )(0.1787 )(0.0024 )(5e-04 )(0 )
Estimates ( 3 )00.101900.46540.45670.5312-0.8941
(p-val)(NA )(0.5033 )(NA )(0.002 )(0.0034 )(5e-04 )(1e-04 )
Estimates ( 4 )0000.43710.46980.5171-0.8921
(p-val)(NA )(NA )(NA )(0.0011 )(0.0037 )(9e-04 )(4e-04 )
Estimates ( 5 )NANANANANANANA
(p-val)(NA )(NA )(NA )(NA )(NA )(NA )(NA )
Estimates ( 6 )NANANANANANANA
(p-val)(NA )(NA )(NA )(NA )(NA )(NA )(NA )
Estimates ( 7 )NANANANANANANA
(p-val)(NA )(NA )(NA )(NA )(NA )(NA )(NA )
Estimates ( 8 )NANANANANANANA
(p-val)(NA )(NA )(NA )(NA )(NA )(NA )(NA )
Estimates ( 9 )NANANANANANANA
(p-val)(NA )(NA )(NA )(NA )(NA )(NA )(NA )
Estimates ( 10 )NANANANANANANA
(p-val)(NA )(NA )(NA )(NA )(NA )(NA )(NA )
Estimates ( 11 )NANANANANANANA
(p-val)(NA )(NA )(NA )(NA )(NA )(NA )(NA )
Estimates ( 12 )NANANANANANANA
(p-val)(NA )(NA )(NA )(NA )(NA )(NA )(NA )
Estimates ( 13 )NANANANANANANA
(p-val)(NA )(NA )(NA )(NA )(NA )(NA )(NA )

\begin{tabular}{lllllllll}
\hline
ARIMA Parameter Estimation and Backward Selection \tabularnewline
Iteration & ar1 & ar2 & ar3 & ma1 & sar1 & sar2 & sma1 \tabularnewline
Estimates ( 1 ) & 1.0277 & -0.369 & 0.2354 & -0.6437 & 0.4722 & 0.5241 & -0.9512 \tabularnewline
(p-val) & (5e-04 ) & (0.0896 ) & (0.1298 ) & (0.0199 ) & (0.0034 ) & (8e-04 ) & (0.0148 ) \tabularnewline
Estimates ( 2 ) & -0.1033 & 0.1398 & 0 & 0.5602 & 0.4611 & 0.5328 & -0.9236 \tabularnewline
(p-val) & (0.8146 ) & (0.5509 ) & (NA ) & (0.1787 ) & (0.0024 ) & (5e-04 ) & (0 ) \tabularnewline
Estimates ( 3 ) & 0 & 0.1019 & 0 & 0.4654 & 0.4567 & 0.5312 & -0.8941 \tabularnewline
(p-val) & (NA ) & (0.5033 ) & (NA ) & (0.002 ) & (0.0034 ) & (5e-04 ) & (1e-04 ) \tabularnewline
Estimates ( 4 ) & 0 & 0 & 0 & 0.4371 & 0.4698 & 0.5171 & -0.8921 \tabularnewline
(p-val) & (NA ) & (NA ) & (NA ) & (0.0011 ) & (0.0037 ) & (9e-04 ) & (4e-04 ) \tabularnewline
Estimates ( 5 ) & NA & NA & NA & NA & NA & NA & NA \tabularnewline
(p-val) & (NA ) & (NA ) & (NA ) & (NA ) & (NA ) & (NA ) & (NA ) \tabularnewline
Estimates ( 6 ) & NA & NA & NA & NA & NA & NA & NA \tabularnewline
(p-val) & (NA ) & (NA ) & (NA ) & (NA ) & (NA ) & (NA ) & (NA ) \tabularnewline
Estimates ( 7 ) & NA & NA & NA & NA & NA & NA & NA \tabularnewline
(p-val) & (NA ) & (NA ) & (NA ) & (NA ) & (NA ) & (NA ) & (NA ) \tabularnewline
Estimates ( 8 ) & NA & NA & NA & NA & NA & NA & NA \tabularnewline
(p-val) & (NA ) & (NA ) & (NA ) & (NA ) & (NA ) & (NA ) & (NA ) \tabularnewline
Estimates ( 9 ) & NA & NA & NA & NA & NA & NA & NA \tabularnewline
(p-val) & (NA ) & (NA ) & (NA ) & (NA ) & (NA ) & (NA ) & (NA ) \tabularnewline
Estimates ( 10 ) & NA & NA & NA & NA & NA & NA & NA \tabularnewline
(p-val) & (NA ) & (NA ) & (NA ) & (NA ) & (NA ) & (NA ) & (NA ) \tabularnewline
Estimates ( 11 ) & NA & NA & NA & NA & NA & NA & NA \tabularnewline
(p-val) & (NA ) & (NA ) & (NA ) & (NA ) & (NA ) & (NA ) & (NA ) \tabularnewline
Estimates ( 12 ) & NA & NA & NA & NA & NA & NA & NA \tabularnewline
(p-val) & (NA ) & (NA ) & (NA ) & (NA ) & (NA ) & (NA ) & (NA ) \tabularnewline
Estimates ( 13 ) & NA & NA & NA & NA & NA & NA & NA \tabularnewline
(p-val) & (NA ) & (NA ) & (NA ) & (NA ) & (NA ) & (NA ) & (NA ) \tabularnewline
\hline
\end{tabular}
%Source: https://freestatistics.org/blog/index.php?pk=3428&T=1

[TABLE]
[ROW][C]ARIMA Parameter Estimation and Backward Selection[/C][/ROW]
[ROW][C]Iteration[/C][C]ar1[/C][C]ar2[/C][C]ar3[/C][C]ma1[/C][C]sar1[/C][C]sar2[/C][C]sma1[/C][/ROW]
[ROW][C]Estimates ( 1 )[/C][C]1.0277[/C][C]-0.369[/C][C]0.2354[/C][C]-0.6437[/C][C]0.4722[/C][C]0.5241[/C][C]-0.9512[/C][/ROW]
[ROW][C](p-val)[/C][C](5e-04 )[/C][C](0.0896 )[/C][C](0.1298 )[/C][C](0.0199 )[/C][C](0.0034 )[/C][C](8e-04 )[/C][C](0.0148 )[/C][/ROW]
[ROW][C]Estimates ( 2 )[/C][C]-0.1033[/C][C]0.1398[/C][C]0[/C][C]0.5602[/C][C]0.4611[/C][C]0.5328[/C][C]-0.9236[/C][/ROW]
[ROW][C](p-val)[/C][C](0.8146 )[/C][C](0.5509 )[/C][C](NA )[/C][C](0.1787 )[/C][C](0.0024 )[/C][C](5e-04 )[/C][C](0 )[/C][/ROW]
[ROW][C]Estimates ( 3 )[/C][C]0[/C][C]0.1019[/C][C]0[/C][C]0.4654[/C][C]0.4567[/C][C]0.5312[/C][C]-0.8941[/C][/ROW]
[ROW][C](p-val)[/C][C](NA )[/C][C](0.5033 )[/C][C](NA )[/C][C](0.002 )[/C][C](0.0034 )[/C][C](5e-04 )[/C][C](1e-04 )[/C][/ROW]
[ROW][C]Estimates ( 4 )[/C][C]0[/C][C]0[/C][C]0[/C][C]0.4371[/C][C]0.4698[/C][C]0.5171[/C][C]-0.8921[/C][/ROW]
[ROW][C](p-val)[/C][C](NA )[/C][C](NA )[/C][C](NA )[/C][C](0.0011 )[/C][C](0.0037 )[/C][C](9e-04 )[/C][C](4e-04 )[/C][/ROW]
[ROW][C]Estimates ( 5 )[/C][C]NA[/C][C]NA[/C][C]NA[/C][C]NA[/C][C]NA[/C][C]NA[/C][C]NA[/C][/ROW]
[ROW][C](p-val)[/C][C](NA )[/C][C](NA )[/C][C](NA )[/C][C](NA )[/C][C](NA )[/C][C](NA )[/C][C](NA )[/C][/ROW]
[ROW][C]Estimates ( 6 )[/C][C]NA[/C][C]NA[/C][C]NA[/C][C]NA[/C][C]NA[/C][C]NA[/C][C]NA[/C][/ROW]
[ROW][C](p-val)[/C][C](NA )[/C][C](NA )[/C][C](NA )[/C][C](NA )[/C][C](NA )[/C][C](NA )[/C][C](NA )[/C][/ROW]
[ROW][C]Estimates ( 7 )[/C][C]NA[/C][C]NA[/C][C]NA[/C][C]NA[/C][C]NA[/C][C]NA[/C][C]NA[/C][/ROW]
[ROW][C](p-val)[/C][C](NA )[/C][C](NA )[/C][C](NA )[/C][C](NA )[/C][C](NA )[/C][C](NA )[/C][C](NA )[/C][/ROW]
[ROW][C]Estimates ( 8 )[/C][C]NA[/C][C]NA[/C][C]NA[/C][C]NA[/C][C]NA[/C][C]NA[/C][C]NA[/C][/ROW]
[ROW][C](p-val)[/C][C](NA )[/C][C](NA )[/C][C](NA )[/C][C](NA )[/C][C](NA )[/C][C](NA )[/C][C](NA )[/C][/ROW]
[ROW][C]Estimates ( 9 )[/C][C]NA[/C][C]NA[/C][C]NA[/C][C]NA[/C][C]NA[/C][C]NA[/C][C]NA[/C][/ROW]
[ROW][C](p-val)[/C][C](NA )[/C][C](NA )[/C][C](NA )[/C][C](NA )[/C][C](NA )[/C][C](NA )[/C][C](NA )[/C][/ROW]
[ROW][C]Estimates ( 10 )[/C][C]NA[/C][C]NA[/C][C]NA[/C][C]NA[/C][C]NA[/C][C]NA[/C][C]NA[/C][/ROW]
[ROW][C](p-val)[/C][C](NA )[/C][C](NA )[/C][C](NA )[/C][C](NA )[/C][C](NA )[/C][C](NA )[/C][C](NA )[/C][/ROW]
[ROW][C]Estimates ( 11 )[/C][C]NA[/C][C]NA[/C][C]NA[/C][C]NA[/C][C]NA[/C][C]NA[/C][C]NA[/C][/ROW]
[ROW][C](p-val)[/C][C](NA )[/C][C](NA )[/C][C](NA )[/C][C](NA )[/C][C](NA )[/C][C](NA )[/C][C](NA )[/C][/ROW]
[ROW][C]Estimates ( 12 )[/C][C]NA[/C][C]NA[/C][C]NA[/C][C]NA[/C][C]NA[/C][C]NA[/C][C]NA[/C][/ROW]
[ROW][C](p-val)[/C][C](NA )[/C][C](NA )[/C][C](NA )[/C][C](NA )[/C][C](NA )[/C][C](NA )[/C][C](NA )[/C][/ROW]
[ROW][C]Estimates ( 13 )[/C][C]NA[/C][C]NA[/C][C]NA[/C][C]NA[/C][C]NA[/C][C]NA[/C][C]NA[/C][/ROW]
[ROW][C](p-val)[/C][C](NA )[/C][C](NA )[/C][C](NA )[/C][C](NA )[/C][C](NA )[/C][C](NA )[/C][C](NA )[/C][/ROW]
[/TABLE]
Source: https://freestatistics.org/blog/index.php?pk=3428&T=1

Globally Unique Identifier (entire table): ba.freestatistics.org/blog/index.php?pk=3428&T=1

As an alternative you can also use a QR Code:  

The GUIDs for individual cells are displayed in the table below:

ARIMA Parameter Estimation and Backward Selection
Iterationar1ar2ar3ma1sar1sar2sma1
Estimates ( 1 )1.0277-0.3690.2354-0.64370.47220.5241-0.9512
(p-val)(5e-04 )(0.0896 )(0.1298 )(0.0199 )(0.0034 )(8e-04 )(0.0148 )
Estimates ( 2 )-0.10330.139800.56020.46110.5328-0.9236
(p-val)(0.8146 )(0.5509 )(NA )(0.1787 )(0.0024 )(5e-04 )(0 )
Estimates ( 3 )00.101900.46540.45670.5312-0.8941
(p-val)(NA )(0.5033 )(NA )(0.002 )(0.0034 )(5e-04 )(1e-04 )
Estimates ( 4 )0000.43710.46980.5171-0.8921
(p-val)(NA )(NA )(NA )(0.0011 )(0.0037 )(9e-04 )(4e-04 )
Estimates ( 5 )NANANANANANANA
(p-val)(NA )(NA )(NA )(NA )(NA )(NA )(NA )
Estimates ( 6 )NANANANANANANA
(p-val)(NA )(NA )(NA )(NA )(NA )(NA )(NA )
Estimates ( 7 )NANANANANANANA
(p-val)(NA )(NA )(NA )(NA )(NA )(NA )(NA )
Estimates ( 8 )NANANANANANANA
(p-val)(NA )(NA )(NA )(NA )(NA )(NA )(NA )
Estimates ( 9 )NANANANANANANA
(p-val)(NA )(NA )(NA )(NA )(NA )(NA )(NA )
Estimates ( 10 )NANANANANANANA
(p-val)(NA )(NA )(NA )(NA )(NA )(NA )(NA )
Estimates ( 11 )NANANANANANANA
(p-val)(NA )(NA )(NA )(NA )(NA )(NA )(NA )
Estimates ( 12 )NANANANANANANA
(p-val)(NA )(NA )(NA )(NA )(NA )(NA )(NA )
Estimates ( 13 )NANANANANANANA
(p-val)(NA )(NA )(NA )(NA )(NA )(NA )(NA )


Estimated ARIMA Residuals
Value
14.4185717827122
1905.08294077189
-42.3697729694769
516.957662167605
445.920977246939
-423.68717891732
1263.21378679677
162.926306550356
45.8010131564645
-979.774858831754
-75.2960747697593
-654.101703728591
-665.182336462981
282.469395730669
-427.233125274925
-350.969978218600
1222.02695742683
-511.516603256168
-847.13710201931
950.445463205383
2378.53764025348
367.839115036776
-1273.85028579492
-751.256386527368
1365.85176414999
-1090.53783995135
1552.07455282611
-1518.91829972923
121.872571263455
72.7447067676821
205.153185159493
766.241103363454
807.720249711671
-1564.74113104929
515.752519162284
849.907913254887
614.925186250922
2284.84367574674
-364.661989014408
-44.738161053552
1926.49592302795
-470.14449796069
-651.160753365166
1568.11858562715
-729.281161961644
1448.84838225509
1463.75529339658
1383.68157403081
-34.0248421994264
240.016149910507
150.932207788956

\begin{tabular}{lllllllll}
\hline
Estimated ARIMA Residuals \tabularnewline
Value \tabularnewline
14.4185717827122 \tabularnewline
1905.08294077189 \tabularnewline
-42.3697729694769 \tabularnewline
516.957662167605 \tabularnewline
445.920977246939 \tabularnewline
-423.68717891732 \tabularnewline
1263.21378679677 \tabularnewline
162.926306550356 \tabularnewline
45.8010131564645 \tabularnewline
-979.774858831754 \tabularnewline
-75.2960747697593 \tabularnewline
-654.101703728591 \tabularnewline
-665.182336462981 \tabularnewline
282.469395730669 \tabularnewline
-427.233125274925 \tabularnewline
-350.969978218600 \tabularnewline
1222.02695742683 \tabularnewline
-511.516603256168 \tabularnewline
-847.13710201931 \tabularnewline
950.445463205383 \tabularnewline
2378.53764025348 \tabularnewline
367.839115036776 \tabularnewline
-1273.85028579492 \tabularnewline
-751.256386527368 \tabularnewline
1365.85176414999 \tabularnewline
-1090.53783995135 \tabularnewline
1552.07455282611 \tabularnewline
-1518.91829972923 \tabularnewline
121.872571263455 \tabularnewline
72.7447067676821 \tabularnewline
205.153185159493 \tabularnewline
766.241103363454 \tabularnewline
807.720249711671 \tabularnewline
-1564.74113104929 \tabularnewline
515.752519162284 \tabularnewline
849.907913254887 \tabularnewline
614.925186250922 \tabularnewline
2284.84367574674 \tabularnewline
-364.661989014408 \tabularnewline
-44.738161053552 \tabularnewline
1926.49592302795 \tabularnewline
-470.14449796069 \tabularnewline
-651.160753365166 \tabularnewline
1568.11858562715 \tabularnewline
-729.281161961644 \tabularnewline
1448.84838225509 \tabularnewline
1463.75529339658 \tabularnewline
1383.68157403081 \tabularnewline
-34.0248421994264 \tabularnewline
240.016149910507 \tabularnewline
150.932207788956 \tabularnewline
\hline
\end{tabular}
%Source: https://freestatistics.org/blog/index.php?pk=3428&T=2

[TABLE]
[ROW][C]Estimated ARIMA Residuals[/C][/ROW]
[ROW][C]Value[/C][/ROW]
[ROW][C]14.4185717827122[/C][/ROW]
[ROW][C]1905.08294077189[/C][/ROW]
[ROW][C]-42.3697729694769[/C][/ROW]
[ROW][C]516.957662167605[/C][/ROW]
[ROW][C]445.920977246939[/C][/ROW]
[ROW][C]-423.68717891732[/C][/ROW]
[ROW][C]1263.21378679677[/C][/ROW]
[ROW][C]162.926306550356[/C][/ROW]
[ROW][C]45.8010131564645[/C][/ROW]
[ROW][C]-979.774858831754[/C][/ROW]
[ROW][C]-75.2960747697593[/C][/ROW]
[ROW][C]-654.101703728591[/C][/ROW]
[ROW][C]-665.182336462981[/C][/ROW]
[ROW][C]282.469395730669[/C][/ROW]
[ROW][C]-427.233125274925[/C][/ROW]
[ROW][C]-350.969978218600[/C][/ROW]
[ROW][C]1222.02695742683[/C][/ROW]
[ROW][C]-511.516603256168[/C][/ROW]
[ROW][C]-847.13710201931[/C][/ROW]
[ROW][C]950.445463205383[/C][/ROW]
[ROW][C]2378.53764025348[/C][/ROW]
[ROW][C]367.839115036776[/C][/ROW]
[ROW][C]-1273.85028579492[/C][/ROW]
[ROW][C]-751.256386527368[/C][/ROW]
[ROW][C]1365.85176414999[/C][/ROW]
[ROW][C]-1090.53783995135[/C][/ROW]
[ROW][C]1552.07455282611[/C][/ROW]
[ROW][C]-1518.91829972923[/C][/ROW]
[ROW][C]121.872571263455[/C][/ROW]
[ROW][C]72.7447067676821[/C][/ROW]
[ROW][C]205.153185159493[/C][/ROW]
[ROW][C]766.241103363454[/C][/ROW]
[ROW][C]807.720249711671[/C][/ROW]
[ROW][C]-1564.74113104929[/C][/ROW]
[ROW][C]515.752519162284[/C][/ROW]
[ROW][C]849.907913254887[/C][/ROW]
[ROW][C]614.925186250922[/C][/ROW]
[ROW][C]2284.84367574674[/C][/ROW]
[ROW][C]-364.661989014408[/C][/ROW]
[ROW][C]-44.738161053552[/C][/ROW]
[ROW][C]1926.49592302795[/C][/ROW]
[ROW][C]-470.14449796069[/C][/ROW]
[ROW][C]-651.160753365166[/C][/ROW]
[ROW][C]1568.11858562715[/C][/ROW]
[ROW][C]-729.281161961644[/C][/ROW]
[ROW][C]1448.84838225509[/C][/ROW]
[ROW][C]1463.75529339658[/C][/ROW]
[ROW][C]1383.68157403081[/C][/ROW]
[ROW][C]-34.0248421994264[/C][/ROW]
[ROW][C]240.016149910507[/C][/ROW]
[ROW][C]150.932207788956[/C][/ROW]
[/TABLE]
Source: https://freestatistics.org/blog/index.php?pk=3428&T=2

Globally Unique Identifier (entire table): ba.freestatistics.org/blog/index.php?pk=3428&T=2

As an alternative you can also use a QR Code:  

The GUIDs for individual cells are displayed in the table below:

Estimated ARIMA Residuals
Value
14.4185717827122
1905.08294077189
-42.3697729694769
516.957662167605
445.920977246939
-423.68717891732
1263.21378679677
162.926306550356
45.8010131564645
-979.774858831754
-75.2960747697593
-654.101703728591
-665.182336462981
282.469395730669
-427.233125274925
-350.969978218600
1222.02695742683
-511.516603256168
-847.13710201931
950.445463205383
2378.53764025348
367.839115036776
-1273.85028579492
-751.256386527368
1365.85176414999
-1090.53783995135
1552.07455282611
-1518.91829972923
121.872571263455
72.7447067676821
205.153185159493
766.241103363454
807.720249711671
-1564.74113104929
515.752519162284
849.907913254887
614.925186250922
2284.84367574674
-364.661989014408
-44.738161053552
1926.49592302795
-470.14449796069
-651.160753365166
1568.11858562715
-729.281161961644
1448.84838225509
1463.75529339658
1383.68157403081
-34.0248421994264
240.016149910507
150.932207788956


Parameters (Session):
par1 = 1 ; par2 = 1 ; par3 = 0 ; par4 = 12 ;
Parameters (R input):
par1 = FALSE ; par2 = 1 ; par3 = 0 ; par4 = 1 ; par5 = 12 ; par6 = 3 ; par7 = 1 ; par8 = 2 ; par9 = 1 ;
R code (references can be found in the software module):
library(lattice)
if (par1 == 'TRUE') par1 <- TRUE
if (par1 == 'FALSE') par1 <- FALSE
par2 <- as.numeric(par2) #Box-Cox lambda transformation parameter
par3 <- as.numeric(par3) #degree of non-seasonal differencing
par4 <- as.numeric(par4) #degree of seasonal differencing
par5 <- as.numeric(par5) #seasonal period
par6 <- as.numeric(par6) #degree (p) of the non-seasonal AR(p) polynomial
par7 <- as.numeric(par7) #degree (q) of the non-seasonal MA(q) polynomial
par8 <- as.numeric(par8) #degree (P) of the seasonal AR(P) polynomial
par9 <- as.numeric(par9) #degree (Q) of the seasonal MA(Q) polynomial
armaGR <- function(arima.out, names, n){
try1 <- arima.out$coef
try2 <- sqrt(diag(arima.out$var.coef))
try.data.frame <- data.frame(matrix(NA,ncol=4,nrow=length(names)))
dimnames(try.data.frame) <- list(names,c('coef','std','tstat','pv'))
try.data.frame[,1] <- try1
for(i in 1:length(try2)) try.data.frame[which(rownames(try.data.frame)==names(try2)[i]),2] <- try2[i]
try.data.frame[,3] <- try.data.frame[,1] / try.data.frame[,2]
try.data.frame[,4] <- round((1-pt(abs(try.data.frame[,3]),df=n-(length(try2)+1)))*2,5)
vector <- rep(NA,length(names))
vector[is.na(try.data.frame[,4])] <- 0
maxi <- which.max(try.data.frame[,4])
continue <- max(try.data.frame[,4],na.rm=TRUE) > .05
vector[maxi] <- 0
list(summary=try.data.frame,next.vector=vector,continue=continue)
}
arimaSelect <- function(series, order=c(13,0,0), seasonal=list(order=c(2,0,0),period=12), include.mean=F){
nrc <- order[1]+order[3]+seasonal$order[1]+seasonal$order[3]
coeff <- matrix(NA, nrow=nrc*2, ncol=nrc)
pval <- matrix(NA, nrow=nrc*2, ncol=nrc)
mylist <- rep(list(NULL), nrc)
names <- NULL
if(order[1] > 0) names <- paste('ar',1:order[1],sep='')
if(order[3] > 0) names <- c( names , paste('ma',1:order[3],sep='') )
if(seasonal$order[1] > 0) names <- c(names, paste('sar',1:seasonal$order[1],sep=''))
if(seasonal$order[3] > 0) names <- c(names, paste('sma',1:seasonal$order[3],sep=''))
arima.out <- arima(series, order=order, seasonal=seasonal, include.mean=include.mean, method='ML')
mylist[[1]] <- arima.out
last.arma <- armaGR(arima.out, names, length(series))
mystop <- FALSE
i <- 1
coeff[i,] <- last.arma[[1]][,1]
pval [i,] <- last.arma[[1]][,4]
i <- 2
aic <- arima.out$aic
while(!mystop){
mylist[[i]] <- arima.out
arima.out <- arima(series, order=order, seasonal=seasonal, include.mean=include.mean, method='ML', fixed=last.arma$next.vector)
aic <- c(aic, arima.out$aic)
last.arma <- armaGR(arima.out, names, length(series))
mystop <- !last.arma$continue
coeff[i,] <- last.arma[[1]][,1]
pval [i,] <- last.arma[[1]][,4]
i <- i+1
}
list(coeff, pval, mylist, aic=aic)
}
arimaSelectplot <- function(arimaSelect.out,noms,choix){
noms <- names(arimaSelect.out[[3]][[1]]$coef)
coeff <- arimaSelect.out[[1]]
k <- min(which(is.na(coeff[,1])))-1
coeff <- coeff[1:k,]
pval <- arimaSelect.out[[2]][1:k,]
aic <- arimaSelect.out$aic[1:k]
coeff[coeff==0] <- NA
n <- ncol(coeff)
if(missing(choix)) choix <- k
layout(matrix(c(1,1,1,2,
3,3,3,2,
3,3,3,4,
5,6,7,7),nr=4),
widths=c(10,35,45,15),
heights=c(30,30,15,15))
couleurs <- rainbow(75)[1:50]#(50)
ticks <- pretty(coeff)
par(mar=c(1,1,3,1))
plot(aic,k:1-.5,type='o',pch=21,bg='blue',cex=2,axes=F,lty=2,xpd=NA)
points(aic[choix],k-choix+.5,pch=21,cex=4,bg=2,xpd=NA)
title('aic',line=2)
par(mar=c(3,0,0,0))
plot(0,axes=F,xlab='',ylab='',xlim=range(ticks),ylim=c(.1,1))
rect(xleft = min(ticks) + (0:49)/50*(max(ticks)-min(ticks)),
xright = min(ticks) + (1:50)/50*(max(ticks)-min(ticks)),
ytop = rep(1,50),
ybottom= rep(0,50),col=couleurs,border=NA)
axis(1,ticks)
rect(xleft=min(ticks),xright=max(ticks),ytop=1,ybottom=0)
text(mean(coeff,na.rm=T),.5,'coefficients',cex=2,font=2)
par(mar=c(1,1,3,1))
image(1:n,1:k,t(coeff[k:1,]),axes=F,col=couleurs,zlim=range(ticks))
for(i in 1:n) for(j in 1:k) if(!is.na(coeff[j,i])) {
if(pval[j,i]<.01) symb = 'green'
else if( (pval[j,i]<.05) & (pval[j,i]>=.01)) symb = 'orange'
else if( (pval[j,i]<.1) & (pval[j,i]>=.05)) symb = 'red'
else symb = 'black'
polygon(c(i+.5 ,i+.2 ,i+.5 ,i+.5),
c(k-j+0.5,k-j+0.5,k-j+0.8,k-j+0.5),
col=symb)
if(j==choix) {
rect(xleft=i-.5,
xright=i+.5,
ybottom=k-j+1.5,
ytop=k-j+.5,
lwd=4)
text(i,
k-j+1,
round(coeff[j,i],2),
cex=1.2,
font=2)
}
else{
rect(xleft=i-.5,xright=i+.5,ybottom=k-j+1.5,ytop=k-j+.5)
text(i,k-j+1,round(coeff[j,i],2),cex=1.2,font=1)
}
}
axis(3,1:n,noms)
par(mar=c(0.5,0,0,0.5))
plot(0,axes=F,xlab='',ylab='',type='n',xlim=c(0,8),ylim=c(-.2,.8))
cols <- c('green','orange','red','black')
niv <- c('0','0.01','0.05','0.1')
for(i in 0:3){
polygon(c(1+2*i ,1+2*i ,1+2*i-.5 ,1+2*i),
c(.4 ,.7 , .4 , .4),
col=cols[i+1])
text(2*i,0.5,niv[i+1],cex=1.5)
}
text(8,.5,1,cex=1.5)
text(4,0,'p-value',cex=2)
box()
residus <- arimaSelect.out[[3]][[choix]]$res
par(mar=c(1,2,4,1))
acf(residus,main='')
title('acf',line=.5)
par(mar=c(1,2,4,1))
pacf(residus,main='')
title('pacf',line=.5)
par(mar=c(2,2,4,1))
qqnorm(residus,main='')
title('qq-norm',line=.5)
residus
}
if (par2 == 0) x <- log(x)
if (par2 != 0) x <- x^par2
(selection <- arimaSelect(x, order=c(par6,par3,par7), seasonal=list(order=c(par8,par4,par9), period=par5)))
bitmap(file='test1.png')
resid <- arimaSelectplot(selection)
dev.off()
resid
bitmap(file='test2.png')
acf(resid,length(resid)/2, main='Residual Autocorrelation Function')
dev.off()
bitmap(file='test3.png')
pacf(resid,length(resid)/2, main='Residual Partial Autocorrelation Function')
dev.off()
bitmap(file='test4.png')
cpgram(resid, main='Residual Cumulative Periodogram')
dev.off()
bitmap(file='test5.png')
hist(resid, main='Residual Histogram', xlab='values of Residuals')
dev.off()
bitmap(file='test6.png')
densityplot(~resid,col='black',main='Residual Density Plot', xlab='values of Residuals')
dev.off()
bitmap(file='test7.png')
qqnorm(resid, main='Residual Normal Q-Q Plot')
dev.off()
ncols <- length(selection[[1]][1,])
nrows <- length(selection[[2]][,1])-1
load(file='createtable')
a<-table.start()
a<-table.row.start(a)
a<-table.element(a,'ARIMA Parameter Estimation and Backward Selection', ncols+1,TRUE)
a<-table.row.end(a)
a<-table.row.start(a)
a<-table.element(a,'Iteration', header=TRUE)
for (i in 1:ncols) {
a<-table.element(a,names(selection[[3]][[1]]$coef)[i],header=TRUE)
}
a<-table.row.end(a)
for (j in 1:nrows) {
a<-table.row.start(a)
mydum <- 'Estimates ('
mydum <- paste(mydum,j)
mydum <- paste(mydum,')')
a<-table.element(a,mydum, header=TRUE)
for (i in 1:ncols) {
a<-table.element(a,round(selection[[1]][j,i],4))
}
a<-table.row.end(a)
a<-table.row.start(a)
a<-table.element(a,'(p-val)', header=TRUE)
for (i in 1:ncols) {
mydum <- '('
mydum <- paste(mydum,round(selection[[2]][j,i],4),sep='')
mydum <- paste(mydum,')')
a<-table.element(a,mydum)
}
a<-table.row.end(a)
}
a<-table.end(a)
table.save(a,file='mytable.tab')
a<-table.start()
a<-table.row.start(a)
a<-table.element(a,'Estimated ARIMA Residuals', 1,TRUE)
a<-table.row.end(a)
a<-table.row.start(a)
a<-table.element(a,'Value', 1,TRUE)
a<-table.row.end(a)
for (i in (par4*par5+par3):length(resid)) {
a<-table.row.start(a)
a<-table.element(a,resid[i])
a<-table.row.end(a)
}
a<-table.end(a)
table.save(a,file='mytable1.tab')