Free Statistics

of Irreproducible Research!

Author's title

Author*Unverified author*
R Software Modulerwasp_arimaforecasting.wasp
Title produced by softwareARIMA Forecasting
Date of computationThu, 13 Dec 2007 03:00:45 -0700
Cite this page as followsStatistical Computations at FreeStatistics.org, Office for Research Development and Education, URL https://freestatistics.org/blog/index.php?v=date/2007/Dec/13/t1197539234lxacfzud24ty1qd.htm/, Retrieved Sun, 05 May 2024 17:36:51 +0000
Statistical Computations at FreeStatistics.org, Office for Research Development and Education, URL https://freestatistics.org/blog/index.php?pk=3377, Retrieved Sun, 05 May 2024 17:36:51 +0000
QR Codes:

Original text written by user:
IsPrivate?No (this computation is public)
User-defined keywordsChristel Stuer
Estimated Impact263
Family? (F = Feedback message, R = changed R code, M = changed R Module, P = changed Parameters, D = changed Data)
-     [ARIMA Backward Selection] [WS 5: Q2] [2007-12-06 17:51:19] [216c4ec435219ff277a18bbe0654ee7a]
F RMPD    [ARIMA Forecasting] [WS 6: Q2] [2007-12-13 10:00:45] [7071e8240f1069aec69cdda95d3fa1f8] [Current]
Feedback Forum
2008-12-23 22:51:04 [Anouk Greeve] [reply
correcte berekening en juiste conclusie.
2008-12-23 22:55:31 [Anouk Greeve] [reply
Q3
Correcte berekening, maar je zou beter ook de 2e tabel weergeven en deze nader verklaren. In deze tabel kunnen we de theoretische schatting van de standaardfout op basis van het model aflezen (% SE). Daarnaast zien we de werkelijke fout (PE). Deze laatste is bijna altijd kleiner dan de voorspelde fout. Dit is een goed teken en wijst op een correct model.
2008-12-23 22:57:14 [Anouk Greeve] [reply
Voor stap 4 moet je naar de laatste 3 kolommen kijken van de eerste tabel. Het model dat berekend wordt, gaat uit van een normaalverdeling. Alle residuals moeten normaal verdeeld zijn. Dit kun je zien door te kijken naar de density plot, de QQ-plot,... van de residuals die in de vorige workshop berekend zijn. Zo kun je zien of deze assumptie vervuld is. Wanneer dit niet het geval blijkt te zijn, zullen de p-waarde, de waarschijnlijkheden,... anders zijn omdat het model van een normaalverdeling uitgaat.
2008-12-23 22:59:14 [Anouk Greeve] [reply
Stap 5 maakt gebruik van de eerste tabel, vooral de kolommen Y(t), F(t) en de p-value. Als de p-waarde groter is dan 5% (wat hier altijd zo is) wil dit zeggen dat het verschil tussen de voorspelde waarde en de werkelijke waarde niet significant is.
2008-12-24 08:34:03 [58d427c57bd46519a715a3a7fea6a80f] [reply
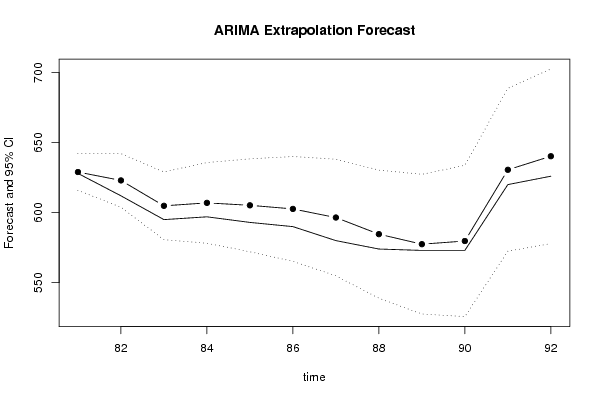
2: Voor deze stap had je enkel de grafiek nodig. Wanneer je in de verleden waarden een duidelijk patroon ziet dat herhaald wordt in de voorspelde waarden (bepaalde pieken) dan zou dit een indicatie kunnen zijn van seizoenaliteit.
Om te kijken of er een conjuctuurcyclus is daarvoor moet je ook kijken naar de grafiek.
Wanneer je dus eigenlijk een bergparabool (dus eerst stijging, daarna redelijk gelijklopend en daarna daling) kan tekenen door de verleden waarden en de voorspelde waarden zetten deze trend verder , dan zou je kunnen spreken van een conjunctuurcyclus
3:Voor deze stap moet je kijken naar de tweede tabel met %. S.E. en PE.Het is belangrijk dat je hier de betekenis van de tijdreeks uithaalt, als de werkelijke en de geschatte voorspelde fout telkens goed overeenkomen, wel dan is uw tijdreeks dus ‘normaal’ en is er niets speciaals gebeurd. Je moet ook nagaan of de stijging van de standaardfout van het begin van de voorspelde periode tot het einde logisch is. Bijvoorbeeld als er een stijging is van 20% naar 80%, dat is dus zeer groot, is dat mogelijk dat uw tijdreeks zo ’n standaardfout heeft naar de toekomst toe.
4:Voor deze stap moet je gebruik maken van de eerste tabel die de output genereert en kijken naar de drie laatste kolommen. Daar staat telkens de waarschijnlijkheid van iets.
De onderliggende assumptie is de volgende:
Het model dat berekend wordt, gaat uit van een normaalverdeling. Alle residu’s moeten normaal verdeeld zijn. Dit kun je nazien door te kijken naar de density plot, de QQ-plot, etc.. van de residu’s die in de vorige workshop berekend zijn, wanneer je de parameters q, Q, P en p berekende met de Backward Selection Method. Zo kun je zien of deze assumptie vervuld is. Wanneer dit niet het geval blijkt te zijn, zullen de p-waarde, de waarschijnlijkheden en eigenlijk alles dat berekend is, anders zijn, omdat het model dus van een normaalverdeling uitgaat.
5:Voor deze vraag moet je uit de eerste tabel de kolommen Y(t); F(t) en p-value gebruiken.
Als de p-waarde groter is dan 5%, wil dit zeggen dat het verschil tussen de voorspelde waarde en de werkelijke waarde niet significant is. Wanneer dit kleiner is dan 5%, wil dit zeggen dat het verschil tussen de voorspelde waarde en de werkelijke waarde wel significant is. Dit zou je ook in de grafieken kunnen nazien, door te kijken of de werkelijke waarden buiten het betrouwbaarheidsinterval vallen.


Post a new message
Dataseries X:
527
516
503
489
479
475
524
552
532
511
492
492
493
481
462
457
442
439
488
521
501
485
464
460
467
460
448
443
436
431
484
510
513
503
471
471
476
475
470
461
455
456
517
525
523
519
509
512
519
517
510
509
501
507
569
580
578
565
547
555
562
561
555
544
537
543
594
611
613
611
594
595
591
589
584
573
567
569
621
629
628
612
595
597
593
590
580
574
573
573
620
626


Summary of compuational transaction
Raw Inputview raw input (R code)
Raw Outputview raw output of R engine
Computing time1 seconds
R Server'Gwilym Jenkins' @ 72.249.127.135

\begin{tabular}{lllllllll}
\hline
Summary of compuational transaction \tabularnewline
Raw Input & view raw input (R code)  \tabularnewline
Raw Output & view raw output of R engine  \tabularnewline
Computing time & 1 seconds \tabularnewline
R Server & 'Gwilym Jenkins' @ 72.249.127.135 \tabularnewline
\hline
\end{tabular}
%Source: https://freestatistics.org/blog/index.php?pk=3377&T=0

[TABLE]
[ROW][C]Summary of compuational transaction[/C][/ROW]
[ROW][C]Raw Input[/C][C]view raw input (R code) [/C][/ROW]
[ROW][C]Raw Output[/C][C]view raw output of R engine [/C][/ROW]
[ROW][C]Computing time[/C][C]1 seconds[/C][/ROW]
[ROW][C]R Server[/C][C]'Gwilym Jenkins' @ 72.249.127.135[/C][/ROW]
[/TABLE]
Source: https://freestatistics.org/blog/index.php?pk=3377&T=0

Globally Unique Identifier (entire table): ba.freestatistics.org/blog/index.php?pk=3377&T=0

As an alternative you can also use a QR Code:  

The GUIDs for individual cells are displayed in the table below:

Summary of compuational transaction
Raw Inputview raw input (R code)
Raw Outputview raw output of R engine
Computing time1 seconds
R Server'Gwilym Jenkins' @ 72.249.127.135


Univariate ARIMA Extrapolation Forecast
timeY[t]F[t]95% LB95% UBp-value(H0: Y[t] = F[t])P(F[t]>Y[t-1])P(F[t]>Y[t-s])P(F[t]>Y[80])
68611-------
69613-------
70611-------
71594-------
72595-------
73591-------
74589-------
75584-------
76573-------
77567-------
78569-------
79621-------
80629-------
81628628.9928615.8929642.09270.4410.49960.99160.4996
82612622.9946603.8606642.12850.130.30410.89040.2692
83595604.8407580.6553629.02610.21260.28090.81020.0251
84597606.9623578.161635.76360.24890.79220.79220.0668
85593605.2216572.036638.40720.23520.68640.79950.0801
86590602.6366565.1977640.07560.25410.6930.76240.0838
87580596.4827554.8641638.10140.21880.61990.72170.0628
88574584.6133538.8527630.37390.32470.57830.69060.0286
89573577.4594527.5708627.3480.43050.55410.65940.0214
90573579.7277525.7087633.74680.40360.59640.65150.0369
91620630.5738572.4101688.73760.36080.97380.62650.5211
92626640.2643577.933702.59560.32690.7380.63840.6384

\begin{tabular}{lllllllll}
\hline
Univariate ARIMA Extrapolation Forecast \tabularnewline
time & Y[t] & F[t] & 95% LB & 95% UB & p-value(H0: Y[t] = F[t]) & P(F[t]>Y[t-1]) & P(F[t]>Y[t-s]) & P(F[t]>Y[80]) \tabularnewline
68 & 611 & - & - & - & - & - & - & - \tabularnewline
69 & 613 & - & - & - & - & - & - & - \tabularnewline
70 & 611 & - & - & - & - & - & - & - \tabularnewline
71 & 594 & - & - & - & - & - & - & - \tabularnewline
72 & 595 & - & - & - & - & - & - & - \tabularnewline
73 & 591 & - & - & - & - & - & - & - \tabularnewline
74 & 589 & - & - & - & - & - & - & - \tabularnewline
75 & 584 & - & - & - & - & - & - & - \tabularnewline
76 & 573 & - & - & - & - & - & - & - \tabularnewline
77 & 567 & - & - & - & - & - & - & - \tabularnewline
78 & 569 & - & - & - & - & - & - & - \tabularnewline
79 & 621 & - & - & - & - & - & - & - \tabularnewline
80 & 629 & - & - & - & - & - & - & - \tabularnewline
81 & 628 & 628.9928 & 615.8929 & 642.0927 & 0.441 & 0.4996 & 0.9916 & 0.4996 \tabularnewline
82 & 612 & 622.9946 & 603.8606 & 642.1285 & 0.13 & 0.3041 & 0.8904 & 0.2692 \tabularnewline
83 & 595 & 604.8407 & 580.6553 & 629.0261 & 0.2126 & 0.2809 & 0.8102 & 0.0251 \tabularnewline
84 & 597 & 606.9623 & 578.161 & 635.7636 & 0.2489 & 0.7922 & 0.7922 & 0.0668 \tabularnewline
85 & 593 & 605.2216 & 572.036 & 638.4072 & 0.2352 & 0.6864 & 0.7995 & 0.0801 \tabularnewline
86 & 590 & 602.6366 & 565.1977 & 640.0756 & 0.2541 & 0.693 & 0.7624 & 0.0838 \tabularnewline
87 & 580 & 596.4827 & 554.8641 & 638.1014 & 0.2188 & 0.6199 & 0.7217 & 0.0628 \tabularnewline
88 & 574 & 584.6133 & 538.8527 & 630.3739 & 0.3247 & 0.5783 & 0.6906 & 0.0286 \tabularnewline
89 & 573 & 577.4594 & 527.5708 & 627.348 & 0.4305 & 0.5541 & 0.6594 & 0.0214 \tabularnewline
90 & 573 & 579.7277 & 525.7087 & 633.7468 & 0.4036 & 0.5964 & 0.6515 & 0.0369 \tabularnewline
91 & 620 & 630.5738 & 572.4101 & 688.7376 & 0.3608 & 0.9738 & 0.6265 & 0.5211 \tabularnewline
92 & 626 & 640.2643 & 577.933 & 702.5956 & 0.3269 & 0.738 & 0.6384 & 0.6384 \tabularnewline
\hline
\end{tabular}
%Source: https://freestatistics.org/blog/index.php?pk=3377&T=1

[TABLE]
[ROW][C]Univariate ARIMA Extrapolation Forecast[/C][/ROW]
[ROW][C]time[/C][C]Y[t][/C][C]F[t][/C][C]95% LB[/C][C]95% UB[/C][C]p-value(H0: Y[t] = F[t])[/C][C]P(F[t]>Y[t-1])[/C][C]P(F[t]>Y[t-s])[/C][C]P(F[t]>Y[80])[/C][/ROW]
[ROW][C]68[/C][C]611[/C][C]-[/C][C]-[/C][C]-[/C][C]-[/C][C]-[/C][C]-[/C][C]-[/C][/ROW]
[ROW][C]69[/C][C]613[/C][C]-[/C][C]-[/C][C]-[/C][C]-[/C][C]-[/C][C]-[/C][C]-[/C][/ROW]
[ROW][C]70[/C][C]611[/C][C]-[/C][C]-[/C][C]-[/C][C]-[/C][C]-[/C][C]-[/C][C]-[/C][/ROW]
[ROW][C]71[/C][C]594[/C][C]-[/C][C]-[/C][C]-[/C][C]-[/C][C]-[/C][C]-[/C][C]-[/C][/ROW]
[ROW][C]72[/C][C]595[/C][C]-[/C][C]-[/C][C]-[/C][C]-[/C][C]-[/C][C]-[/C][C]-[/C][/ROW]
[ROW][C]73[/C][C]591[/C][C]-[/C][C]-[/C][C]-[/C][C]-[/C][C]-[/C][C]-[/C][C]-[/C][/ROW]
[ROW][C]74[/C][C]589[/C][C]-[/C][C]-[/C][C]-[/C][C]-[/C][C]-[/C][C]-[/C][C]-[/C][/ROW]
[ROW][C]75[/C][C]584[/C][C]-[/C][C]-[/C][C]-[/C][C]-[/C][C]-[/C][C]-[/C][C]-[/C][/ROW]
[ROW][C]76[/C][C]573[/C][C]-[/C][C]-[/C][C]-[/C][C]-[/C][C]-[/C][C]-[/C][C]-[/C][/ROW]
[ROW][C]77[/C][C]567[/C][C]-[/C][C]-[/C][C]-[/C][C]-[/C][C]-[/C][C]-[/C][C]-[/C][/ROW]
[ROW][C]78[/C][C]569[/C][C]-[/C][C]-[/C][C]-[/C][C]-[/C][C]-[/C][C]-[/C][C]-[/C][/ROW]
[ROW][C]79[/C][C]621[/C][C]-[/C][C]-[/C][C]-[/C][C]-[/C][C]-[/C][C]-[/C][C]-[/C][/ROW]
[ROW][C]80[/C][C]629[/C][C]-[/C][C]-[/C][C]-[/C][C]-[/C][C]-[/C][C]-[/C][C]-[/C][/ROW]
[ROW][C]81[/C][C]628[/C][C]628.9928[/C][C]615.8929[/C][C]642.0927[/C][C]0.441[/C][C]0.4996[/C][C]0.9916[/C][C]0.4996[/C][/ROW]
[ROW][C]82[/C][C]612[/C][C]622.9946[/C][C]603.8606[/C][C]642.1285[/C][C]0.13[/C][C]0.3041[/C][C]0.8904[/C][C]0.2692[/C][/ROW]
[ROW][C]83[/C][C]595[/C][C]604.8407[/C][C]580.6553[/C][C]629.0261[/C][C]0.2126[/C][C]0.2809[/C][C]0.8102[/C][C]0.0251[/C][/ROW]
[ROW][C]84[/C][C]597[/C][C]606.9623[/C][C]578.161[/C][C]635.7636[/C][C]0.2489[/C][C]0.7922[/C][C]0.7922[/C][C]0.0668[/C][/ROW]
[ROW][C]85[/C][C]593[/C][C]605.2216[/C][C]572.036[/C][C]638.4072[/C][C]0.2352[/C][C]0.6864[/C][C]0.7995[/C][C]0.0801[/C][/ROW]
[ROW][C]86[/C][C]590[/C][C]602.6366[/C][C]565.1977[/C][C]640.0756[/C][C]0.2541[/C][C]0.693[/C][C]0.7624[/C][C]0.0838[/C][/ROW]
[ROW][C]87[/C][C]580[/C][C]596.4827[/C][C]554.8641[/C][C]638.1014[/C][C]0.2188[/C][C]0.6199[/C][C]0.7217[/C][C]0.0628[/C][/ROW]
[ROW][C]88[/C][C]574[/C][C]584.6133[/C][C]538.8527[/C][C]630.3739[/C][C]0.3247[/C][C]0.5783[/C][C]0.6906[/C][C]0.0286[/C][/ROW]
[ROW][C]89[/C][C]573[/C][C]577.4594[/C][C]527.5708[/C][C]627.348[/C][C]0.4305[/C][C]0.5541[/C][C]0.6594[/C][C]0.0214[/C][/ROW]
[ROW][C]90[/C][C]573[/C][C]579.7277[/C][C]525.7087[/C][C]633.7468[/C][C]0.4036[/C][C]0.5964[/C][C]0.6515[/C][C]0.0369[/C][/ROW]
[ROW][C]91[/C][C]620[/C][C]630.5738[/C][C]572.4101[/C][C]688.7376[/C][C]0.3608[/C][C]0.9738[/C][C]0.6265[/C][C]0.5211[/C][/ROW]
[ROW][C]92[/C][C]626[/C][C]640.2643[/C][C]577.933[/C][C]702.5956[/C][C]0.3269[/C][C]0.738[/C][C]0.6384[/C][C]0.6384[/C][/ROW]
[/TABLE]
Source: https://freestatistics.org/blog/index.php?pk=3377&T=1

Globally Unique Identifier (entire table): ba.freestatistics.org/blog/index.php?pk=3377&T=1

As an alternative you can also use a QR Code:  

The GUIDs for individual cells are displayed in the table below:

Univariate ARIMA Extrapolation Forecast
timeY[t]F[t]95% LB95% UBp-value(H0: Y[t] = F[t])P(F[t]>Y[t-1])P(F[t]>Y[t-s])P(F[t]>Y[80])
68611-------
69613-------
70611-------
71594-------
72595-------
73591-------
74589-------
75584-------
76573-------
77567-------
78569-------
79621-------
80629-------
81628628.9928615.8929642.09270.4410.49960.99160.4996
82612622.9946603.8606642.12850.130.30410.89040.2692
83595604.8407580.6553629.02610.21260.28090.81020.0251
84597606.9623578.161635.76360.24890.79220.79220.0668
85593605.2216572.036638.40720.23520.68640.79950.0801
86590602.6366565.1977640.07560.25410.6930.76240.0838
87580596.4827554.8641638.10140.21880.61990.72170.0628
88574584.6133538.8527630.37390.32470.57830.69060.0286
89573577.4594527.5708627.3480.43050.55410.65940.0214
90573579.7277525.7087633.74680.40360.59640.65150.0369
91620630.5738572.4101688.73760.36080.97380.62650.5211
92626640.2643577.933702.59560.32690.7380.63840.6384


Univariate ARIMA Extrapolation Forecast Performance
time% S.E.PEMAPESq.EMSERMSE
810.0106-0.00161e-040.98570.08210.2866
820.0157-0.01760.0015120.880310.07343.1739
830.0204-0.01630.001496.83898.06992.8408
840.0242-0.01640.001499.24718.27062.8759
850.028-0.02020.0017149.368512.44743.5281
860.0317-0.0210.0017159.684413.3073.6479
870.0356-0.02760.0023271.680922.64014.7582
880.0399-0.01820.0015112.64219.38683.0638
890.0441-0.00776e-0419.88641.65721.2873
900.0475-0.01160.00145.26223.77181.9421
910.0471-0.01680.0014111.80599.31723.0524
920.0497-0.02230.0019203.470616.95594.1178

\begin{tabular}{lllllllll}
\hline
Univariate ARIMA Extrapolation Forecast Performance \tabularnewline
time & % S.E. & PE & MAPE & Sq.E & MSE & RMSE \tabularnewline
81 & 0.0106 & -0.0016 & 1e-04 & 0.9857 & 0.0821 & 0.2866 \tabularnewline
82 & 0.0157 & -0.0176 & 0.0015 & 120.8803 & 10.0734 & 3.1739 \tabularnewline
83 & 0.0204 & -0.0163 & 0.0014 & 96.8389 & 8.0699 & 2.8408 \tabularnewline
84 & 0.0242 & -0.0164 & 0.0014 & 99.2471 & 8.2706 & 2.8759 \tabularnewline
85 & 0.028 & -0.0202 & 0.0017 & 149.3685 & 12.4474 & 3.5281 \tabularnewline
86 & 0.0317 & -0.021 & 0.0017 & 159.6844 & 13.307 & 3.6479 \tabularnewline
87 & 0.0356 & -0.0276 & 0.0023 & 271.6809 & 22.6401 & 4.7582 \tabularnewline
88 & 0.0399 & -0.0182 & 0.0015 & 112.6421 & 9.3868 & 3.0638 \tabularnewline
89 & 0.0441 & -0.0077 & 6e-04 & 19.8864 & 1.6572 & 1.2873 \tabularnewline
90 & 0.0475 & -0.0116 & 0.001 & 45.2622 & 3.7718 & 1.9421 \tabularnewline
91 & 0.0471 & -0.0168 & 0.0014 & 111.8059 & 9.3172 & 3.0524 \tabularnewline
92 & 0.0497 & -0.0223 & 0.0019 & 203.4706 & 16.9559 & 4.1178 \tabularnewline
\hline
\end{tabular}
%Source: https://freestatistics.org/blog/index.php?pk=3377&T=2

[TABLE]
[ROW][C]Univariate ARIMA Extrapolation Forecast Performance[/C][/ROW]
[ROW][C]time[/C][C]% S.E.[/C][C]PE[/C][C]MAPE[/C][C]Sq.E[/C][C]MSE[/C][C]RMSE[/C][/ROW]
[ROW][C]81[/C][C]0.0106[/C][C]-0.0016[/C][C]1e-04[/C][C]0.9857[/C][C]0.0821[/C][C]0.2866[/C][/ROW]
[ROW][C]82[/C][C]0.0157[/C][C]-0.0176[/C][C]0.0015[/C][C]120.8803[/C][C]10.0734[/C][C]3.1739[/C][/ROW]
[ROW][C]83[/C][C]0.0204[/C][C]-0.0163[/C][C]0.0014[/C][C]96.8389[/C][C]8.0699[/C][C]2.8408[/C][/ROW]
[ROW][C]84[/C][C]0.0242[/C][C]-0.0164[/C][C]0.0014[/C][C]99.2471[/C][C]8.2706[/C][C]2.8759[/C][/ROW]
[ROW][C]85[/C][C]0.028[/C][C]-0.0202[/C][C]0.0017[/C][C]149.3685[/C][C]12.4474[/C][C]3.5281[/C][/ROW]
[ROW][C]86[/C][C]0.0317[/C][C]-0.021[/C][C]0.0017[/C][C]159.6844[/C][C]13.307[/C][C]3.6479[/C][/ROW]
[ROW][C]87[/C][C]0.0356[/C][C]-0.0276[/C][C]0.0023[/C][C]271.6809[/C][C]22.6401[/C][C]4.7582[/C][/ROW]
[ROW][C]88[/C][C]0.0399[/C][C]-0.0182[/C][C]0.0015[/C][C]112.6421[/C][C]9.3868[/C][C]3.0638[/C][/ROW]
[ROW][C]89[/C][C]0.0441[/C][C]-0.0077[/C][C]6e-04[/C][C]19.8864[/C][C]1.6572[/C][C]1.2873[/C][/ROW]
[ROW][C]90[/C][C]0.0475[/C][C]-0.0116[/C][C]0.001[/C][C]45.2622[/C][C]3.7718[/C][C]1.9421[/C][/ROW]
[ROW][C]91[/C][C]0.0471[/C][C]-0.0168[/C][C]0.0014[/C][C]111.8059[/C][C]9.3172[/C][C]3.0524[/C][/ROW]
[ROW][C]92[/C][C]0.0497[/C][C]-0.0223[/C][C]0.0019[/C][C]203.4706[/C][C]16.9559[/C][C]4.1178[/C][/ROW]
[/TABLE]
Source: https://freestatistics.org/blog/index.php?pk=3377&T=2

Globally Unique Identifier (entire table): ba.freestatistics.org/blog/index.php?pk=3377&T=2

As an alternative you can also use a QR Code:  

The GUIDs for individual cells are displayed in the table below:

Univariate ARIMA Extrapolation Forecast Performance
time% S.E.PEMAPESq.EMSERMSE
810.0106-0.00161e-040.98570.08210.2866
820.0157-0.01760.0015120.880310.07343.1739
830.0204-0.01630.001496.83898.06992.8408
840.0242-0.01640.001499.24718.27062.8759
850.028-0.02020.0017149.368512.44743.5281
860.0317-0.0210.0017159.684413.3073.6479
870.0356-0.02760.0023271.680922.64014.7582
880.0399-0.01820.0015112.64219.38683.0638
890.0441-0.00776e-0419.88641.65721.2873
900.0475-0.01160.00145.26223.77181.9421
910.0471-0.01680.0014111.80599.31723.0524
920.0497-0.02230.0019203.470616.95594.1178


Parameters (Session):
par1 = 12 ; par2 = 1 ; par3 = 2 ; par4 = 1 ; par5 = 12 ; par6 = 0 ; par7 = 1 ; par8 = 1 ; par9 = 0 ; par10 = FALSE ;
Parameters (R input):
par1 = 12 ; par2 = 1 ; par3 = 2 ; par4 = 1 ; par5 = 12 ; par6 = 0 ; par7 = 1 ; par8 = 1 ; par9 = 0 ; par10 = FALSE ;
R code (references can be found in the software module):
par1 <- as.numeric(par1) #cut off periods
par2 <- as.numeric(par2) #lambda
par3 <- as.numeric(par3) #degree of non-seasonal differencing
par4 <- as.numeric(par4) #degree of seasonal differencing
par5 <- as.numeric(par5) #seasonal period
par6 <- as.numeric(par6) #p
par7 <- as.numeric(par7) #q
par8 <- as.numeric(par8) #P
par9 <- as.numeric(par9) #Q
if (par10 == 'TRUE') par10 <- TRUE
if (par10 == 'FALSE') par10 <- FALSE
if (par2 == 0) x <- log(x)
if (par2 != 0) x <- x^par2
lx <- length(x)
first <- lx - 2*par1
nx <- lx - par1
nx1 <- nx + 1
fx <- lx - nx
if (fx < 1) {
fx <- par5
nx1 <- lx + fx - 1
first <- lx - 2*fx
}
first <- 1
if (fx < 3) fx <- round(lx/10,0)
(arima.out <- arima(x[1:nx], order=c(par6,par3,par7), seasonal=list(order=c(par8,par4,par9), period=par5), include.mean=par10, method='ML'))
(forecast <- predict(arima.out,fx))
(lb <- forecast$pred - 1.96 * forecast$se)
(ub <- forecast$pred + 1.96 * forecast$se)
if (par2 == 0) {
x <- exp(x)
forecast$pred <- exp(forecast$pred)
lb <- exp(lb)
ub <- exp(ub)
}
if (par2 != 0) {
x <- x^(1/par2)
forecast$pred <- forecast$pred^(1/par2)
lb <- lb^(1/par2)
ub <- ub^(1/par2)
}
(actandfor <- c(x[1:nx], forecast$pred))
(perc.se <- (ub-forecast$pred)/1.96/forecast$pred)
bitmap(file='test1.png')
opar <- par(mar=c(4,4,2,2),las=1)
ylim <- c( min(x[first:nx],lb), max(x[first:nx],ub))
plot(x,ylim=ylim,type='n',xlim=c(first,lx))
usr <- par('usr')
rect(usr[1],usr[3],nx+1,usr[4],border=NA,col='lemonchiffon')
rect(nx1,usr[3],usr[2],usr[4],border=NA,col='lavender')
abline(h= (-3:3)*2 , col ='gray', lty =3)
polygon( c(nx1:lx,lx:nx1), c(lb,rev(ub)), col = 'orange', lty=2,border=NA)
lines(nx1:lx, lb , lty=2)
lines(nx1:lx, ub , lty=2)
lines(x, lwd=2)
lines(nx1:lx, forecast$pred , lwd=2 , col ='white')
box()
par(opar)
dev.off()
prob.dec <- array(NA, dim=fx)
prob.sdec <- array(NA, dim=fx)
prob.ldec <- array(NA, dim=fx)
prob.pval <- array(NA, dim=fx)
perf.pe <- array(0, dim=fx)
perf.mape <- array(0, dim=fx)
perf.se <- array(0, dim=fx)
perf.mse <- array(0, dim=fx)
perf.rmse <- array(0, dim=fx)
for (i in 1:fx) {
locSD <- (ub[i] - forecast$pred[i]) / 1.96
perf.pe[i] = (x[nx+i] - forecast$pred[i]) / forecast$pred[i]
perf.mape[i] = perf.mape[i] + abs(perf.pe[i])
perf.se[i] = (x[nx+i] - forecast$pred[i])^2
perf.mse[i] = perf.mse[i] + perf.se[i]
prob.dec[i] = pnorm((x[nx+i-1] - forecast$pred[i]) / locSD)
prob.sdec[i] = pnorm((x[nx+i-par5] - forecast$pred[i]) / locSD)
prob.ldec[i] = pnorm((x[nx] - forecast$pred[i]) / locSD)
prob.pval[i] = pnorm(abs(x[nx+i] - forecast$pred[i]) / locSD)
}
perf.mape = perf.mape / fx
perf.mse = perf.mse / fx
perf.rmse = sqrt(perf.mse)
bitmap(file='test2.png')
plot(forecast$pred, pch=19, type='b',main='ARIMA Extrapolation Forecast', ylab='Forecast and 95% CI', xlab='time',ylim=c(min(lb),max(ub)))
dum <- forecast$pred
dum[1:12] <- x[(nx+1):lx]
lines(dum, lty=1)
lines(ub,lty=3)
lines(lb,lty=3)
dev.off()
load(file='createtable')
a<-table.start()
a<-table.row.start(a)
a<-table.element(a,'Univariate ARIMA Extrapolation Forecast',9,TRUE)
a<-table.row.end(a)
a<-table.row.start(a)
a<-table.element(a,'time',1,header=TRUE)
a<-table.element(a,'Y[t]',1,header=TRUE)
a<-table.element(a,'F[t]',1,header=TRUE)
a<-table.element(a,'95% LB',1,header=TRUE)
a<-table.element(a,'95% UB',1,header=TRUE)
a<-table.element(a,'p-value
(H0: Y[t] = F[t])',1,header=TRUE)
a<-table.element(a,'P(F[t]>Y[t-1])',1,header=TRUE)
a<-table.element(a,'P(F[t]>Y[t-s])',1,header=TRUE)
mylab <- paste('P(F[t]>Y[',nx,sep='')
mylab <- paste(mylab,'])',sep='')
a<-table.element(a,mylab,1,header=TRUE)
a<-table.row.end(a)
for (i in (nx-par5):nx) {
a<-table.row.start(a)
a<-table.element(a,i,header=TRUE)
a<-table.element(a,x[i])
a<-table.element(a,'-')
a<-table.row.end(a)
}
for (i in 1:fx) {
a<-table.row.start(a)
a<-table.element(a,nx+i,header=TRUE)
a<-table.element(a,round(x[nx+i],4))
a<-table.element(a,round(forecast$pred[i],4))
a<-table.element(a,round(lb[i],4))
a<-table.element(a,round(ub[i],4))
a<-table.element(a,round((1-prob.pval[i]),4))
a<-table.element(a,round((1-prob.dec[i]),4))
a<-table.element(a,round((1-prob.sdec[i]),4))
a<-table.element(a,round((1-prob.ldec[i]),4))
a<-table.row.end(a)
}
a<-table.end(a)
table.save(a,file='mytable.tab')
a<-table.start()
a<-table.row.start(a)
a<-table.element(a,'Univariate ARIMA Extrapolation Forecast Performance',7,TRUE)
a<-table.row.end(a)
a<-table.row.start(a)
a<-table.element(a,'time',1,header=TRUE)
a<-table.element(a,'% S.E.',1,header=TRUE)
a<-table.element(a,'PE',1,header=TRUE)
a<-table.element(a,'MAPE',1,header=TRUE)
a<-table.element(a,'Sq.E',1,header=TRUE)
a<-table.element(a,'MSE',1,header=TRUE)
a<-table.element(a,'RMSE',1,header=TRUE)
a<-table.row.end(a)
for (i in 1:fx) {
a<-table.row.start(a)
a<-table.element(a,nx+i,header=TRUE)
a<-table.element(a,round(perc.se[i],4))
a<-table.element(a,round(perf.pe[i],4))
a<-table.element(a,round(perf.mape[i],4))
a<-table.element(a,round(perf.se[i],4))
a<-table.element(a,round(perf.mse[i],4))
a<-table.element(a,round(perf.rmse[i],4))
a<-table.row.end(a)
}
a<-table.end(a)
table.save(a,file='mytable1.tab')