Free Statistics

of Irreproducible Research!

Author's title

Author*Unverified author*
R Software Modulerwasp_autocorrelation.wasp
Title produced by software(Partial) Autocorrelation Function
Date of computationTue, 11 Dec 2007 12:28:52 -0700
Cite this page as followsStatistical Computations at FreeStatistics.org, Office for Research Development and Education, URL https://freestatistics.org/blog/index.php?v=date/2007/Dec/11/t1197400445z65oxasqa1k2sdi.htm/, Retrieved Sun, 28 Apr 2024 19:45:57 +0000
Statistical Computations at FreeStatistics.org, Office for Research Development and Education, URL https://freestatistics.org/blog/index.php?pk=3161, Retrieved Sun, 28 Apr 2024 19:45:57 +0000
QR Codes:

Original text written by user:
IsPrivate?No (this computation is public)
User-defined keywords
Estimated Impact207
Family? (F = Feedback message, R = changed R code, M = changed R Module, P = changed Parameters, D = changed Data)
-       [(Partial) Autocorrelation Function] [Inducing stationa...] [2007-12-11 19:28:52] [578856645eee7b4b8f74dcf589866e9b] [Current]
Feedback Forum

Post a new message
Dataseries X:
0.9383
0.9217
0.9095
0.892
0.8742
0.8532
0.8607
0.9005
0.9111
0.9059
0.8883
0.8924
0.8833
0.87
0.8758
0.8858
0.917
0.9554
0.9922
0.9778
0.9808
0.9811
1.0014
1.0183
1.0622
1.0773
1.0807
1.0848
1.1582
1.1663
1.1372
1.1139
1.1222
1.1692
1.1702
1.2286
1.2613
1.2646
1.2262
1.1985
1.2007
1.2138
1.2266
1.2176
1.2218
1.249
1.2991
1.3408
1.3119
1.3014
1.3201
1.2938
1.2694
1.2165
1.2037
1.2292
1.2256
1.2015
1.1786
1.1856
1.2103
1.1938
1.202
1.2271
1.277
1.265
1.2684
1.2811
1.2727
1.2611
1.2881
1.3213


Summary of compuational transaction
Raw Inputview raw input (R code)
Raw Outputview raw output of R engine
Computing time1 seconds
R Server'Gwilym Jenkins' @ 72.249.127.135

\begin{tabular}{lllllllll}
\hline
Summary of compuational transaction \tabularnewline
Raw Input & view raw input (R code)  \tabularnewline
Raw Output & view raw output of R engine  \tabularnewline
Computing time & 1 seconds \tabularnewline
R Server & 'Gwilym Jenkins' @ 72.249.127.135 \tabularnewline
\hline
\end{tabular}
%Source: https://freestatistics.org/blog/index.php?pk=3161&T=0

[TABLE]
[ROW][C]Summary of compuational transaction[/C][/ROW]
[ROW][C]Raw Input[/C][C]view raw input (R code) [/C][/ROW]
[ROW][C]Raw Output[/C][C]view raw output of R engine [/C][/ROW]
[ROW][C]Computing time[/C][C]1 seconds[/C][/ROW]
[ROW][C]R Server[/C][C]'Gwilym Jenkins' @ 72.249.127.135[/C][/ROW]
[/TABLE]
Source: https://freestatistics.org/blog/index.php?pk=3161&T=0

Globally Unique Identifier (entire table): ba.freestatistics.org/blog/index.php?pk=3161&T=0

As an alternative you can also use a QR Code:  

The GUIDs for individual cells are displayed in the table below:

Summary of compuational transaction
Raw Inputview raw input (R code)
Raw Outputview raw output of R engine
Computing time1 seconds
R Server'Gwilym Jenkins' @ 72.249.127.135


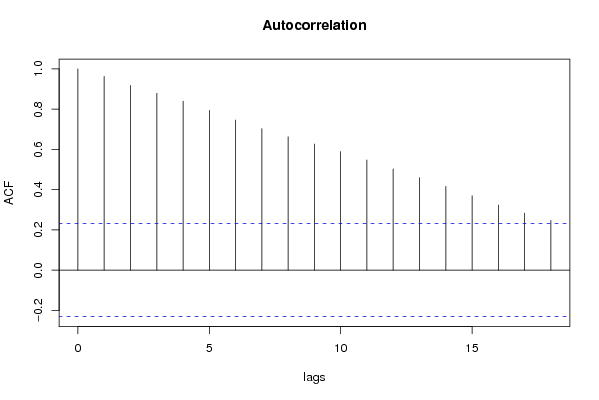
Autocorrelation Function
Time lag kACF(k)T-STATP-value
018.48530
10.9625668.16760
20.9181337.79060
30.8788397.45720
40.8395517.12380
50.7937966.73560
60.7458746.3290
70.7030555.96560
80.662585.62220
90.626715.31781e-06
100.5893335.00072e-06
110.5478914.6497e-06
120.5028424.26683e-05
130.459863.9020.000106
140.4162253.53180.000362
150.3697023.1370.001236
160.3233262.74350.003833
170.2833552.40430.009388

\begin{tabular}{lllllllll}
\hline
Autocorrelation Function \tabularnewline
Time lag k & ACF(k) & T-STAT & P-value \tabularnewline
0 & 1 & 8.4853 & 0 \tabularnewline
1 & 0.962566 & 8.1676 & 0 \tabularnewline
2 & 0.918133 & 7.7906 & 0 \tabularnewline
3 & 0.878839 & 7.4572 & 0 \tabularnewline
4 & 0.839551 & 7.1238 & 0 \tabularnewline
5 & 0.793796 & 6.7356 & 0 \tabularnewline
6 & 0.745874 & 6.329 & 0 \tabularnewline
7 & 0.703055 & 5.9656 & 0 \tabularnewline
8 & 0.66258 & 5.6222 & 0 \tabularnewline
9 & 0.62671 & 5.3178 & 1e-06 \tabularnewline
10 & 0.589333 & 5.0007 & 2e-06 \tabularnewline
11 & 0.547891 & 4.649 & 7e-06 \tabularnewline
12 & 0.502842 & 4.2668 & 3e-05 \tabularnewline
13 & 0.45986 & 3.902 & 0.000106 \tabularnewline
14 & 0.416225 & 3.5318 & 0.000362 \tabularnewline
15 & 0.369702 & 3.137 & 0.001236 \tabularnewline
16 & 0.323326 & 2.7435 & 0.003833 \tabularnewline
17 & 0.283355 & 2.4043 & 0.009388 \tabularnewline
\hline
\end{tabular}
%Source: https://freestatistics.org/blog/index.php?pk=3161&T=1

[TABLE]
[ROW][C]Autocorrelation Function[/C][/ROW]
[ROW][C]Time lag k[/C][C]ACF(k)[/C][C]T-STAT[/C][C]P-value[/C][/ROW]
[ROW][C]0[/C][C]1[/C][C]8.4853[/C][C]0[/C][/ROW]
[ROW][C]1[/C][C]0.962566[/C][C]8.1676[/C][C]0[/C][/ROW]
[ROW][C]2[/C][C]0.918133[/C][C]7.7906[/C][C]0[/C][/ROW]
[ROW][C]3[/C][C]0.878839[/C][C]7.4572[/C][C]0[/C][/ROW]
[ROW][C]4[/C][C]0.839551[/C][C]7.1238[/C][C]0[/C][/ROW]
[ROW][C]5[/C][C]0.793796[/C][C]6.7356[/C][C]0[/C][/ROW]
[ROW][C]6[/C][C]0.745874[/C][C]6.329[/C][C]0[/C][/ROW]
[ROW][C]7[/C][C]0.703055[/C][C]5.9656[/C][C]0[/C][/ROW]
[ROW][C]8[/C][C]0.66258[/C][C]5.6222[/C][C]0[/C][/ROW]
[ROW][C]9[/C][C]0.62671[/C][C]5.3178[/C][C]1e-06[/C][/ROW]
[ROW][C]10[/C][C]0.589333[/C][C]5.0007[/C][C]2e-06[/C][/ROW]
[ROW][C]11[/C][C]0.547891[/C][C]4.649[/C][C]7e-06[/C][/ROW]
[ROW][C]12[/C][C]0.502842[/C][C]4.2668[/C][C]3e-05[/C][/ROW]
[ROW][C]13[/C][C]0.45986[/C][C]3.902[/C][C]0.000106[/C][/ROW]
[ROW][C]14[/C][C]0.416225[/C][C]3.5318[/C][C]0.000362[/C][/ROW]
[ROW][C]15[/C][C]0.369702[/C][C]3.137[/C][C]0.001236[/C][/ROW]
[ROW][C]16[/C][C]0.323326[/C][C]2.7435[/C][C]0.003833[/C][/ROW]
[ROW][C]17[/C][C]0.283355[/C][C]2.4043[/C][C]0.009388[/C][/ROW]
[/TABLE]
Source: https://freestatistics.org/blog/index.php?pk=3161&T=1

Globally Unique Identifier (entire table): ba.freestatistics.org/blog/index.php?pk=3161&T=1

As an alternative you can also use a QR Code:  

The GUIDs for individual cells are displayed in the table below:

Autocorrelation Function
Time lag kACF(k)T-STATP-value
018.48530
10.9625668.16760
20.9181337.79060
30.8788397.45720
40.8395517.12380
50.7937966.73560
60.7458746.3290
70.7030555.96560
80.662585.62220
90.626715.31781e-06
100.5893335.00072e-06
110.5478914.6497e-06
120.5028424.26683e-05
130.459863.9020.000106
140.4162253.53180.000362
150.3697023.1370.001236
160.3233262.74350.003833
170.2833552.40430.009388


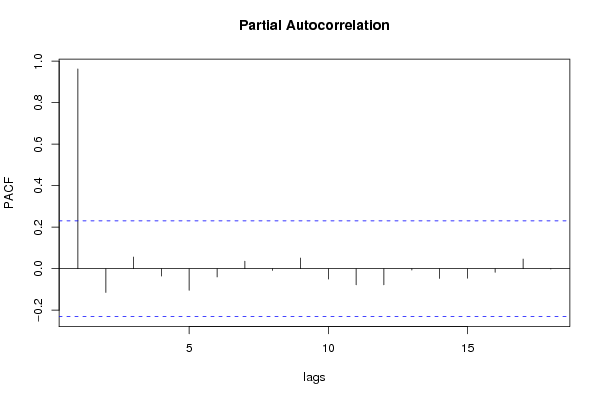
Partial Autocorrelation Function
Time lag kPACF(k)T-STATP-value
00.9625668.16760
1-0.11435-0.97030.832425
20.056360.47820.316967
3-0.035204-0.29870.616991
4-0.104149-0.88370.81011
5-0.039802-0.33770.631727
60.0360450.30590.380301
7-0.008101-0.06870.527305
80.0513980.43610.332024
9-0.050146-0.42550.66413
10-0.077416-0.65690.743329
11-0.077823-0.66040.744432
12-0.006513-0.05530.521961
13-0.047-0.39880.654393
14-0.045577-0.38670.649953
15-0.017373-0.14740.558391
160.0466490.39580.3467
17-0.001495-0.01270.505043

\begin{tabular}{lllllllll}
\hline
Partial Autocorrelation Function \tabularnewline
Time lag k & PACF(k) & T-STAT & P-value \tabularnewline
0 & 0.962566 & 8.1676 & 0 \tabularnewline
1 & -0.11435 & -0.9703 & 0.832425 \tabularnewline
2 & 0.05636 & 0.4782 & 0.316967 \tabularnewline
3 & -0.035204 & -0.2987 & 0.616991 \tabularnewline
4 & -0.104149 & -0.8837 & 0.81011 \tabularnewline
5 & -0.039802 & -0.3377 & 0.631727 \tabularnewline
6 & 0.036045 & 0.3059 & 0.380301 \tabularnewline
7 & -0.008101 & -0.0687 & 0.527305 \tabularnewline
8 & 0.051398 & 0.4361 & 0.332024 \tabularnewline
9 & -0.050146 & -0.4255 & 0.66413 \tabularnewline
10 & -0.077416 & -0.6569 & 0.743329 \tabularnewline
11 & -0.077823 & -0.6604 & 0.744432 \tabularnewline
12 & -0.006513 & -0.0553 & 0.521961 \tabularnewline
13 & -0.047 & -0.3988 & 0.654393 \tabularnewline
14 & -0.045577 & -0.3867 & 0.649953 \tabularnewline
15 & -0.017373 & -0.1474 & 0.558391 \tabularnewline
16 & 0.046649 & 0.3958 & 0.3467 \tabularnewline
17 & -0.001495 & -0.0127 & 0.505043 \tabularnewline
\hline
\end{tabular}
%Source: https://freestatistics.org/blog/index.php?pk=3161&T=2

[TABLE]
[ROW][C]Partial Autocorrelation Function[/C][/ROW]
[ROW][C]Time lag k[/C][C]PACF(k)[/C][C]T-STAT[/C][C]P-value[/C][/ROW]
[ROW][C]0[/C][C]0.962566[/C][C]8.1676[/C][C]0[/C][/ROW]
[ROW][C]1[/C][C]-0.11435[/C][C]-0.9703[/C][C]0.832425[/C][/ROW]
[ROW][C]2[/C][C]0.05636[/C][C]0.4782[/C][C]0.316967[/C][/ROW]
[ROW][C]3[/C][C]-0.035204[/C][C]-0.2987[/C][C]0.616991[/C][/ROW]
[ROW][C]4[/C][C]-0.104149[/C][C]-0.8837[/C][C]0.81011[/C][/ROW]
[ROW][C]5[/C][C]-0.039802[/C][C]-0.3377[/C][C]0.631727[/C][/ROW]
[ROW][C]6[/C][C]0.036045[/C][C]0.3059[/C][C]0.380301[/C][/ROW]
[ROW][C]7[/C][C]-0.008101[/C][C]-0.0687[/C][C]0.527305[/C][/ROW]
[ROW][C]8[/C][C]0.051398[/C][C]0.4361[/C][C]0.332024[/C][/ROW]
[ROW][C]9[/C][C]-0.050146[/C][C]-0.4255[/C][C]0.66413[/C][/ROW]
[ROW][C]10[/C][C]-0.077416[/C][C]-0.6569[/C][C]0.743329[/C][/ROW]
[ROW][C]11[/C][C]-0.077823[/C][C]-0.6604[/C][C]0.744432[/C][/ROW]
[ROW][C]12[/C][C]-0.006513[/C][C]-0.0553[/C][C]0.521961[/C][/ROW]
[ROW][C]13[/C][C]-0.047[/C][C]-0.3988[/C][C]0.654393[/C][/ROW]
[ROW][C]14[/C][C]-0.045577[/C][C]-0.3867[/C][C]0.649953[/C][/ROW]
[ROW][C]15[/C][C]-0.017373[/C][C]-0.1474[/C][C]0.558391[/C][/ROW]
[ROW][C]16[/C][C]0.046649[/C][C]0.3958[/C][C]0.3467[/C][/ROW]
[ROW][C]17[/C][C]-0.001495[/C][C]-0.0127[/C][C]0.505043[/C][/ROW]
[/TABLE]
Source: https://freestatistics.org/blog/index.php?pk=3161&T=2

Globally Unique Identifier (entire table): ba.freestatistics.org/blog/index.php?pk=3161&T=2

As an alternative you can also use a QR Code:  

The GUIDs for individual cells are displayed in the table below:

Partial Autocorrelation Function
Time lag kPACF(k)T-STATP-value
00.9625668.16760
1-0.11435-0.97030.832425
20.056360.47820.316967
3-0.035204-0.29870.616991
4-0.104149-0.88370.81011
5-0.039802-0.33770.631727
60.0360450.30590.380301
7-0.008101-0.06870.527305
80.0513980.43610.332024
9-0.050146-0.42550.66413
10-0.077416-0.65690.743329
11-0.077823-0.66040.744432
12-0.006513-0.05530.521961
13-0.047-0.39880.654393
14-0.045577-0.38670.649953
15-0.017373-0.14740.558391
160.0466490.39580.3467
17-0.001495-0.01270.505043


Parameters (Session):
par1 = Default ; par2 = 1.6 ; par3 = 0 ; par4 = 0 ; par5 = 12 ;
Parameters (R input):
par1 = Default ; par2 = 1.6 ; par3 = 0 ; par4 = 0 ; par5 = 12 ;
R code (references can be found in the software module):
if (par1 == 'Default') {
par1 = 10*log10(length(x))
} else {
par1 <- as.numeric(par1)
}
par2 <- as.numeric(par2)
par3 <- as.numeric(par3)
par4 <- as.numeric(par4)
par5 <- as.numeric(par5)
if (par2 == 0) {
x <- log(x)
} else {
x <- (x ^ par2 - 1) / par2
}
if (par3 > 0) x <- diff(x,lag=1,difference=par3)
if (par4 > 0) x <- diff(x,lag=par5,difference=par4)
bitmap(file='pic1.png')
racf <- acf(x,par1,main='Autocorrelation',xlab='lags',ylab='ACF')
dev.off()
bitmap(file='pic2.png')
rpacf <- pacf(x,par1,main='Partial Autocorrelation',xlab='lags',ylab='PACF')
dev.off()
(myacf <- c(racf$acf))
(mypacf <- c(rpacf$acf))
lengthx <- length(x)
sqrtn <- sqrt(lengthx)
load(file='createtable')
a<-table.start()
a<-table.row.start(a)
a<-table.element(a,'Autocorrelation Function',4,TRUE)
a<-table.row.end(a)
a<-table.row.start(a)
a<-table.element(a,'Time lag k',header=TRUE)
a<-table.element(a,hyperlink('basics.htm','ACF(k)','click here for more information about the Autocorrelation Function'),header=TRUE)
a<-table.element(a,'T-STAT',header=TRUE)
a<-table.element(a,'P-value',header=TRUE)
a<-table.row.end(a)
for (i in 1:par1) {
a<-table.row.start(a)
a<-table.element(a,i-1,header=TRUE)
a<-table.element(a,round(myacf[i],6))
mytstat <- myacf[i]*sqrtn
a<-table.element(a,round(mytstat,4))
a<-table.element(a,round(1-pt(mytstat,lengthx),6))
a<-table.row.end(a)
}
a<-table.end(a)
table.save(a,file='mytable.tab')
a<-table.start()
a<-table.row.start(a)
a<-table.element(a,'Partial Autocorrelation Function',4,TRUE)
a<-table.row.end(a)
a<-table.row.start(a)
a<-table.element(a,'Time lag k',header=TRUE)
a<-table.element(a,hyperlink('basics.htm','PACF(k)','click here for more information about the Partial Autocorrelation Function'),header=TRUE)
a<-table.element(a,'T-STAT',header=TRUE)
a<-table.element(a,'P-value',header=TRUE)
a<-table.row.end(a)
for (i in 1:par1) {
a<-table.row.start(a)
a<-table.element(a,i-1,header=TRUE)
a<-table.element(a,round(mypacf[i],6))
mytstat <- mypacf[i]*sqrtn
a<-table.element(a,round(mytstat,4))
a<-table.element(a,round(1-pt(mytstat,lengthx),6))
a<-table.row.end(a)
}
a<-table.end(a)
table.save(a,file='mytable1.tab')