Free Statistics

of Irreproducible Research!

Author's title

Author*Unverified author*
R Software Modulerwasp_autocorrelation.wasp
Title produced by software(Partial) Autocorrelation Function
Date of computationTue, 11 Dec 2007 09:58:36 -0700
Cite this page as followsStatistical Computations at FreeStatistics.org, Office for Research Development and Education, URL https://freestatistics.org/blog/index.php?v=date/2007/Dec/11/t1197391467lgnnetmzbapdpaw.htm/, Retrieved Mon, 29 Apr 2024 00:42:24 +0000
Statistical Computations at FreeStatistics.org, Office for Research Development and Education, URL https://freestatistics.org/blog/index.php?pk=3132, Retrieved Mon, 29 Apr 2024 00:42:24 +0000
QR Codes:

Original text written by user:
IsPrivate?No (this computation is public)
User-defined keywords
Estimated Impact197
Family? (F = Feedback message, R = changed R code, M = changed R Module, P = changed Parameters, D = changed Data)
-       [(Partial) Autocorrelation Function] [Autocorrelatie me...] [2007-12-11 16:58:36] [ca5e0f9f346e091f4d0fe7e17f7dba21] [Current]
Feedback Forum

Post a new message
Dataseries X:
101,5
126,6
93,9
89,8
93,4
101,5
110,4
105,9
108,4
113,9
86,1
69,4
101,2
100,5
98
106,6
90,1
96,9
125,9
112
100
123,9
79,8
83,4
113,6
112,9
104
109,9
99
106,3
128,9
111,1
102,9
130
87
87,5
117,6
103,4
110,8
112,6
102,5
112,4
135,6
105,1
127,7
137
91
90,5
122,4
123,3
124,3
120
118,1
119
142,7
123,6
129,6
146,9
108,7
99,4


Summary of compuational transaction
Raw Inputview raw input (R code)
Raw Outputview raw output of R engine
Computing time2 seconds
R Server'Gwilym Jenkins' @ 72.249.127.135

\begin{tabular}{lllllllll}
\hline
Summary of compuational transaction \tabularnewline
Raw Input & view raw input (R code)  \tabularnewline
Raw Output & view raw output of R engine  \tabularnewline
Computing time & 2 seconds \tabularnewline
R Server & 'Gwilym Jenkins' @ 72.249.127.135 \tabularnewline
\hline
\end{tabular}
%Source: https://freestatistics.org/blog/index.php?pk=3132&T=0

[TABLE]
[ROW][C]Summary of compuational transaction[/C][/ROW]
[ROW][C]Raw Input[/C][C]view raw input (R code) [/C][/ROW]
[ROW][C]Raw Output[/C][C]view raw output of R engine [/C][/ROW]
[ROW][C]Computing time[/C][C]2 seconds[/C][/ROW]
[ROW][C]R Server[/C][C]'Gwilym Jenkins' @ 72.249.127.135[/C][/ROW]
[/TABLE]
Source: https://freestatistics.org/blog/index.php?pk=3132&T=0

Globally Unique Identifier (entire table): ba.freestatistics.org/blog/index.php?pk=3132&T=0

As an alternative you can also use a QR Code:  

The GUIDs for individual cells are displayed in the table below:

Summary of compuational transaction
Raw Inputview raw input (R code)
Raw Outputview raw output of R engine
Computing time2 seconds
R Server'Gwilym Jenkins' @ 72.249.127.135


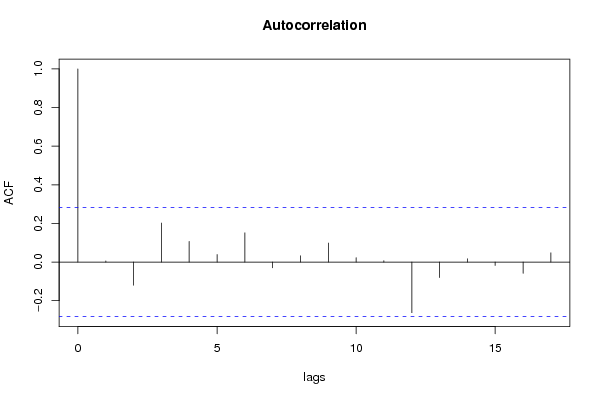
Autocorrelation Function
Time lag kACF(k)T-STATP-value
016.92820
10.0057950.04020.48407
2-0.119795-0.830.794667
30.2020471.39980.083998
40.1069680.74110.231123
50.0389450.26980.394229
60.1514481.04930.149656
7-0.029756-0.20620.581229
80.0324160.22460.411628
90.0980710.67950.250056
100.0224070.15520.438641
110.0070360.04870.480661
12-0.262112-1.8160.962188
13-0.080472-0.55750.710119
140.0167630.11610.454014
15-0.017979-0.12460.549306
16-0.058715-0.40680.657015

\begin{tabular}{lllllllll}
\hline
Autocorrelation Function \tabularnewline
Time lag k & ACF(k) & T-STAT & P-value \tabularnewline
0 & 1 & 6.9282 & 0 \tabularnewline
1 & 0.005795 & 0.0402 & 0.48407 \tabularnewline
2 & -0.119795 & -0.83 & 0.794667 \tabularnewline
3 & 0.202047 & 1.3998 & 0.083998 \tabularnewline
4 & 0.106968 & 0.7411 & 0.231123 \tabularnewline
5 & 0.038945 & 0.2698 & 0.394229 \tabularnewline
6 & 0.151448 & 1.0493 & 0.149656 \tabularnewline
7 & -0.029756 & -0.2062 & 0.581229 \tabularnewline
8 & 0.032416 & 0.2246 & 0.411628 \tabularnewline
9 & 0.098071 & 0.6795 & 0.250056 \tabularnewline
10 & 0.022407 & 0.1552 & 0.438641 \tabularnewline
11 & 0.007036 & 0.0487 & 0.480661 \tabularnewline
12 & -0.262112 & -1.816 & 0.962188 \tabularnewline
13 & -0.080472 & -0.5575 & 0.710119 \tabularnewline
14 & 0.016763 & 0.1161 & 0.454014 \tabularnewline
15 & -0.017979 & -0.1246 & 0.549306 \tabularnewline
16 & -0.058715 & -0.4068 & 0.657015 \tabularnewline
\hline
\end{tabular}
%Source: https://freestatistics.org/blog/index.php?pk=3132&T=1

[TABLE]
[ROW][C]Autocorrelation Function[/C][/ROW]
[ROW][C]Time lag k[/C][C]ACF(k)[/C][C]T-STAT[/C][C]P-value[/C][/ROW]
[ROW][C]0[/C][C]1[/C][C]6.9282[/C][C]0[/C][/ROW]
[ROW][C]1[/C][C]0.005795[/C][C]0.0402[/C][C]0.48407[/C][/ROW]
[ROW][C]2[/C][C]-0.119795[/C][C]-0.83[/C][C]0.794667[/C][/ROW]
[ROW][C]3[/C][C]0.202047[/C][C]1.3998[/C][C]0.083998[/C][/ROW]
[ROW][C]4[/C][C]0.106968[/C][C]0.7411[/C][C]0.231123[/C][/ROW]
[ROW][C]5[/C][C]0.038945[/C][C]0.2698[/C][C]0.394229[/C][/ROW]
[ROW][C]6[/C][C]0.151448[/C][C]1.0493[/C][C]0.149656[/C][/ROW]
[ROW][C]7[/C][C]-0.029756[/C][C]-0.2062[/C][C]0.581229[/C][/ROW]
[ROW][C]8[/C][C]0.032416[/C][C]0.2246[/C][C]0.411628[/C][/ROW]
[ROW][C]9[/C][C]0.098071[/C][C]0.6795[/C][C]0.250056[/C][/ROW]
[ROW][C]10[/C][C]0.022407[/C][C]0.1552[/C][C]0.438641[/C][/ROW]
[ROW][C]11[/C][C]0.007036[/C][C]0.0487[/C][C]0.480661[/C][/ROW]
[ROW][C]12[/C][C]-0.262112[/C][C]-1.816[/C][C]0.962188[/C][/ROW]
[ROW][C]13[/C][C]-0.080472[/C][C]-0.5575[/C][C]0.710119[/C][/ROW]
[ROW][C]14[/C][C]0.016763[/C][C]0.1161[/C][C]0.454014[/C][/ROW]
[ROW][C]15[/C][C]-0.017979[/C][C]-0.1246[/C][C]0.549306[/C][/ROW]
[ROW][C]16[/C][C]-0.058715[/C][C]-0.4068[/C][C]0.657015[/C][/ROW]
[/TABLE]
Source: https://freestatistics.org/blog/index.php?pk=3132&T=1

Globally Unique Identifier (entire table): ba.freestatistics.org/blog/index.php?pk=3132&T=1

As an alternative you can also use a QR Code:  

The GUIDs for individual cells are displayed in the table below:

Autocorrelation Function
Time lag kACF(k)T-STATP-value
016.92820
10.0057950.04020.48407
2-0.119795-0.830.794667
30.2020471.39980.083998
40.1069680.74110.231123
50.0389450.26980.394229
60.1514481.04930.149656
7-0.029756-0.20620.581229
80.0324160.22460.411628
90.0980710.67950.250056
100.0224070.15520.438641
110.0070360.04870.480661
12-0.262112-1.8160.962188
13-0.080472-0.55750.710119
140.0167630.11610.454014
15-0.017979-0.12460.549306
16-0.058715-0.40680.657015


Partial Autocorrelation Function
Time lag kPACF(k)T-STATP-value
00.0057950.04020.48407
1-0.119833-0.83020.79474
20.2064911.43060.079509
30.0900230.62370.267888
40.0894820.61990.269112
50.1421710.9850.164784
6-0.059864-0.41480.659915
70.0375710.26030.397873
80.0179160.12410.450866
90.0144460.10010.460347
100.0026680.01850.492664
11-0.335867-2.3270.987883
12-0.109932-0.76160.774998
13-0.113381-0.78550.781997
140.0526970.36510.358323
150.0474390.32870.371919
160.1393460.96540.169588

\begin{tabular}{lllllllll}
\hline
Partial Autocorrelation Function \tabularnewline
Time lag k & PACF(k) & T-STAT & P-value \tabularnewline
0 & 0.005795 & 0.0402 & 0.48407 \tabularnewline
1 & -0.119833 & -0.8302 & 0.79474 \tabularnewline
2 & 0.206491 & 1.4306 & 0.079509 \tabularnewline
3 & 0.090023 & 0.6237 & 0.267888 \tabularnewline
4 & 0.089482 & 0.6199 & 0.269112 \tabularnewline
5 & 0.142171 & 0.985 & 0.164784 \tabularnewline
6 & -0.059864 & -0.4148 & 0.659915 \tabularnewline
7 & 0.037571 & 0.2603 & 0.397873 \tabularnewline
8 & 0.017916 & 0.1241 & 0.450866 \tabularnewline
9 & 0.014446 & 0.1001 & 0.460347 \tabularnewline
10 & 0.002668 & 0.0185 & 0.492664 \tabularnewline
11 & -0.335867 & -2.327 & 0.987883 \tabularnewline
12 & -0.109932 & -0.7616 & 0.774998 \tabularnewline
13 & -0.113381 & -0.7855 & 0.781997 \tabularnewline
14 & 0.052697 & 0.3651 & 0.358323 \tabularnewline
15 & 0.047439 & 0.3287 & 0.371919 \tabularnewline
16 & 0.139346 & 0.9654 & 0.169588 \tabularnewline
\hline
\end{tabular}
%Source: https://freestatistics.org/blog/index.php?pk=3132&T=2

[TABLE]
[ROW][C]Partial Autocorrelation Function[/C][/ROW]
[ROW][C]Time lag k[/C][C]PACF(k)[/C][C]T-STAT[/C][C]P-value[/C][/ROW]
[ROW][C]0[/C][C]0.005795[/C][C]0.0402[/C][C]0.48407[/C][/ROW]
[ROW][C]1[/C][C]-0.119833[/C][C]-0.8302[/C][C]0.79474[/C][/ROW]
[ROW][C]2[/C][C]0.206491[/C][C]1.4306[/C][C]0.079509[/C][/ROW]
[ROW][C]3[/C][C]0.090023[/C][C]0.6237[/C][C]0.267888[/C][/ROW]
[ROW][C]4[/C][C]0.089482[/C][C]0.6199[/C][C]0.269112[/C][/ROW]
[ROW][C]5[/C][C]0.142171[/C][C]0.985[/C][C]0.164784[/C][/ROW]
[ROW][C]6[/C][C]-0.059864[/C][C]-0.4148[/C][C]0.659915[/C][/ROW]
[ROW][C]7[/C][C]0.037571[/C][C]0.2603[/C][C]0.397873[/C][/ROW]
[ROW][C]8[/C][C]0.017916[/C][C]0.1241[/C][C]0.450866[/C][/ROW]
[ROW][C]9[/C][C]0.014446[/C][C]0.1001[/C][C]0.460347[/C][/ROW]
[ROW][C]10[/C][C]0.002668[/C][C]0.0185[/C][C]0.492664[/C][/ROW]
[ROW][C]11[/C][C]-0.335867[/C][C]-2.327[/C][C]0.987883[/C][/ROW]
[ROW][C]12[/C][C]-0.109932[/C][C]-0.7616[/C][C]0.774998[/C][/ROW]
[ROW][C]13[/C][C]-0.113381[/C][C]-0.7855[/C][C]0.781997[/C][/ROW]
[ROW][C]14[/C][C]0.052697[/C][C]0.3651[/C][C]0.358323[/C][/ROW]
[ROW][C]15[/C][C]0.047439[/C][C]0.3287[/C][C]0.371919[/C][/ROW]
[ROW][C]16[/C][C]0.139346[/C][C]0.9654[/C][C]0.169588[/C][/ROW]
[/TABLE]
Source: https://freestatistics.org/blog/index.php?pk=3132&T=2

Globally Unique Identifier (entire table): ba.freestatistics.org/blog/index.php?pk=3132&T=2

As an alternative you can also use a QR Code:  

The GUIDs for individual cells are displayed in the table below:

Partial Autocorrelation Function
Time lag kPACF(k)T-STATP-value
00.0057950.04020.48407
1-0.119833-0.83020.79474
20.2064911.43060.079509
30.0900230.62370.267888
40.0894820.61990.269112
50.1421710.9850.164784
6-0.059864-0.41480.659915
70.0375710.26030.397873
80.0179160.12410.450866
90.0144460.10010.460347
100.0026680.01850.492664
11-0.335867-2.3270.987883
12-0.109932-0.76160.774998
13-0.113381-0.78550.781997
140.0526970.36510.358323
150.0474390.32870.371919
160.1393460.96540.169588


Parameters (Session):
par1 = Default ; par2 = 1 ; par3 = 0 ; par4 = 1 ; par5 = 12 ;
Parameters (R input):
par1 = Default ; par2 = 1 ; par3 = 0 ; par4 = 1 ; par5 = 12 ;
R code (references can be found in the software module):
if (par1 == 'Default') {
par1 = 10*log10(length(x))
} else {
par1 <- as.numeric(par1)
}
par2 <- as.numeric(par2)
par3 <- as.numeric(par3)
par4 <- as.numeric(par4)
par5 <- as.numeric(par5)
if (par2 == 0) {
x <- log(x)
} else {
x <- (x ^ par2 - 1) / par2
}
if (par3 > 0) x <- diff(x,lag=1,difference=par3)
if (par4 > 0) x <- diff(x,lag=par5,difference=par4)
bitmap(file='pic1.png')
racf <- acf(x,par1,main='Autocorrelation',xlab='lags',ylab='ACF')
dev.off()
bitmap(file='pic2.png')
rpacf <- pacf(x,par1,main='Partial Autocorrelation',xlab='lags',ylab='PACF')
dev.off()
(myacf <- c(racf$acf))
(mypacf <- c(rpacf$acf))
lengthx <- length(x)
sqrtn <- sqrt(lengthx)
load(file='createtable')
a<-table.start()
a<-table.row.start(a)
a<-table.element(a,'Autocorrelation Function',4,TRUE)
a<-table.row.end(a)
a<-table.row.start(a)
a<-table.element(a,'Time lag k',header=TRUE)
a<-table.element(a,hyperlink('basics.htm','ACF(k)','click here for more information about the Autocorrelation Function'),header=TRUE)
a<-table.element(a,'T-STAT',header=TRUE)
a<-table.element(a,'P-value',header=TRUE)
a<-table.row.end(a)
for (i in 1:par1) {
a<-table.row.start(a)
a<-table.element(a,i-1,header=TRUE)
a<-table.element(a,round(myacf[i],6))
mytstat <- myacf[i]*sqrtn
a<-table.element(a,round(mytstat,4))
a<-table.element(a,round(1-pt(mytstat,lengthx),6))
a<-table.row.end(a)
}
a<-table.end(a)
table.save(a,file='mytable.tab')
a<-table.start()
a<-table.row.start(a)
a<-table.element(a,'Partial Autocorrelation Function',4,TRUE)
a<-table.row.end(a)
a<-table.row.start(a)
a<-table.element(a,'Time lag k',header=TRUE)
a<-table.element(a,hyperlink('basics.htm','PACF(k)','click here for more information about the Partial Autocorrelation Function'),header=TRUE)
a<-table.element(a,'T-STAT',header=TRUE)
a<-table.element(a,'P-value',header=TRUE)
a<-table.row.end(a)
for (i in 1:par1) {
a<-table.row.start(a)
a<-table.element(a,i-1,header=TRUE)
a<-table.element(a,round(mypacf[i],6))
mytstat <- mypacf[i]*sqrtn
a<-table.element(a,round(mytstat,4))
a<-table.element(a,round(1-pt(mytstat,lengthx),6))
a<-table.row.end(a)
}
a<-table.end(a)
table.save(a,file='mytable1.tab')