Free Statistics

of Irreproducible Research!

Author's title

Author*Unverified author*
R Software Modulerwasp_pairs.wasp
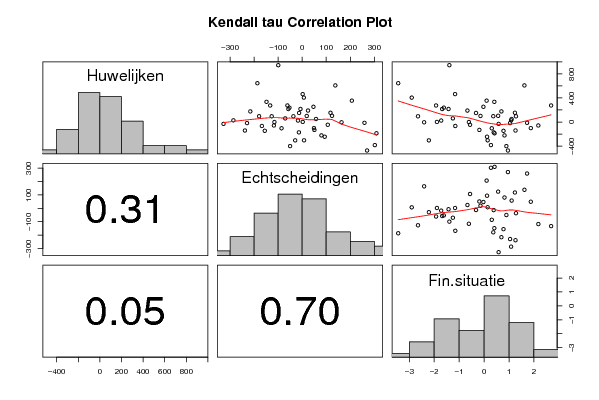
Title produced by softwareKendall tau Correlation Matrix
Date of computationTue, 11 Dec 2007 09:43:00 -0700
Cite this page as followsStatistical Computations at FreeStatistics.org, Office for Research Development and Education, URL https://freestatistics.org/blog/index.php?v=date/2007/Dec/11/t1197390535htk642tlsdztfbw.htm/, Retrieved Sun, 28 Apr 2024 19:37:51 +0000
Statistical Computations at FreeStatistics.org, Office for Research Development and Education, URL https://freestatistics.org/blog/index.php?pk=3128, Retrieved Sun, 28 Apr 2024 19:37:51 +0000
QR Codes:

Original text written by user:
IsPrivate?No (this computation is public)
User-defined keywords
Estimated Impact204
Family? (F = Feedback message, R = changed R code, M = changed R Module, P = changed Parameters, D = changed Data)
-       [Kendall tau Correlation Matrix] [PAPER RESIDU ] [2007-12-11 16:43:00] [e0964b90cb3acfe235da067e79729c23] [Current]
Feedback Forum

Post a new message
Dataseries X:
2,074996377	2,293994811	-1,892018822
153,6755174	117,7565127	1,235760721
103,4196238	124,0593836	0,563031786
216,1898032	-57,63118383	-1,681777069
335,3820105	-148,4807117	0,409391642
463,3705437	2,067407253	-1,163771183
-382,8200703	302,1252747	0,273844923
-186,9031405	308,9934276	0,419261998
-303,4154138	7,711016284	0,142069989
238,6742901	-53,06218801	-1,616052502
176,0761762	-215,8121082	0,69356418
96,57783568	-179,2793928	0,368288103
95,33921883	-36,66712334	1,277297206
216,6037348	-7,308481737	-1,42554929
274,9607427	-133,1500993	2,687348328
-244,1681739	93,76314183	0,117391693
354,9893264	206,619249	0,100325687
-17,81939426	-229,5349296	1,041133291
-12,85380621	259,0708568	1,723122897
943,6989083	-99,58126552	-1,393957144
-472,6073813	269,9669353	0,954507778
-100,888253	48,91481502	1,872948154
-304,0164742	-29,12063	-2,215147469
275,0929878	-61,5094603	-1,926013968
50,20149727	57,5987677	1,104353558
-30,68259605	-327,2439788	0,582607051
-399,52372	-50,22952022	0,89288225
-171,4074482	-13,61930104	0,384912275
-4,339155562	163,6860018	-2,405751477
100,9903684	18,89331263	-0,145150523
-45,12506111	106,4302721	-0,56354464
60,52427221	-70,56844503	-1,252593096
150,9095456	-12,83994858	-0,323909682
405,3066564	6,97089635	-2,902829867
-65,48005392	-167,8275625	-1,154904595
-103,4874919	-85,94257367	0,308168949
-130,7373627	50,78900794	-0,189829183
-57,03483193	-117,6915576	2,175477764
-145,5754633	-155,6069484	0,777371211
253,0943148	46,73153252	-0,027873566
28,20610726	-286,1272517	1,082335914
24,63196686	-17,53192217	-1,72111969
607,7026379	137,8713085	1,617255615
-0,307703691	-115,515968	-0,611267443
95,49117344	-126,7975933	-2,651404008
644,3581066	-186,4451633	-3,44540633
190,4962992	24,28894823	-0,668921862
-221,7566749	80,13347931	0,817370596
-140,3691816	-238,2445942	1,258840183


Summary of compuational transaction
Raw Inputview raw input (R code)
Raw Outputview raw output of R engine
Computing time1 seconds
R Server'Gwilym Jenkins' @ 72.249.127.135

\begin{tabular}{lllllllll}
\hline
Summary of compuational transaction \tabularnewline
Raw Input & view raw input (R code)  \tabularnewline
Raw Output & view raw output of R engine  \tabularnewline
Computing time & 1 seconds \tabularnewline
R Server & 'Gwilym Jenkins' @ 72.249.127.135 \tabularnewline
\hline
\end{tabular}
%Source: https://freestatistics.org/blog/index.php?pk=3128&T=0

[TABLE]
[ROW][C]Summary of compuational transaction[/C][/ROW]
[ROW][C]Raw Input[/C][C]view raw input (R code) [/C][/ROW]
[ROW][C]Raw Output[/C][C]view raw output of R engine [/C][/ROW]
[ROW][C]Computing time[/C][C]1 seconds[/C][/ROW]
[ROW][C]R Server[/C][C]'Gwilym Jenkins' @ 72.249.127.135[/C][/ROW]
[/TABLE]
Source: https://freestatistics.org/blog/index.php?pk=3128&T=0

Globally Unique Identifier (entire table): ba.freestatistics.org/blog/index.php?pk=3128&T=0

As an alternative you can also use a QR Code:  

The GUIDs for individual cells are displayed in the table below:

Summary of compuational transaction
Raw Inputview raw input (R code)
Raw Outputview raw output of R engine
Computing time1 seconds
R Server'Gwilym Jenkins' @ 72.249.127.135


Kendall tau rank correlations for all pairs of data series
pairtaup-value
tau( Huwelijken , Echtscheidingen )-0.1020408163265310.306743295473673
tau( Huwelijken , Fin.situatie )-0.1921768707482990.052102064215338
tau( Echtscheidingen , Fin.situatie )0.03911564625850340.699598769593089

\begin{tabular}{lllllllll}
\hline
Kendall tau rank correlations for all pairs of data series \tabularnewline
pair & tau & p-value \tabularnewline
tau( Huwelijken , Echtscheidingen ) & -0.102040816326531 & 0.306743295473673 \tabularnewline
tau( Huwelijken , Fin.situatie
 ) & -0.192176870748299 & 0.052102064215338 \tabularnewline
tau( Echtscheidingen , Fin.situatie
 ) & 0.0391156462585034 & 0.699598769593089 \tabularnewline
\hline
\end{tabular}
%Source: https://freestatistics.org/blog/index.php?pk=3128&T=1

[TABLE]
[ROW][C]Kendall tau rank correlations for all pairs of data series[/C][/ROW]
[ROW][C]pair[/C][C]tau[/C][C]p-value[/C][/ROW]
[ROW][C]tau( Huwelijken , Echtscheidingen )[/C][C]-0.102040816326531[/C][C]0.306743295473673[/C][/ROW]
[ROW][C]tau( Huwelijken , Fin.situatie
 )[/C][C]-0.192176870748299[/C][C]0.052102064215338[/C][/ROW]
[ROW][C]tau( Echtscheidingen , Fin.situatie
 )[/C][C]0.0391156462585034[/C][C]0.699598769593089[/C][/ROW]
[/TABLE]
Source: https://freestatistics.org/blog/index.php?pk=3128&T=1

Globally Unique Identifier (entire table): ba.freestatistics.org/blog/index.php?pk=3128&T=1

As an alternative you can also use a QR Code:  

The GUIDs for individual cells are displayed in the table below:

Kendall tau rank correlations for all pairs of data series
pairtaup-value
tau( Huwelijken , Echtscheidingen )-0.1020408163265310.306743295473673
tau( Huwelijken , Fin.situatie )-0.1921768707482990.052102064215338
tau( Echtscheidingen , Fin.situatie )0.03911564625850340.699598769593089


Parameters (Session):
Parameters (R input):
R code (references can be found in the software module):
panel.tau <- function(x, y, digits=2, prefix='', cex.cor)
{
usr <- par('usr'); on.exit(par(usr))
par(usr = c(0, 1, 0, 1))
rr <- cor.test(x, y, method='kendall')
r <- round(rr$p.value,2)
txt <- format(c(r, 0.123456789), digits=digits)[1]
txt <- paste(prefix, txt, sep='')
if(missing(cex.cor)) cex <- 0.5/strwidth(txt)
text(0.5, 0.5, txt, cex = cex)
}
panel.hist <- function(x, ...)
{
usr <- par('usr'); on.exit(par(usr))
par(usr = c(usr[1:2], 0, 1.5) )
h <- hist(x, plot = FALSE)
breaks <- h$breaks; nB <- length(breaks)
y <- h$counts; y <- y/max(y)
rect(breaks[-nB], 0, breaks[-1], y, col='grey', ...)
}
bitmap(file='test1.png')
pairs(t(y),diag.panel=panel.hist, upper.panel=panel.smooth, lower.panel=panel.tau, main=main)
dev.off()
load(file='createtable')
a<-table.start()
a<-table.row.start(a)
a<-table.element(a,'Kendall tau rank correlations for all pairs of data series',3,TRUE)
a<-table.row.end(a)
a<-table.row.start(a)
a<-table.element(a,'pair',1,TRUE)
a<-table.element(a,'tau',1,TRUE)
a<-table.element(a,'p-value',1,TRUE)
a<-table.row.end(a)
n <- length(y[,1])
n
cor.test(y[1,],y[2,],method='kendall')
for (i in 1:(n-1))
{
for (j in (i+1):n)
{
a<-table.row.start(a)
dum <- paste('tau(',dimnames(t(x))[[2]][i])
dum <- paste(dum,',')
dum <- paste(dum,dimnames(t(x))[[2]][j])
dum <- paste(dum,')')
a<-table.element(a,dum,header=TRUE)
r <- cor.test(y[i,],y[j,],method='kendall')
a<-table.element(a,r$estimate)
a<-table.element(a,r$p.value)
a<-table.row.end(a)
}
}
a<-table.end(a)
table.save(a,file='mytable.tab')