Free Statistics

of Irreproducible Research!

Author's title

Author*Unverified author*
R Software Modulerwasp_multipleregression.wasp
Title produced by softwareMultiple Regression
Date of computationMon, 10 Dec 2007 08:12:29 -0700
Cite this page as followsStatistical Computations at FreeStatistics.org, Office for Research Development and Education, URL https://freestatistics.org/blog/index.php?v=date/2007/Dec/10/t1197299002qy2r897nnxktj0l.htm/, Retrieved Mon, 06 May 2024 17:51:03 +0000
Statistical Computations at FreeStatistics.org, Office for Research Development and Education, URL https://freestatistics.org/blog/index.php?pk=2989, Retrieved Mon, 06 May 2024 17:51:03 +0000
QR Codes:

Original text written by user:
IsPrivate?No (this computation is public)
User-defined keywords
Estimated Impact258
Family? (F = Feedback message, R = changed R code, M = changed R Module, P = changed Parameters, D = changed Data)
-       [Multiple Regression] [Paper IX mltp regr] [2007-12-10 15:12:29] [fd802f308f037a9692de8c23f8b60e49] [Current]
Feedback Forum

Post a new message
Dataseries X:
1	0.76	0.4	37702
1.04	0.77	0.37	30364
1.02	0.76	0.36	32609
1.07	0.77	0.36	30212
1.12	0.78	0.36	29965
1.08	0.79	0.36	28352
1.02	0.78	0.32	25814
1.01	0.76	0.31	22414
1.04	0.78	0.32	20506
0.98	0.76	0.33	28806
0.95	0.74	0.33	22228
0.94	0.73	0.29	13971
0.94	0.72	0.33	36845
0.96	0.71	0.32	35338
0.97	0.73	0.31	35022
1.03	0.75	0.33	34777
1.01	0.75	0.32	26887
0.99	0.72	0.32	23970
1	0.72	0.3	22780
1	0.72	0.3	17351
1.02	0.74	0.33	21382
1.01	0.78	0.35	24561
0.99	0.74	0.35	17409
0.98	0.74	0.37	11514
1.01	0.75	0.38	31514
1.03	0.78	0.39	27071
1.03	0.81	0.4	29462
1	0.75	0.32	26105
0.96	0.7	0.29	22397
0.97	0.71	0.29	23843
0.98	0.71	0.3	21705
1.02	0.73	0.3	18089
1.04	0.74	0.32	20764
1.01	0.74	0.32	25316
1.01	0.75	0.34	17704
1	0.74	0.34	15548
1.01	0.74	0.34	28029
1.02	0.73	0.33	29383
1.03	0.76	0.33	36438
1.06	0.8	0.33	32034
1.12	0.83	0.34	22679
1.12	0.81	0.35	24319
1.13	0.83	0.34	18004
1.13	0.88	0.36	17537
1.13	0.89	0.39	20366
1.17	0.93	0.43	22782
1.14	0.91	0.42	19169
1.08	0.9	0.39	13807
1.07	0.86	0.37	29743
1.12	0.88	0.36	25591
1.14	0.93	0.39	29096
1.21	0.98	0.39	26482
1.2	0.97	0.37	22405
1.23	1.03	0.36	27044
1.29	1.06	0.38	17970
1.31	1.06	0.38	18730
1.37	1.08	0.44	19684
1.35	1.09	0.49	19785
1.26	1.04	0.47	18479
1.26	1	0.48	10698


Summary of compuational transaction
Raw Inputview raw input (R code)
Raw Outputview raw output of R engine
Computing time3 seconds
R Server'Gwilym Jenkins' @ 72.249.127.135

\begin{tabular}{lllllllll}
\hline
Summary of compuational transaction \tabularnewline
Raw Input & view raw input (R code)  \tabularnewline
Raw Output & view raw output of R engine  \tabularnewline
Computing time & 3 seconds \tabularnewline
R Server & 'Gwilym Jenkins' @ 72.249.127.135 \tabularnewline
\hline
\end{tabular}
%Source: https://freestatistics.org/blog/index.php?pk=2989&T=0

[TABLE]
[ROW][C]Summary of compuational transaction[/C][/ROW]
[ROW][C]Raw Input[/C][C]view raw input (R code) [/C][/ROW]
[ROW][C]Raw Output[/C][C]view raw output of R engine [/C][/ROW]
[ROW][C]Computing time[/C][C]3 seconds[/C][/ROW]
[ROW][C]R Server[/C][C]'Gwilym Jenkins' @ 72.249.127.135[/C][/ROW]
[/TABLE]
Source: https://freestatistics.org/blog/index.php?pk=2989&T=0

Globally Unique Identifier (entire table): ba.freestatistics.org/blog/index.php?pk=2989&T=0

As an alternative you can also use a QR Code:  

The GUIDs for individual cells are displayed in the table below:

Summary of compuational transaction
Raw Inputview raw input (R code)
Raw Outputview raw output of R engine
Computing time3 seconds
R Server'Gwilym Jenkins' @ 72.249.127.135


Multiple Linear Regression - Estimated Regression Equation
Personenwagens[t] = + 38757.9296737345 -6100.47698271832Eurosuperbenzine[t] -19155.6727897649Diesel[t] + 21792.8613239085LPG[t] + e[t]

\begin{tabular}{lllllllll}
\hline
Multiple Linear Regression - Estimated Regression Equation \tabularnewline
Personenwagens[t] =  +  38757.9296737345 -6100.47698271832Eurosuperbenzine[t] -19155.6727897649Diesel[t] +  21792.8613239085LPG[t]  + e[t] \tabularnewline
\hline
\end{tabular}
%Source: https://freestatistics.org/blog/index.php?pk=2989&T=1

[TABLE]
[ROW][C]Multiple Linear Regression - Estimated Regression Equation[/C][/ROW]
[ROW][C]Personenwagens[t] =  +  38757.9296737345 -6100.47698271832Eurosuperbenzine[t] -19155.6727897649Diesel[t] +  21792.8613239085LPG[t]  + e[t][/C][/ROW]
[/TABLE]
Source: https://freestatistics.org/blog/index.php?pk=2989&T=1

Globally Unique Identifier (entire table): ba.freestatistics.org/blog/index.php?pk=2989&T=1

As an alternative you can also use a QR Code:  

The GUIDs for individual cells are displayed in the table below:

Multiple Linear Regression - Estimated Regression Equation
Personenwagens[t] = + 38757.9296737345 -6100.47698271832Eurosuperbenzine[t] -19155.6727897649Diesel[t] + 21792.8613239085LPG[t] + e[t]


Multiple Linear Regression - Ordinary Least Squares
VariableParameterS.D.T-STATH0: parameter = 02-tail p-value1-tail p-value
(Intercept)38757.929673734511275.8168133.43730.0011150.000557
Eurosuperbenzine-6100.4769827183228565.29279-0.21360.8316640.415832
Diesel-19155.672789764928730.533687-0.66670.5076790.253839
LPG21792.861323908528880.2700620.75460.4536550.226827

\begin{tabular}{lllllllll}
\hline
Multiple Linear Regression - Ordinary Least Squares \tabularnewline
Variable & Parameter & S.D. & T-STATH0: parameter = 0 & 2-tail p-value & 1-tail p-value \tabularnewline
(Intercept) & 38757.9296737345 & 11275.816813 & 3.4373 & 0.001115 & 0.000557 \tabularnewline
Eurosuperbenzine & -6100.47698271832 & 28565.29279 & -0.2136 & 0.831664 & 0.415832 \tabularnewline
Diesel & -19155.6727897649 & 28730.533687 & -0.6667 & 0.507679 & 0.253839 \tabularnewline
LPG & 21792.8613239085 & 28880.270062 & 0.7546 & 0.453655 & 0.226827 \tabularnewline
\hline
\end{tabular}
%Source: https://freestatistics.org/blog/index.php?pk=2989&T=2

[TABLE]
[ROW][C]Multiple Linear Regression - Ordinary Least Squares[/C][/ROW]
[ROW][C]Variable[/C][C]Parameter[/C][C]S.D.[/C][C]T-STATH0: parameter = 0[/C][C]2-tail p-value[/C][C]1-tail p-value[/C][/ROW]
[ROW][C](Intercept)[/C][C]38757.9296737345[/C][C]11275.816813[/C][C]3.4373[/C][C]0.001115[/C][C]0.000557[/C][/ROW]
[ROW][C]Eurosuperbenzine[/C][C]-6100.47698271832[/C][C]28565.29279[/C][C]-0.2136[/C][C]0.831664[/C][C]0.415832[/C][/ROW]
[ROW][C]Diesel[/C][C]-19155.6727897649[/C][C]28730.533687[/C][C]-0.6667[/C][C]0.507679[/C][C]0.253839[/C][/ROW]
[ROW][C]LPG[/C][C]21792.8613239085[/C][C]28880.270062[/C][C]0.7546[/C][C]0.453655[/C][C]0.226827[/C][/ROW]
[/TABLE]
Source: https://freestatistics.org/blog/index.php?pk=2989&T=2

Globally Unique Identifier (entire table): ba.freestatistics.org/blog/index.php?pk=2989&T=2

As an alternative you can also use a QR Code:  

The GUIDs for individual cells are displayed in the table below:

Multiple Linear Regression - Ordinary Least Squares
VariableParameterS.D.T-STATH0: parameter = 02-tail p-value1-tail p-value
(Intercept)38757.929673734511275.8168133.43730.0011150.000557
Eurosuperbenzine-6100.4769827183228565.29279-0.21360.8316640.415832
Diesel-19155.672789764928730.533687-0.66670.5076790.253839
LPG21792.861323908528880.2700620.75460.4536550.226827


Multiple Linear Regression - Regression Statistics
Multiple R0.316689214034048
R-squared0.100292058285503
Adjusted R-squared0.052093418550798
F-TEST (value)2.08080682022419
F-TEST (DF numerator)3
F-TEST (DF denominator)56
p-value0.113061609476628
Multiple Linear Regression - Residual Statistics
Residual Standard Deviation6292.56516133407
Sum Squared Residuals2217397073.33957

\begin{tabular}{lllllllll}
\hline
Multiple Linear Regression - Regression Statistics \tabularnewline
Multiple R & 0.316689214034048 \tabularnewline
R-squared & 0.100292058285503 \tabularnewline
Adjusted R-squared & 0.052093418550798 \tabularnewline
F-TEST (value) & 2.08080682022419 \tabularnewline
F-TEST (DF numerator) & 3 \tabularnewline
F-TEST (DF denominator) & 56 \tabularnewline
p-value & 0.113061609476628 \tabularnewline
Multiple Linear Regression - Residual Statistics \tabularnewline
Residual Standard Deviation & 6292.56516133407 \tabularnewline
Sum Squared Residuals & 2217397073.33957 \tabularnewline
\hline
\end{tabular}
%Source: https://freestatistics.org/blog/index.php?pk=2989&T=3

[TABLE]
[ROW][C]Multiple Linear Regression - Regression Statistics[/C][/ROW]
[ROW][C]Multiple R[/C][C]0.316689214034048[/C][/ROW]
[ROW][C]R-squared[/C][C]0.100292058285503[/C][/ROW]
[ROW][C]Adjusted R-squared[/C][C]0.052093418550798[/C][/ROW]
[ROW][C]F-TEST (value)[/C][C]2.08080682022419[/C][/ROW]
[ROW][C]F-TEST (DF numerator)[/C][C]3[/C][/ROW]
[ROW][C]F-TEST (DF denominator)[/C][C]56[/C][/ROW]
[ROW][C]p-value[/C][C]0.113061609476628[/C][/ROW]
[ROW][C]Multiple Linear Regression - Residual Statistics[/C][/ROW]
[ROW][C]Residual Standard Deviation[/C][C]6292.56516133407[/C][/ROW]
[ROW][C]Sum Squared Residuals[/C][C]2217397073.33957[/C][/ROW]
[/TABLE]
Source: https://freestatistics.org/blog/index.php?pk=2989&T=3

Globally Unique Identifier (entire table): ba.freestatistics.org/blog/index.php?pk=2989&T=3

As an alternative you can also use a QR Code:  

The GUIDs for individual cells are displayed in the table below:

Multiple Linear Regression - Regression Statistics
Multiple R0.316689214034048
R-squared0.100292058285503
Adjusted R-squared0.052093418550798
F-TEST (value)2.08080682022419
F-TEST (DF numerator)3
F-TEST (DF denominator)56
p-value0.113061609476628
Multiple Linear Regression - Residual Statistics
Residual Standard Deviation6292.56516133407
Sum Squared Residuals2217397073.33957


Multiple Linear Regression - Actuals, Interpolation, and Residuals
Time or IndexActualsInterpolationForecastResidualsPrediction Error
13770226816.285900358310885.7140996417
23036425726.92425343464637.07574656537
33260925822.56190774766786.43809225244
43021225325.9813307144886.01866928601
52996524829.40075368045135.59924631957
62835224881.86310509153470.13689490849
72581424567.73399899591246.26600100408
82241424793.9236113793-2379.92361137932
92050624445.7244593416-3939.72445934156
102880625412.79514733903393.20485266096
112222825978.9229126159-3750.92291261589
121397125359.7699573844-11388.7699573844
133684526423.041138238410421.9588617616
143533826274.65971324269063.34028675744
153502225612.6128743819409.387125619
163477725299.32802610089477.67197389923
172688725203.40895251611683.59104748395
182397025900.0886758634-1930.08867586337
192278025403.226679558-2623.22667955801
201735125403.226679558-8052.22667955801
212138225551.8895238256-4169.8895238256
222456125282.5246085404-721.524608540359
231740926170.7610597853-8761.76105978532
241151426667.6230560907-15153.6230560907
253151426510.98063195065003.01936804944
262707126032.22952184231038.77047815767
272946225675.48795138853786.51204861153
282610525264.4137223432840.586277656764
292239725812.4306014230-3415.43060142296
302384325559.8691036981-1716.86910369813
312170525716.7929471100-4011.79294711003
321808925089.660412006-7000.660412006
332076425211.9513709322-4447.95137093215
342531625394.9656804137-78.9656804137012
351770425639.2661789942-7935.26617899422
361554825891.8276767191-10343.8276767191
372802925830.82290689192198.17709310813
382938325743.44625172333639.55374827675
393643825107.771298203111330.2287017969
403203424158.5300771317875.46992286902
412267923435.759887714-756.759887714016
422431924036.8019567484282.198043251605
431800423374.7551178868-5370.75511788683
441753722852.8287048768-5315.82870487676
452036623315.0578166964-2949.05781669636
462278223176.5262787534-394.526278753373
471916923524.7254307911-4355.72543079114
481380723428.5249379346-9621.52493793463
492974323819.89939287425923.10060712576
502559122913.83347470392677.16652529606
512909622487.82613527866608.17386472141
522648221103.00910700015378.99089299994
532240520919.71337824671485.28662175328
542704419369.43008814027674.56991185981
551797018864.5885119623-894.588511962318
561873018742.5789723080-12.5789723079513
571968419301.0085769841382.991423015939
581978520321.1044549362-536.104454936201
591847921392.0737963909-2913.07379639093
601069822376.2293212206-11678.2293212206

\begin{tabular}{lllllllll}
\hline
Multiple Linear Regression - Actuals, Interpolation, and Residuals \tabularnewline
Time or Index & Actuals & InterpolationForecast & ResidualsPrediction Error \tabularnewline
1 & 37702 & 26816.2859003583 & 10885.7140996417 \tabularnewline
2 & 30364 & 25726.9242534346 & 4637.07574656537 \tabularnewline
3 & 32609 & 25822.5619077476 & 6786.43809225244 \tabularnewline
4 & 30212 & 25325.981330714 & 4886.01866928601 \tabularnewline
5 & 29965 & 24829.4007536804 & 5135.59924631957 \tabularnewline
6 & 28352 & 24881.8631050915 & 3470.13689490849 \tabularnewline
7 & 25814 & 24567.7339989959 & 1246.26600100408 \tabularnewline
8 & 22414 & 24793.9236113793 & -2379.92361137932 \tabularnewline
9 & 20506 & 24445.7244593416 & -3939.72445934156 \tabularnewline
10 & 28806 & 25412.7951473390 & 3393.20485266096 \tabularnewline
11 & 22228 & 25978.9229126159 & -3750.92291261589 \tabularnewline
12 & 13971 & 25359.7699573844 & -11388.7699573844 \tabularnewline
13 & 36845 & 26423.0411382384 & 10421.9588617616 \tabularnewline
14 & 35338 & 26274.6597132426 & 9063.34028675744 \tabularnewline
15 & 35022 & 25612.612874381 & 9409.387125619 \tabularnewline
16 & 34777 & 25299.3280261008 & 9477.67197389923 \tabularnewline
17 & 26887 & 25203.4089525161 & 1683.59104748395 \tabularnewline
18 & 23970 & 25900.0886758634 & -1930.08867586337 \tabularnewline
19 & 22780 & 25403.226679558 & -2623.22667955801 \tabularnewline
20 & 17351 & 25403.226679558 & -8052.22667955801 \tabularnewline
21 & 21382 & 25551.8895238256 & -4169.8895238256 \tabularnewline
22 & 24561 & 25282.5246085404 & -721.524608540359 \tabularnewline
23 & 17409 & 26170.7610597853 & -8761.76105978532 \tabularnewline
24 & 11514 & 26667.6230560907 & -15153.6230560907 \tabularnewline
25 & 31514 & 26510.9806319506 & 5003.01936804944 \tabularnewline
26 & 27071 & 26032.2295218423 & 1038.77047815767 \tabularnewline
27 & 29462 & 25675.4879513885 & 3786.51204861153 \tabularnewline
28 & 26105 & 25264.4137223432 & 840.586277656764 \tabularnewline
29 & 22397 & 25812.4306014230 & -3415.43060142296 \tabularnewline
30 & 23843 & 25559.8691036981 & -1716.86910369813 \tabularnewline
31 & 21705 & 25716.7929471100 & -4011.79294711003 \tabularnewline
32 & 18089 & 25089.660412006 & -7000.660412006 \tabularnewline
33 & 20764 & 25211.9513709322 & -4447.95137093215 \tabularnewline
34 & 25316 & 25394.9656804137 & -78.9656804137012 \tabularnewline
35 & 17704 & 25639.2661789942 & -7935.26617899422 \tabularnewline
36 & 15548 & 25891.8276767191 & -10343.8276767191 \tabularnewline
37 & 28029 & 25830.8229068919 & 2198.17709310813 \tabularnewline
38 & 29383 & 25743.4462517233 & 3639.55374827675 \tabularnewline
39 & 36438 & 25107.7712982031 & 11330.2287017969 \tabularnewline
40 & 32034 & 24158.530077131 & 7875.46992286902 \tabularnewline
41 & 22679 & 23435.759887714 & -756.759887714016 \tabularnewline
42 & 24319 & 24036.8019567484 & 282.198043251605 \tabularnewline
43 & 18004 & 23374.7551178868 & -5370.75511788683 \tabularnewline
44 & 17537 & 22852.8287048768 & -5315.82870487676 \tabularnewline
45 & 20366 & 23315.0578166964 & -2949.05781669636 \tabularnewline
46 & 22782 & 23176.5262787534 & -394.526278753373 \tabularnewline
47 & 19169 & 23524.7254307911 & -4355.72543079114 \tabularnewline
48 & 13807 & 23428.5249379346 & -9621.52493793463 \tabularnewline
49 & 29743 & 23819.8993928742 & 5923.10060712576 \tabularnewline
50 & 25591 & 22913.8334747039 & 2677.16652529606 \tabularnewline
51 & 29096 & 22487.8261352786 & 6608.17386472141 \tabularnewline
52 & 26482 & 21103.0091070001 & 5378.99089299994 \tabularnewline
53 & 22405 & 20919.7133782467 & 1485.28662175328 \tabularnewline
54 & 27044 & 19369.4300881402 & 7674.56991185981 \tabularnewline
55 & 17970 & 18864.5885119623 & -894.588511962318 \tabularnewline
56 & 18730 & 18742.5789723080 & -12.5789723079513 \tabularnewline
57 & 19684 & 19301.0085769841 & 382.991423015939 \tabularnewline
58 & 19785 & 20321.1044549362 & -536.104454936201 \tabularnewline
59 & 18479 & 21392.0737963909 & -2913.07379639093 \tabularnewline
60 & 10698 & 22376.2293212206 & -11678.2293212206 \tabularnewline
\hline
\end{tabular}
%Source: https://freestatistics.org/blog/index.php?pk=2989&T=4

[TABLE]
[ROW][C]Multiple Linear Regression - Actuals, Interpolation, and Residuals[/C][/ROW]
[ROW][C]Time or Index[/C][C]Actuals[/C][C]InterpolationForecast[/C][C]ResidualsPrediction Error[/C][/ROW]
[ROW][C]1[/C][C]37702[/C][C]26816.2859003583[/C][C]10885.7140996417[/C][/ROW]
[ROW][C]2[/C][C]30364[/C][C]25726.9242534346[/C][C]4637.07574656537[/C][/ROW]
[ROW][C]3[/C][C]32609[/C][C]25822.5619077476[/C][C]6786.43809225244[/C][/ROW]
[ROW][C]4[/C][C]30212[/C][C]25325.981330714[/C][C]4886.01866928601[/C][/ROW]
[ROW][C]5[/C][C]29965[/C][C]24829.4007536804[/C][C]5135.59924631957[/C][/ROW]
[ROW][C]6[/C][C]28352[/C][C]24881.8631050915[/C][C]3470.13689490849[/C][/ROW]
[ROW][C]7[/C][C]25814[/C][C]24567.7339989959[/C][C]1246.26600100408[/C][/ROW]
[ROW][C]8[/C][C]22414[/C][C]24793.9236113793[/C][C]-2379.92361137932[/C][/ROW]
[ROW][C]9[/C][C]20506[/C][C]24445.7244593416[/C][C]-3939.72445934156[/C][/ROW]
[ROW][C]10[/C][C]28806[/C][C]25412.7951473390[/C][C]3393.20485266096[/C][/ROW]
[ROW][C]11[/C][C]22228[/C][C]25978.9229126159[/C][C]-3750.92291261589[/C][/ROW]
[ROW][C]12[/C][C]13971[/C][C]25359.7699573844[/C][C]-11388.7699573844[/C][/ROW]
[ROW][C]13[/C][C]36845[/C][C]26423.0411382384[/C][C]10421.9588617616[/C][/ROW]
[ROW][C]14[/C][C]35338[/C][C]26274.6597132426[/C][C]9063.34028675744[/C][/ROW]
[ROW][C]15[/C][C]35022[/C][C]25612.612874381[/C][C]9409.387125619[/C][/ROW]
[ROW][C]16[/C][C]34777[/C][C]25299.3280261008[/C][C]9477.67197389923[/C][/ROW]
[ROW][C]17[/C][C]26887[/C][C]25203.4089525161[/C][C]1683.59104748395[/C][/ROW]
[ROW][C]18[/C][C]23970[/C][C]25900.0886758634[/C][C]-1930.08867586337[/C][/ROW]
[ROW][C]19[/C][C]22780[/C][C]25403.226679558[/C][C]-2623.22667955801[/C][/ROW]
[ROW][C]20[/C][C]17351[/C][C]25403.226679558[/C][C]-8052.22667955801[/C][/ROW]
[ROW][C]21[/C][C]21382[/C][C]25551.8895238256[/C][C]-4169.8895238256[/C][/ROW]
[ROW][C]22[/C][C]24561[/C][C]25282.5246085404[/C][C]-721.524608540359[/C][/ROW]
[ROW][C]23[/C][C]17409[/C][C]26170.7610597853[/C][C]-8761.76105978532[/C][/ROW]
[ROW][C]24[/C][C]11514[/C][C]26667.6230560907[/C][C]-15153.6230560907[/C][/ROW]
[ROW][C]25[/C][C]31514[/C][C]26510.9806319506[/C][C]5003.01936804944[/C][/ROW]
[ROW][C]26[/C][C]27071[/C][C]26032.2295218423[/C][C]1038.77047815767[/C][/ROW]
[ROW][C]27[/C][C]29462[/C][C]25675.4879513885[/C][C]3786.51204861153[/C][/ROW]
[ROW][C]28[/C][C]26105[/C][C]25264.4137223432[/C][C]840.586277656764[/C][/ROW]
[ROW][C]29[/C][C]22397[/C][C]25812.4306014230[/C][C]-3415.43060142296[/C][/ROW]
[ROW][C]30[/C][C]23843[/C][C]25559.8691036981[/C][C]-1716.86910369813[/C][/ROW]
[ROW][C]31[/C][C]21705[/C][C]25716.7929471100[/C][C]-4011.79294711003[/C][/ROW]
[ROW][C]32[/C][C]18089[/C][C]25089.660412006[/C][C]-7000.660412006[/C][/ROW]
[ROW][C]33[/C][C]20764[/C][C]25211.9513709322[/C][C]-4447.95137093215[/C][/ROW]
[ROW][C]34[/C][C]25316[/C][C]25394.9656804137[/C][C]-78.9656804137012[/C][/ROW]
[ROW][C]35[/C][C]17704[/C][C]25639.2661789942[/C][C]-7935.26617899422[/C][/ROW]
[ROW][C]36[/C][C]15548[/C][C]25891.8276767191[/C][C]-10343.8276767191[/C][/ROW]
[ROW][C]37[/C][C]28029[/C][C]25830.8229068919[/C][C]2198.17709310813[/C][/ROW]
[ROW][C]38[/C][C]29383[/C][C]25743.4462517233[/C][C]3639.55374827675[/C][/ROW]
[ROW][C]39[/C][C]36438[/C][C]25107.7712982031[/C][C]11330.2287017969[/C][/ROW]
[ROW][C]40[/C][C]32034[/C][C]24158.530077131[/C][C]7875.46992286902[/C][/ROW]
[ROW][C]41[/C][C]22679[/C][C]23435.759887714[/C][C]-756.759887714016[/C][/ROW]
[ROW][C]42[/C][C]24319[/C][C]24036.8019567484[/C][C]282.198043251605[/C][/ROW]
[ROW][C]43[/C][C]18004[/C][C]23374.7551178868[/C][C]-5370.75511788683[/C][/ROW]
[ROW][C]44[/C][C]17537[/C][C]22852.8287048768[/C][C]-5315.82870487676[/C][/ROW]
[ROW][C]45[/C][C]20366[/C][C]23315.0578166964[/C][C]-2949.05781669636[/C][/ROW]
[ROW][C]46[/C][C]22782[/C][C]23176.5262787534[/C][C]-394.526278753373[/C][/ROW]
[ROW][C]47[/C][C]19169[/C][C]23524.7254307911[/C][C]-4355.72543079114[/C][/ROW]
[ROW][C]48[/C][C]13807[/C][C]23428.5249379346[/C][C]-9621.52493793463[/C][/ROW]
[ROW][C]49[/C][C]29743[/C][C]23819.8993928742[/C][C]5923.10060712576[/C][/ROW]
[ROW][C]50[/C][C]25591[/C][C]22913.8334747039[/C][C]2677.16652529606[/C][/ROW]
[ROW][C]51[/C][C]29096[/C][C]22487.8261352786[/C][C]6608.17386472141[/C][/ROW]
[ROW][C]52[/C][C]26482[/C][C]21103.0091070001[/C][C]5378.99089299994[/C][/ROW]
[ROW][C]53[/C][C]22405[/C][C]20919.7133782467[/C][C]1485.28662175328[/C][/ROW]
[ROW][C]54[/C][C]27044[/C][C]19369.4300881402[/C][C]7674.56991185981[/C][/ROW]
[ROW][C]55[/C][C]17970[/C][C]18864.5885119623[/C][C]-894.588511962318[/C][/ROW]
[ROW][C]56[/C][C]18730[/C][C]18742.5789723080[/C][C]-12.5789723079513[/C][/ROW]
[ROW][C]57[/C][C]19684[/C][C]19301.0085769841[/C][C]382.991423015939[/C][/ROW]
[ROW][C]58[/C][C]19785[/C][C]20321.1044549362[/C][C]-536.104454936201[/C][/ROW]
[ROW][C]59[/C][C]18479[/C][C]21392.0737963909[/C][C]-2913.07379639093[/C][/ROW]
[ROW][C]60[/C][C]10698[/C][C]22376.2293212206[/C][C]-11678.2293212206[/C][/ROW]
[/TABLE]
Source: https://freestatistics.org/blog/index.php?pk=2989&T=4

Globally Unique Identifier (entire table): ba.freestatistics.org/blog/index.php?pk=2989&T=4

As an alternative you can also use a QR Code:  

The GUIDs for individual cells are displayed in the table below:

Multiple Linear Regression - Actuals, Interpolation, and Residuals
Time or IndexActualsInterpolationForecastResidualsPrediction Error
13770226816.285900358310885.7140996417
23036425726.92425343464637.07574656537
33260925822.56190774766786.43809225244
43021225325.9813307144886.01866928601
52996524829.40075368045135.59924631957
62835224881.86310509153470.13689490849
72581424567.73399899591246.26600100408
82241424793.9236113793-2379.92361137932
92050624445.7244593416-3939.72445934156
102880625412.79514733903393.20485266096
112222825978.9229126159-3750.92291261589
121397125359.7699573844-11388.7699573844
133684526423.041138238410421.9588617616
143533826274.65971324269063.34028675744
153502225612.6128743819409.387125619
163477725299.32802610089477.67197389923
172688725203.40895251611683.59104748395
182397025900.0886758634-1930.08867586337
192278025403.226679558-2623.22667955801
201735125403.226679558-8052.22667955801
212138225551.8895238256-4169.8895238256
222456125282.5246085404-721.524608540359
231740926170.7610597853-8761.76105978532
241151426667.6230560907-15153.6230560907
253151426510.98063195065003.01936804944
262707126032.22952184231038.77047815767
272946225675.48795138853786.51204861153
282610525264.4137223432840.586277656764
292239725812.4306014230-3415.43060142296
302384325559.8691036981-1716.86910369813
312170525716.7929471100-4011.79294711003
321808925089.660412006-7000.660412006
332076425211.9513709322-4447.95137093215
342531625394.9656804137-78.9656804137012
351770425639.2661789942-7935.26617899422
361554825891.8276767191-10343.8276767191
372802925830.82290689192198.17709310813
382938325743.44625172333639.55374827675
393643825107.771298203111330.2287017969
403203424158.5300771317875.46992286902
412267923435.759887714-756.759887714016
422431924036.8019567484282.198043251605
431800423374.7551178868-5370.75511788683
441753722852.8287048768-5315.82870487676
452036623315.0578166964-2949.05781669636
462278223176.5262787534-394.526278753373
471916923524.7254307911-4355.72543079114
481380723428.5249379346-9621.52493793463
492974323819.89939287425923.10060712576
502559122913.83347470392677.16652529606
512909622487.82613527866608.17386472141
522648221103.00910700015378.99089299994
532240520919.71337824671485.28662175328
542704419369.43008814027674.56991185981
551797018864.5885119623-894.588511962318
561873018742.5789723080-12.5789723079513
571968419301.0085769841382.991423015939
581978520321.1044549362-536.104454936201
591847921392.0737963909-2913.07379639093
601069822376.2293212206-11678.2293212206


Parameters (Session):
par1 = 4 ; par2 = Do not include Seasonal Dummies ; par3 = No Linear Trend ;
Parameters (R input):
par1 = 4 ; par2 = Do not include Seasonal Dummies ; par3 = No Linear Trend ;
R code (references can be found in the software module):
library(lattice)
par1 <- as.numeric(par1)
x <- t(y)
k <- length(x[1,])
n <- length(x[,1])
x1 <- cbind(x[,par1], x[,1:k!=par1])
mycolnames <- c(colnames(x)[par1], colnames(x)[1:k!=par1])
colnames(x1) <- mycolnames #colnames(x)[par1]
x <- x1
if (par3 == 'First Differences'){
x2 <- array(0, dim=c(n-1,k), dimnames=list(1:(n-1), paste('(1-B)',colnames(x),sep='')))
for (i in 1:n-1) {
for (j in 1:k) {
x2[i,j] <- x[i+1,j] - x[i,j]
}
}
x <- x2
}
if (par2 == 'Include Monthly Dummies'){
x2 <- array(0, dim=c(n,11), dimnames=list(1:n, paste('M', seq(1:11), sep ='')))
for (i in 1:11){
x2[seq(i,n,12),i] <- 1
}
x <- cbind(x, x2)
}
if (par2 == 'Include Quarterly Dummies'){
x2 <- array(0, dim=c(n,3), dimnames=list(1:n, paste('Q', seq(1:3), sep ='')))
for (i in 1:3){
x2[seq(i,n,4),i] <- 1
}
x <- cbind(x, x2)
}
k <- length(x[1,])
if (par3 == 'Linear Trend'){
x <- cbind(x, c(1:n))
colnames(x)[k+1] <- 't'
}
x
k <- length(x[1,])
df <- as.data.frame(x)
(mylm <- lm(df))
(mysum <- summary(mylm))
bitmap(file='test0.png')
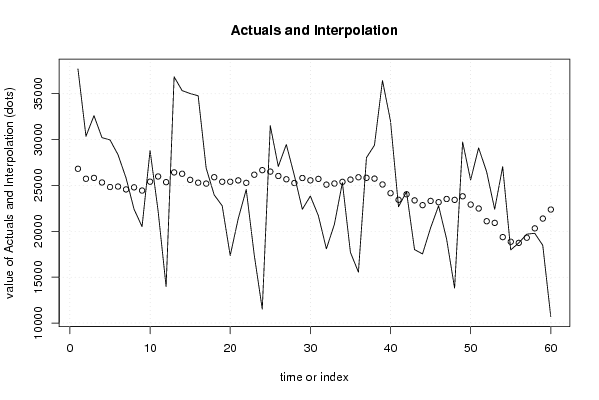
plot(x[,1], type='l', main='Actuals and Interpolation', ylab='value of Actuals and Interpolation (dots)', xlab='time or index')
points(x[,1]-mysum$resid)
grid()
dev.off()
bitmap(file='test1.png')
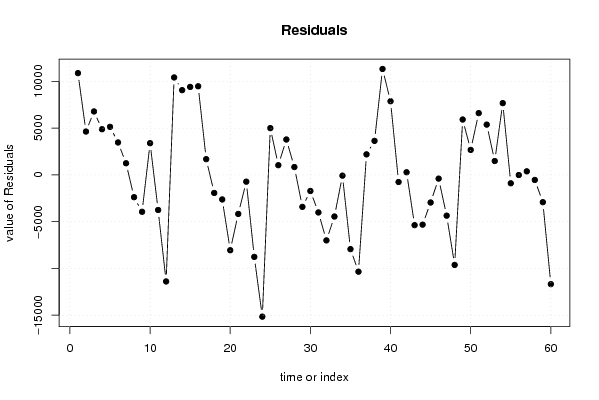
plot(mysum$resid, type='b', pch=19, main='Residuals', ylab='value of Residuals', xlab='time or index')
grid()
dev.off()
bitmap(file='test2.png')
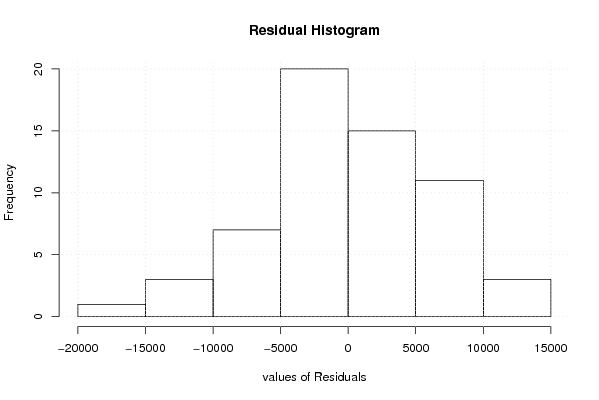
hist(mysum$resid, main='Residual Histogram', xlab='values of Residuals')
grid()
dev.off()
bitmap(file='test3.png')
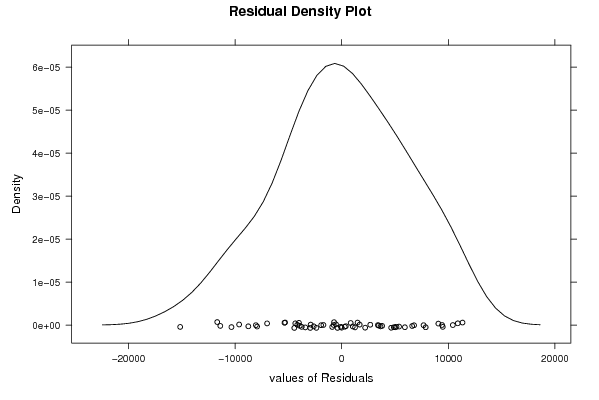
densityplot(~mysum$resid,col='black',main='Residual Density Plot', xlab='values of Residuals')
dev.off()
bitmap(file='test4.png')
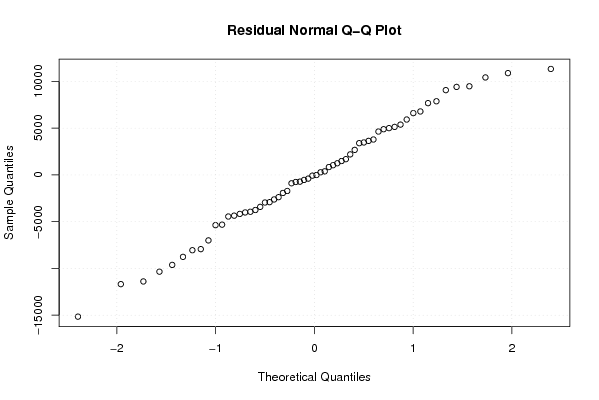
qqnorm(mysum$resid, main='Residual Normal Q-Q Plot')
grid()
dev.off()
(myerror <- as.ts(mysum$resid))
bitmap(file='test5.png')
dum <- cbind(lag(myerror,k=1),myerror)
dum
dum1 <- dum[2:length(myerror),]
dum1
z <- as.data.frame(dum1)
z
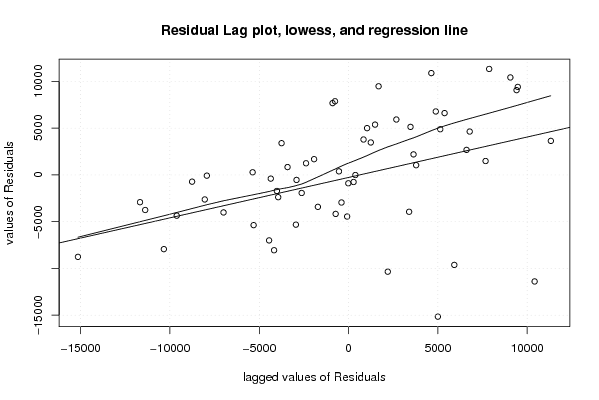
plot(z,main=paste('Residual Lag plot, lowess, and regression line'), ylab='values of Residuals', xlab='lagged values of Residuals')
lines(lowess(z))
abline(lm(z))
grid()
dev.off()
bitmap(file='test6.png')
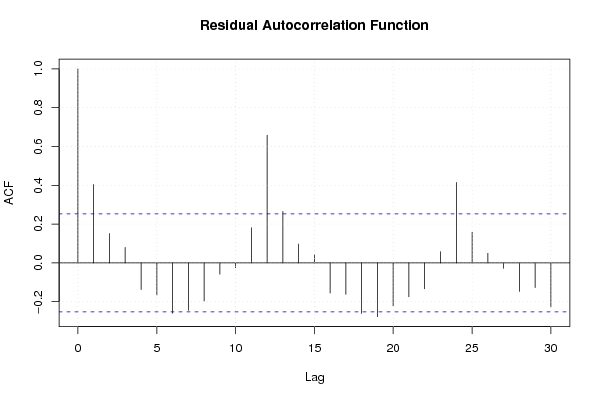
acf(mysum$resid, lag.max=length(mysum$resid)/2, main='Residual Autocorrelation Function')
grid()
dev.off()
bitmap(file='test7.png')
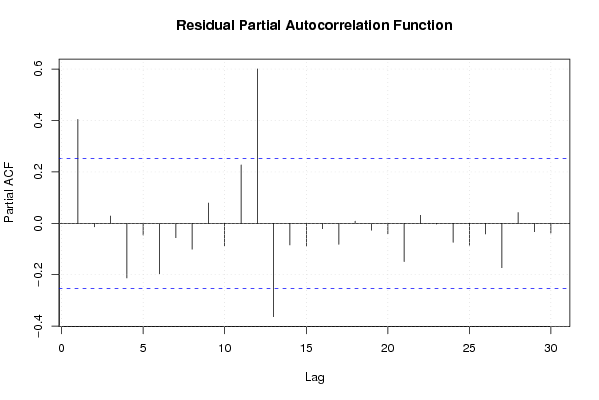
pacf(mysum$resid, lag.max=length(mysum$resid)/2, main='Residual Partial Autocorrelation Function')
grid()
dev.off()
bitmap(file='test8.png')
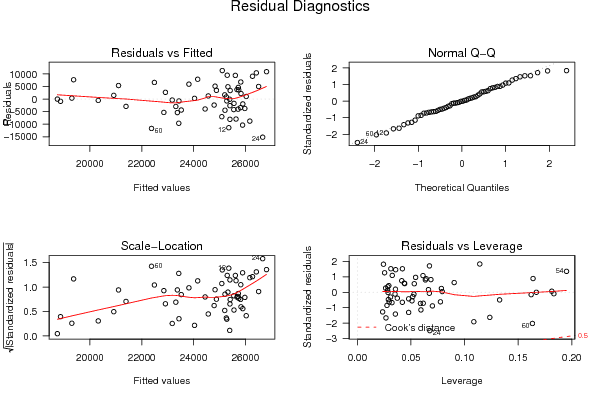
opar <- par(mfrow = c(2,2), oma = c(0, 0, 1.1, 0))
plot(mylm, las = 1, sub='Residual Diagnostics')
par(opar)
dev.off()
load(file='createtable')
a<-table.start()
a<-table.row.start(a)
a<-table.element(a, 'Multiple Linear Regression - Estimated Regression Equation', 1, TRUE)
a<-table.row.end(a)
myeq <- colnames(x)[1]
myeq <- paste(myeq, '[t] = ', sep='')
for (i in 1:k){
if (mysum$coefficients[i,1] > 0) myeq <- paste(myeq, '+', '')
myeq <- paste(myeq, mysum$coefficients[i,1], sep=' ')
if (rownames(mysum$coefficients)[i] != '(Intercept)') {
myeq <- paste(myeq, rownames(mysum$coefficients)[i], sep='')
if (rownames(mysum$coefficients)[i] != 't') myeq <- paste(myeq, '[t]', sep='')
}
}
myeq <- paste(myeq, ' + e[t]')
a<-table.row.start(a)
a<-table.element(a, myeq)
a<-table.row.end(a)
a<-table.end(a)
table.save(a,file='mytable1.tab')
a<-table.start()
a<-table.row.start(a)
a<-table.element(a,hyperlink('ols1.htm','Multiple Linear Regression - Ordinary Least Squares',''), 6, TRUE)
a<-table.row.end(a)
a<-table.row.start(a)
a<-table.element(a,'Variable',header=TRUE)
a<-table.element(a,'Parameter',header=TRUE)
a<-table.element(a,'S.D.',header=TRUE)
a<-table.element(a,'T-STAT
H0: parameter = 0',header=TRUE)
a<-table.element(a,'2-tail p-value',header=TRUE)
a<-table.element(a,'1-tail p-value',header=TRUE)
a<-table.row.end(a)
for (i in 1:k){
a<-table.row.start(a)
a<-table.element(a,rownames(mysum$coefficients)[i],header=TRUE)
a<-table.element(a,mysum$coefficients[i,1])
a<-table.element(a, round(mysum$coefficients[i,2],6))
a<-table.element(a, round(mysum$coefficients[i,3],4))
a<-table.element(a, round(mysum$coefficients[i,4],6))
a<-table.element(a, round(mysum$coefficients[i,4]/2,6))
a<-table.row.end(a)
}
a<-table.end(a)
table.save(a,file='mytable2.tab')
a<-table.start()
a<-table.row.start(a)
a<-table.element(a, 'Multiple Linear Regression - Regression Statistics', 2, TRUE)
a<-table.row.end(a)
a<-table.row.start(a)
a<-table.element(a, 'Multiple R',1,TRUE)
a<-table.element(a, sqrt(mysum$r.squared))
a<-table.row.end(a)
a<-table.row.start(a)
a<-table.element(a, 'R-squared',1,TRUE)
a<-table.element(a, mysum$r.squared)
a<-table.row.end(a)
a<-table.row.start(a)
a<-table.element(a, 'Adjusted R-squared',1,TRUE)
a<-table.element(a, mysum$adj.r.squared)
a<-table.row.end(a)
a<-table.row.start(a)
a<-table.element(a, 'F-TEST (value)',1,TRUE)
a<-table.element(a, mysum$fstatistic[1])
a<-table.row.end(a)
a<-table.row.start(a)
a<-table.element(a, 'F-TEST (DF numerator)',1,TRUE)
a<-table.element(a, mysum$fstatistic[2])
a<-table.row.end(a)
a<-table.row.start(a)
a<-table.element(a, 'F-TEST (DF denominator)',1,TRUE)
a<-table.element(a, mysum$fstatistic[3])
a<-table.row.end(a)
a<-table.row.start(a)
a<-table.element(a, 'p-value',1,TRUE)
a<-table.element(a, 1-pf(mysum$fstatistic[1],mysum$fstatistic[2],mysum$fstatistic[3]))
a<-table.row.end(a)
a<-table.row.start(a)
a<-table.element(a, 'Multiple Linear Regression - Residual Statistics', 2, TRUE)
a<-table.row.end(a)
a<-table.row.start(a)
a<-table.element(a, 'Residual Standard Deviation',1,TRUE)
a<-table.element(a, mysum$sigma)
a<-table.row.end(a)
a<-table.row.start(a)
a<-table.element(a, 'Sum Squared Residuals',1,TRUE)
a<-table.element(a, sum(myerror*myerror))
a<-table.row.end(a)
a<-table.end(a)
table.save(a,file='mytable3.tab')
a<-table.start()
a<-table.row.start(a)
a<-table.element(a, 'Multiple Linear Regression - Actuals, Interpolation, and Residuals', 4, TRUE)
a<-table.row.end(a)
a<-table.row.start(a)
a<-table.element(a, 'Time or Index', 1, TRUE)
a<-table.element(a, 'Actuals', 1, TRUE)
a<-table.element(a, 'Interpolation
Forecast', 1, TRUE)
a<-table.element(a, 'Residuals
Prediction Error', 1, TRUE)
a<-table.row.end(a)
for (i in 1:n) {
a<-table.row.start(a)
a<-table.element(a,i, 1, TRUE)
a<-table.element(a,x[i])
a<-table.element(a,x[i]-mysum$resid[i])
a<-table.element(a,mysum$resid[i])
a<-table.row.end(a)
}
a<-table.end(a)
table.save(a,file='mytable4.tab')