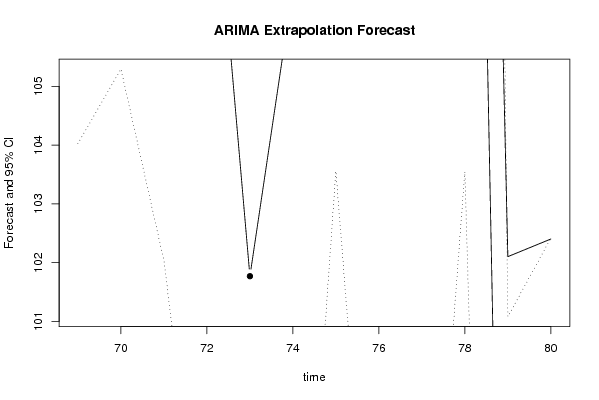
| Univariate ARIMA Extrapolation Forecast | ||||||||
| time | Y[t] | F[t] | 95% LB | 95% UB | p-value (H0: Y[t] = F[t]) | P(F[t]>Y[t-1]) | P(F[t]>Y[t-s]) | P(F[t]>Y[68]) |
| 56 | 88.9 | - | - | - | - | - | - | - |
| 57 | 115.9 | - | - | - | - | - | - | - |
| 58 | 104.2 | - | - | - | - | - | - | - |
| 59 | 113.4 | - | - | - | - | - | - | - |
| 60 | 112.2 | - | - | - | - | - | - | - |
| 61 | 100.8 | - | - | - | - | - | - | - |
| 62 | 107.3 | - | - | - | - | - | - | - |
| 63 | 126.6 | - | - | - | - | - | - | - |
| 64 | 102.9 | - | - | - | - | - | - | - |
| 65 | 117.9 | - | - | - | - | - | - | - |
| 66 | 128.8 | - | - | - | - | - | - | - |
| 67 | 87.5 | - | - | - | - | - | - | - |
| 68 | 93.8 | - | - | - | - | - | - | - |
| 69 | 122.7 | 118.1292 | 138.9684 | 104.0228 | 0.7373 | 4e-04 | 0.3784 | 4e-04 |
| 70 | 126.2 | 120.2821 | 142.8941 | 105.2947 | 0.7805 | 0.6241 | 0.0177 | 3e-04 |
| 71 | 124.6 | 116.648 | 138.7711 | 102.0285 | 0.8568 | 0.8998 | 0.3316 | 0.0011 |
| 72 | 116.7 | 110.2037 | 131.7527 | 96.1124 | 0.8169 | 0.9774 | 0.6094 | 0.0113 |
| 73 | 115.2 | 101.7673 | 118.7174 | 90.0819 | 0.9879 | 0.9939 | 0.4356 | 0.0907 |
| 74 | 111.1 | 106.6783 | 127.4827 | 93.0613 | 0.7378 | 0.89 | 0.5357 | 0.0319 |
| 75 | 129.9 | 123.3379 | 158.3494 | 103.5548 | 0.7422 | 0.1127 | 0.6267 | 0.0017 |
| 76 | 113.3 | 109.373 | 133.3881 | 94.3124 | 0.6953 | 0.9962 | 0.1998 | 0.0213 |
| 77 | 118.5 | 109.0729 | 133.6865 | 93.7958 | 0.8868 | 0.7062 | 0.8713 | 0.025 |
| 78 | 133.5 | 124.7814 | 164.2488 | 103.5434 | 0.7895 | 0.2811 | 0.6446 | 0.0021 |
| 79 | 102.1 | 88.0664 | 101.0787 | 78.769 | 0.9985 | 1 | 0.4525 | 0.8866 |
| 80 | 102.4 | 88.8367 | 102.4126 | 79.2306 | 0.9972 | 0.9966 | 0.8444 | 0.8444 |
| Univariate ARIMA Extrapolation Forecast Performance | ||||||
| time | % S.E. | PE | MAPE | Sq.E | MSE | RMSE |
| 69 | -0.0609 | 0.0387 | 0.0032 | 20.8923 | 1.741 | 1.3195 |
| 70 | -0.0636 | 0.0492 | 0.0041 | 35.0214 | 2.9185 | 1.7083 |
| 71 | -0.0639 | 0.0682 | 0.0057 | 63.2337 | 5.2695 | 2.2955 |
| 72 | -0.0652 | 0.0589 | 0.0049 | 42.2016 | 3.5168 | 1.8753 |
| 73 | -0.0586 | 0.132 | 0.011 | 180.4385 | 15.0365 | 3.8777 |
| 74 | -0.0651 | 0.0414 | 0.0035 | 19.5513 | 1.6293 | 1.2764 |
| 75 | -0.0818 | 0.0532 | 0.0044 | 43.0607 | 3.5884 | 1.8943 |
| 76 | -0.0703 | 0.0359 | 0.003 | 15.4214 | 1.2851 | 1.1336 |
| 77 | -0.0715 | 0.0864 | 0.0072 | 88.87 | 7.4058 | 2.7214 |
| 78 | -0.0868 | 0.0699 | 0.0058 | 76.0139 | 6.3345 | 2.5168 |
| 79 | -0.0539 | 0.1594 | 0.0133 | 196.9412 | 16.4118 | 4.0511 |
| 80 | -0.0552 | 0.1527 | 0.0127 | 183.9643 | 15.3304 | 3.9154 |

