Free Statistics

of Irreproducible Research!

Author's title

Author*Unverified author*
R Software Modulerwasp_arimaforecasting.wasp
Title produced by softwareARIMA Forecasting
Date of computationSat, 08 Dec 2007 07:02:57 -0700
Cite this page as followsStatistical Computations at FreeStatistics.org, Office for Research Development and Education, URL https://freestatistics.org/blog/index.php?v=date/2007/Dec/08/t1197121799dechwu8vjk1vsk2.htm/, Retrieved Sun, 28 Apr 2024 19:06:29 +0000
Statistical Computations at FreeStatistics.org, Office for Research Development and Education, URL https://freestatistics.org/blog/index.php?pk=2924, Retrieved Sun, 28 Apr 2024 19:06:29 +0000
QR Codes:

Original text written by user:lambda -0,6 d=1 D=0 ARIMA parameters op max
IsPrivate?No (this computation is public)
User-defined keywords
Estimated Impact239
Family? (F = Feedback message, R = changed R code, M = changed R Module, P = changed Parameters, D = changed Data)
-       [ARIMA Forecasting] [steenkool] [2007-12-08 14:02:57] [5338a3370b0f0a39c3af1ba0be9c6dab] [Current]
Feedback Forum

Post a new message
Dataseries X:
95,4
101,2
101,5
101,9
101,7
100,1
97,4
96,5
99,2
102,2
105,3
111,1
114,9
124,5
142,2
159,7
165,2
198,6
207,8
219,6
239,6
235,3
218,5
213,8
205,5
198,4
198,5
190,2
180,7
193,6
192,8
195,5
197,2
196,9
178,9
172,4
156,4
143,7
153,6
168,8
185,8
199,9
205,4
197,5
199,6
200,5
193,7
179,6
169,1
169,8
195,5
194,8
204,5
203,8
204,8
204,9
240,0
248,3
258,4
254,9


Summary of compuational transaction
Raw Inputview raw input (R code)
Raw Outputview raw output of R engine
Computing time4 seconds
R Server'Gwilym Jenkins' @ 72.249.127.135

\begin{tabular}{lllllllll}
\hline
Summary of compuational transaction \tabularnewline
Raw Input & view raw input (R code)  \tabularnewline
Raw Output & view raw output of R engine  \tabularnewline
Computing time & 4 seconds \tabularnewline
R Server & 'Gwilym Jenkins' @ 72.249.127.135 \tabularnewline
\hline
\end{tabular}
%Source: https://freestatistics.org/blog/index.php?pk=2924&T=0

[TABLE]
[ROW][C]Summary of compuational transaction[/C][/ROW]
[ROW][C]Raw Input[/C][C]view raw input (R code) [/C][/ROW]
[ROW][C]Raw Output[/C][C]view raw output of R engine [/C][/ROW]
[ROW][C]Computing time[/C][C]4 seconds[/C][/ROW]
[ROW][C]R Server[/C][C]'Gwilym Jenkins' @ 72.249.127.135[/C][/ROW]
[/TABLE]
Source: https://freestatistics.org/blog/index.php?pk=2924&T=0

Globally Unique Identifier (entire table): ba.freestatistics.org/blog/index.php?pk=2924&T=0

As an alternative you can also use a QR Code:  

The GUIDs for individual cells are displayed in the table below:

Summary of compuational transaction
Raw Inputview raw input (R code)
Raw Outputview raw output of R engine
Computing time4 seconds
R Server'Gwilym Jenkins' @ 72.249.127.135


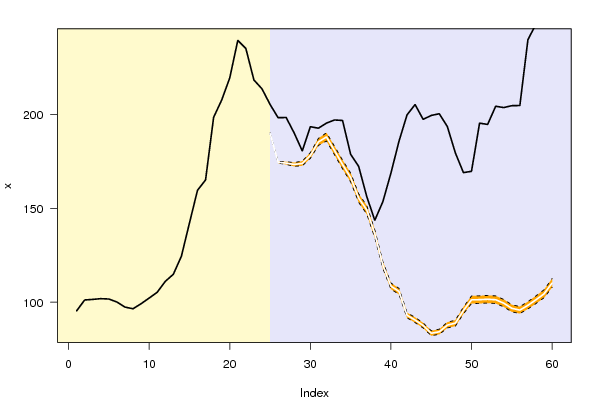
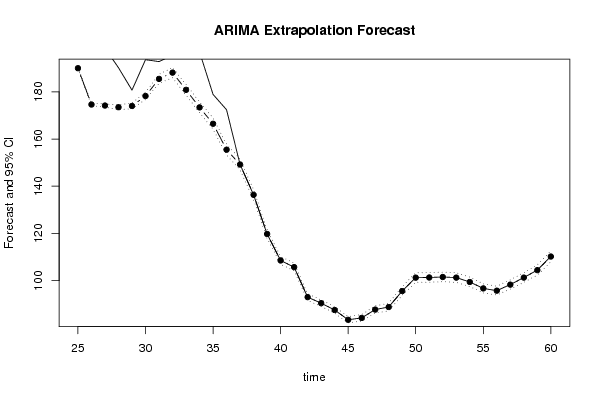
Univariate ARIMA Extrapolation Forecast
timeY[t]F[t]95% LB95% UBp-value(H0: Y[t] = F[t])P(F[t]>Y[t-1])P(F[t]>Y[t-s])P(F[t]>Y[24])
12111.1-------
13114.9-------
14124.5-------
15142.2-------
16159.7-------
17165.2-------
18198.6-------
19207.8-------
20219.6-------
21239.6-------
22235.3-------
23218.5-------
24213.8-------
25205.5189.9999190.3194189.68131101
26198.4174.616175.0706174.16331101
27198.5174.1792174.9014173.46161101
28190.2173.4605174.468172.46241101
29180.7173.9903175.2336172.7611101
30193.6178.2154179.7441176.707510.999411
31192.8185.4642187.3753183.58411111
32195.5188.1295190.3381185.96161111
33197.2180.8274183.1154178.58481111
34196.9173.398175.7537171.09241111
35178.9166.4637168.8622164.11921111
36172.4155.4856157.7898153.23471111
37156.4149.2025151.51146.95071111
38143.7136.3709138.4978134.29591111
39153.6119.7744121.5995117.99271111
40168.8108.5699110.2122106.96641111
41185.8105.7459107.4001104.13211111
42199.993.027794.435591.65311111
43205.490.474191.877589.10461111
44197.587.574988.960886.22331111
45199.683.432184.762182.13511111
46200.584.221885.619182.86061111
47193.787.75789.299586.25661111
48179.688.83690.458587.25951111
49169.195.610197.463193.81291111
50169.8101.2807103.330599.29521111
51195.5101.347103.409199.34991111
52194.8101.5556103.626599.55011111
53204.5101.3052103.372999.30291111
54203.899.454101.465997.50521111
55204.896.724998.649494.85971111
56204.995.768897.664193.93181111
5724098.33100.309896.41211111
58248.3101.3091103.386999.29731111
59258.4104.4643106.6477102.35151111
60254.9110.2211112.6028107.91891111

\begin{tabular}{lllllllll}
\hline
Univariate ARIMA Extrapolation Forecast \tabularnewline
time & Y[t] & F[t] & 95% LB & 95% UB & p-value(H0: Y[t] = F[t]) & P(F[t]>Y[t-1]) & P(F[t]>Y[t-s]) & P(F[t]>Y[24]) \tabularnewline
12 & 111.1 & - & - & - & - & - & - & - \tabularnewline
13 & 114.9 & - & - & - & - & - & - & - \tabularnewline
14 & 124.5 & - & - & - & - & - & - & - \tabularnewline
15 & 142.2 & - & - & - & - & - & - & - \tabularnewline
16 & 159.7 & - & - & - & - & - & - & - \tabularnewline
17 & 165.2 & - & - & - & - & - & - & - \tabularnewline
18 & 198.6 & - & - & - & - & - & - & - \tabularnewline
19 & 207.8 & - & - & - & - & - & - & - \tabularnewline
20 & 219.6 & - & - & - & - & - & - & - \tabularnewline
21 & 239.6 & - & - & - & - & - & - & - \tabularnewline
22 & 235.3 & - & - & - & - & - & - & - \tabularnewline
23 & 218.5 & - & - & - & - & - & - & - \tabularnewline
24 & 213.8 & - & - & - & - & - & - & - \tabularnewline
25 & 205.5 & 189.9999 & 190.3194 & 189.6813 & 1 & 1 & 0 & 1 \tabularnewline
26 & 198.4 & 174.616 & 175.0706 & 174.1633 & 1 & 1 & 0 & 1 \tabularnewline
27 & 198.5 & 174.1792 & 174.9014 & 173.4616 & 1 & 1 & 0 & 1 \tabularnewline
28 & 190.2 & 173.4605 & 174.468 & 172.4624 & 1 & 1 & 0 & 1 \tabularnewline
29 & 180.7 & 173.9903 & 175.2336 & 172.761 & 1 & 1 & 0 & 1 \tabularnewline
30 & 193.6 & 178.2154 & 179.7441 & 176.7075 & 1 & 0.9994 & 1 & 1 \tabularnewline
31 & 192.8 & 185.4642 & 187.3753 & 183.5841 & 1 & 1 & 1 & 1 \tabularnewline
32 & 195.5 & 188.1295 & 190.3381 & 185.9616 & 1 & 1 & 1 & 1 \tabularnewline
33 & 197.2 & 180.8274 & 183.1154 & 178.5848 & 1 & 1 & 1 & 1 \tabularnewline
34 & 196.9 & 173.398 & 175.7537 & 171.0924 & 1 & 1 & 1 & 1 \tabularnewline
35 & 178.9 & 166.4637 & 168.8622 & 164.1192 & 1 & 1 & 1 & 1 \tabularnewline
36 & 172.4 & 155.4856 & 157.7898 & 153.2347 & 1 & 1 & 1 & 1 \tabularnewline
37 & 156.4 & 149.2025 & 151.51 & 146.9507 & 1 & 1 & 1 & 1 \tabularnewline
38 & 143.7 & 136.3709 & 138.4978 & 134.2959 & 1 & 1 & 1 & 1 \tabularnewline
39 & 153.6 & 119.7744 & 121.5995 & 117.9927 & 1 & 1 & 1 & 1 \tabularnewline
40 & 168.8 & 108.5699 & 110.2122 & 106.9664 & 1 & 1 & 1 & 1 \tabularnewline
41 & 185.8 & 105.7459 & 107.4001 & 104.1321 & 1 & 1 & 1 & 1 \tabularnewline
42 & 199.9 & 93.0277 & 94.4355 & 91.6531 & 1 & 1 & 1 & 1 \tabularnewline
43 & 205.4 & 90.4741 & 91.8775 & 89.1046 & 1 & 1 & 1 & 1 \tabularnewline
44 & 197.5 & 87.5749 & 88.9608 & 86.2233 & 1 & 1 & 1 & 1 \tabularnewline
45 & 199.6 & 83.4321 & 84.7621 & 82.1351 & 1 & 1 & 1 & 1 \tabularnewline
46 & 200.5 & 84.2218 & 85.6191 & 82.8606 & 1 & 1 & 1 & 1 \tabularnewline
47 & 193.7 & 87.757 & 89.2995 & 86.2566 & 1 & 1 & 1 & 1 \tabularnewline
48 & 179.6 & 88.836 & 90.4585 & 87.2595 & 1 & 1 & 1 & 1 \tabularnewline
49 & 169.1 & 95.6101 & 97.4631 & 93.8129 & 1 & 1 & 1 & 1 \tabularnewline
50 & 169.8 & 101.2807 & 103.3305 & 99.2952 & 1 & 1 & 1 & 1 \tabularnewline
51 & 195.5 & 101.347 & 103.4091 & 99.3499 & 1 & 1 & 1 & 1 \tabularnewline
52 & 194.8 & 101.5556 & 103.6265 & 99.5501 & 1 & 1 & 1 & 1 \tabularnewline
53 & 204.5 & 101.3052 & 103.3729 & 99.3029 & 1 & 1 & 1 & 1 \tabularnewline
54 & 203.8 & 99.454 & 101.4659 & 97.5052 & 1 & 1 & 1 & 1 \tabularnewline
55 & 204.8 & 96.7249 & 98.6494 & 94.8597 & 1 & 1 & 1 & 1 \tabularnewline
56 & 204.9 & 95.7688 & 97.6641 & 93.9318 & 1 & 1 & 1 & 1 \tabularnewline
57 & 240 & 98.33 & 100.3098 & 96.4121 & 1 & 1 & 1 & 1 \tabularnewline
58 & 248.3 & 101.3091 & 103.3869 & 99.2973 & 1 & 1 & 1 & 1 \tabularnewline
59 & 258.4 & 104.4643 & 106.6477 & 102.3515 & 1 & 1 & 1 & 1 \tabularnewline
60 & 254.9 & 110.2211 & 112.6028 & 107.9189 & 1 & 1 & 1 & 1 \tabularnewline
\hline
\end{tabular}
%Source: https://freestatistics.org/blog/index.php?pk=2924&T=1

[TABLE]
[ROW][C]Univariate ARIMA Extrapolation Forecast[/C][/ROW]
[ROW][C]time[/C][C]Y[t][/C][C]F[t][/C][C]95% LB[/C][C]95% UB[/C][C]p-value(H0: Y[t] = F[t])[/C][C]P(F[t]>Y[t-1])[/C][C]P(F[t]>Y[t-s])[/C][C]P(F[t]>Y[24])[/C][/ROW]
[ROW][C]12[/C][C]111.1[/C][C]-[/C][C]-[/C][C]-[/C][C]-[/C][C]-[/C][C]-[/C][C]-[/C][/ROW]
[ROW][C]13[/C][C]114.9[/C][C]-[/C][C]-[/C][C]-[/C][C]-[/C][C]-[/C][C]-[/C][C]-[/C][/ROW]
[ROW][C]14[/C][C]124.5[/C][C]-[/C][C]-[/C][C]-[/C][C]-[/C][C]-[/C][C]-[/C][C]-[/C][/ROW]
[ROW][C]15[/C][C]142.2[/C][C]-[/C][C]-[/C][C]-[/C][C]-[/C][C]-[/C][C]-[/C][C]-[/C][/ROW]
[ROW][C]16[/C][C]159.7[/C][C]-[/C][C]-[/C][C]-[/C][C]-[/C][C]-[/C][C]-[/C][C]-[/C][/ROW]
[ROW][C]17[/C][C]165.2[/C][C]-[/C][C]-[/C][C]-[/C][C]-[/C][C]-[/C][C]-[/C][C]-[/C][/ROW]
[ROW][C]18[/C][C]198.6[/C][C]-[/C][C]-[/C][C]-[/C][C]-[/C][C]-[/C][C]-[/C][C]-[/C][/ROW]
[ROW][C]19[/C][C]207.8[/C][C]-[/C][C]-[/C][C]-[/C][C]-[/C][C]-[/C][C]-[/C][C]-[/C][/ROW]
[ROW][C]20[/C][C]219.6[/C][C]-[/C][C]-[/C][C]-[/C][C]-[/C][C]-[/C][C]-[/C][C]-[/C][/ROW]
[ROW][C]21[/C][C]239.6[/C][C]-[/C][C]-[/C][C]-[/C][C]-[/C][C]-[/C][C]-[/C][C]-[/C][/ROW]
[ROW][C]22[/C][C]235.3[/C][C]-[/C][C]-[/C][C]-[/C][C]-[/C][C]-[/C][C]-[/C][C]-[/C][/ROW]
[ROW][C]23[/C][C]218.5[/C][C]-[/C][C]-[/C][C]-[/C][C]-[/C][C]-[/C][C]-[/C][C]-[/C][/ROW]
[ROW][C]24[/C][C]213.8[/C][C]-[/C][C]-[/C][C]-[/C][C]-[/C][C]-[/C][C]-[/C][C]-[/C][/ROW]
[ROW][C]25[/C][C]205.5[/C][C]189.9999[/C][C]190.3194[/C][C]189.6813[/C][C]1[/C][C]1[/C][C]0[/C][C]1[/C][/ROW]
[ROW][C]26[/C][C]198.4[/C][C]174.616[/C][C]175.0706[/C][C]174.1633[/C][C]1[/C][C]1[/C][C]0[/C][C]1[/C][/ROW]
[ROW][C]27[/C][C]198.5[/C][C]174.1792[/C][C]174.9014[/C][C]173.4616[/C][C]1[/C][C]1[/C][C]0[/C][C]1[/C][/ROW]
[ROW][C]28[/C][C]190.2[/C][C]173.4605[/C][C]174.468[/C][C]172.4624[/C][C]1[/C][C]1[/C][C]0[/C][C]1[/C][/ROW]
[ROW][C]29[/C][C]180.7[/C][C]173.9903[/C][C]175.2336[/C][C]172.761[/C][C]1[/C][C]1[/C][C]0[/C][C]1[/C][/ROW]
[ROW][C]30[/C][C]193.6[/C][C]178.2154[/C][C]179.7441[/C][C]176.7075[/C][C]1[/C][C]0.9994[/C][C]1[/C][C]1[/C][/ROW]
[ROW][C]31[/C][C]192.8[/C][C]185.4642[/C][C]187.3753[/C][C]183.5841[/C][C]1[/C][C]1[/C][C]1[/C][C]1[/C][/ROW]
[ROW][C]32[/C][C]195.5[/C][C]188.1295[/C][C]190.3381[/C][C]185.9616[/C][C]1[/C][C]1[/C][C]1[/C][C]1[/C][/ROW]
[ROW][C]33[/C][C]197.2[/C][C]180.8274[/C][C]183.1154[/C][C]178.5848[/C][C]1[/C][C]1[/C][C]1[/C][C]1[/C][/ROW]
[ROW][C]34[/C][C]196.9[/C][C]173.398[/C][C]175.7537[/C][C]171.0924[/C][C]1[/C][C]1[/C][C]1[/C][C]1[/C][/ROW]
[ROW][C]35[/C][C]178.9[/C][C]166.4637[/C][C]168.8622[/C][C]164.1192[/C][C]1[/C][C]1[/C][C]1[/C][C]1[/C][/ROW]
[ROW][C]36[/C][C]172.4[/C][C]155.4856[/C][C]157.7898[/C][C]153.2347[/C][C]1[/C][C]1[/C][C]1[/C][C]1[/C][/ROW]
[ROW][C]37[/C][C]156.4[/C][C]149.2025[/C][C]151.51[/C][C]146.9507[/C][C]1[/C][C]1[/C][C]1[/C][C]1[/C][/ROW]
[ROW][C]38[/C][C]143.7[/C][C]136.3709[/C][C]138.4978[/C][C]134.2959[/C][C]1[/C][C]1[/C][C]1[/C][C]1[/C][/ROW]
[ROW][C]39[/C][C]153.6[/C][C]119.7744[/C][C]121.5995[/C][C]117.9927[/C][C]1[/C][C]1[/C][C]1[/C][C]1[/C][/ROW]
[ROW][C]40[/C][C]168.8[/C][C]108.5699[/C][C]110.2122[/C][C]106.9664[/C][C]1[/C][C]1[/C][C]1[/C][C]1[/C][/ROW]
[ROW][C]41[/C][C]185.8[/C][C]105.7459[/C][C]107.4001[/C][C]104.1321[/C][C]1[/C][C]1[/C][C]1[/C][C]1[/C][/ROW]
[ROW][C]42[/C][C]199.9[/C][C]93.0277[/C][C]94.4355[/C][C]91.6531[/C][C]1[/C][C]1[/C][C]1[/C][C]1[/C][/ROW]
[ROW][C]43[/C][C]205.4[/C][C]90.4741[/C][C]91.8775[/C][C]89.1046[/C][C]1[/C][C]1[/C][C]1[/C][C]1[/C][/ROW]
[ROW][C]44[/C][C]197.5[/C][C]87.5749[/C][C]88.9608[/C][C]86.2233[/C][C]1[/C][C]1[/C][C]1[/C][C]1[/C][/ROW]
[ROW][C]45[/C][C]199.6[/C][C]83.4321[/C][C]84.7621[/C][C]82.1351[/C][C]1[/C][C]1[/C][C]1[/C][C]1[/C][/ROW]
[ROW][C]46[/C][C]200.5[/C][C]84.2218[/C][C]85.6191[/C][C]82.8606[/C][C]1[/C][C]1[/C][C]1[/C][C]1[/C][/ROW]
[ROW][C]47[/C][C]193.7[/C][C]87.757[/C][C]89.2995[/C][C]86.2566[/C][C]1[/C][C]1[/C][C]1[/C][C]1[/C][/ROW]
[ROW][C]48[/C][C]179.6[/C][C]88.836[/C][C]90.4585[/C][C]87.2595[/C][C]1[/C][C]1[/C][C]1[/C][C]1[/C][/ROW]
[ROW][C]49[/C][C]169.1[/C][C]95.6101[/C][C]97.4631[/C][C]93.8129[/C][C]1[/C][C]1[/C][C]1[/C][C]1[/C][/ROW]
[ROW][C]50[/C][C]169.8[/C][C]101.2807[/C][C]103.3305[/C][C]99.2952[/C][C]1[/C][C]1[/C][C]1[/C][C]1[/C][/ROW]
[ROW][C]51[/C][C]195.5[/C][C]101.347[/C][C]103.4091[/C][C]99.3499[/C][C]1[/C][C]1[/C][C]1[/C][C]1[/C][/ROW]
[ROW][C]52[/C][C]194.8[/C][C]101.5556[/C][C]103.6265[/C][C]99.5501[/C][C]1[/C][C]1[/C][C]1[/C][C]1[/C][/ROW]
[ROW][C]53[/C][C]204.5[/C][C]101.3052[/C][C]103.3729[/C][C]99.3029[/C][C]1[/C][C]1[/C][C]1[/C][C]1[/C][/ROW]
[ROW][C]54[/C][C]203.8[/C][C]99.454[/C][C]101.4659[/C][C]97.5052[/C][C]1[/C][C]1[/C][C]1[/C][C]1[/C][/ROW]
[ROW][C]55[/C][C]204.8[/C][C]96.7249[/C][C]98.6494[/C][C]94.8597[/C][C]1[/C][C]1[/C][C]1[/C][C]1[/C][/ROW]
[ROW][C]56[/C][C]204.9[/C][C]95.7688[/C][C]97.6641[/C][C]93.9318[/C][C]1[/C][C]1[/C][C]1[/C][C]1[/C][/ROW]
[ROW][C]57[/C][C]240[/C][C]98.33[/C][C]100.3098[/C][C]96.4121[/C][C]1[/C][C]1[/C][C]1[/C][C]1[/C][/ROW]
[ROW][C]58[/C][C]248.3[/C][C]101.3091[/C][C]103.3869[/C][C]99.2973[/C][C]1[/C][C]1[/C][C]1[/C][C]1[/C][/ROW]
[ROW][C]59[/C][C]258.4[/C][C]104.4643[/C][C]106.6477[/C][C]102.3515[/C][C]1[/C][C]1[/C][C]1[/C][C]1[/C][/ROW]
[ROW][C]60[/C][C]254.9[/C][C]110.2211[/C][C]112.6028[/C][C]107.9189[/C][C]1[/C][C]1[/C][C]1[/C][C]1[/C][/ROW]
[/TABLE]
Source: https://freestatistics.org/blog/index.php?pk=2924&T=1

Globally Unique Identifier (entire table): ba.freestatistics.org/blog/index.php?pk=2924&T=1

As an alternative you can also use a QR Code:  

The GUIDs for individual cells are displayed in the table below:

Univariate ARIMA Extrapolation Forecast
timeY[t]F[t]95% LB95% UBp-value(H0: Y[t] = F[t])P(F[t]>Y[t-1])P(F[t]>Y[t-s])P(F[t]>Y[24])
12111.1-------
13114.9-------
14124.5-------
15142.2-------
16159.7-------
17165.2-------
18198.6-------
19207.8-------
20219.6-------
21239.6-------
22235.3-------
23218.5-------
24213.8-------
25205.5189.9999190.3194189.68131101
26198.4174.616175.0706174.16331101
27198.5174.1792174.9014173.46161101
28190.2173.4605174.468172.46241101
29180.7173.9903175.2336172.7611101
30193.6178.2154179.7441176.707510.999411
31192.8185.4642187.3753183.58411111
32195.5188.1295190.3381185.96161111
33197.2180.8274183.1154178.58481111
34196.9173.398175.7537171.09241111
35178.9166.4637168.8622164.11921111
36172.4155.4856157.7898153.23471111
37156.4149.2025151.51146.95071111
38143.7136.3709138.4978134.29591111
39153.6119.7744121.5995117.99271111
40168.8108.5699110.2122106.96641111
41185.8105.7459107.4001104.13211111
42199.993.027794.435591.65311111
43205.490.474191.877589.10461111
44197.587.574988.960886.22331111
45199.683.432184.762182.13511111
46200.584.221885.619182.86061111
47193.787.75789.299586.25661111
48179.688.83690.458587.25951111
49169.195.610197.463193.81291111
50169.8101.2807103.330599.29521111
51195.5101.347103.409199.34991111
52194.8101.5556103.626599.55011111
53204.5101.3052103.372999.30291111
54203.899.454101.465997.50521111
55204.896.724998.649494.85971111
56204.995.768897.664193.93181111
5724098.33100.309896.41211111
58248.3101.3091103.386999.29731111
59258.4104.4643106.6477102.35151111
60254.9110.2211112.6028107.91891111


Univariate ARIMA Extrapolation Forecast Performance
time% S.E.PEMAPESq.EMSERMSE
25-9e-040.08160.0023240.25186.67372.5833
26-0.00130.13620.0038565.679515.71333.964
27-0.00210.13960.0039591.503616.43074.0535
28-0.00290.09650.0027280.20987.78362.7899
29-0.00360.03860.001145.02071.25061.1183
30-0.00430.08630.0024236.68486.57462.5641
31-0.00520.03960.001153.81431.49481.2226
32-0.00590.03920.001154.32411.5091.2284
33-0.00630.09050.0025268.06257.44622.7288
34-0.00680.13550.0038552.345115.34293.917
35-0.00720.07470.0021154.66234.29622.0727
36-0.00740.10880.003286.09867.94722.8191
37-0.00770.04820.001351.80441.4391.1996
38-0.00780.05370.001553.71521.49211.2215
39-0.00760.28240.00781144.171631.78255.6376
40-0.00750.55480.01543627.6658100.768510.0384
41-0.00780.7570.0216408.656178.018213.3423
42-0.00751.14880.031911421.6976317.269417.8121
43-0.00771.27030.035313207.9712366.888119.1543
44-0.00791.25520.034912083.5195335.653318.3208
45-0.00791.39240.038713494.9863374.860719.3613
46-0.00821.38060.038413520.6238375.572919.3797
47-0.00871.20720.033511223.9251311.775717.6572
48-0.00911.02170.02848238.1124228.836515.1273
49-0.00960.76860.02145400.7602150.021112.2483
50-0.010.67650.01884694.8951130.413811.4199
51-0.01010.9290.02588864.7944246.244315.6922
52-0.01010.91820.02558694.5243241.514615.5407
53-0.01011.01870.028310649.1649295.810117.1991
54-0.011.04920.029110888.0889302.446917.391
55-0.00981.11730.03111680.2341324.450918.0125
56-0.00981.13950.031711909.6117330.822518.1885
57-0.011.44080.0420070.3819557.510623.6117
58-0.01011.45090.040321606.3321600.175924.4985
59-0.01031.47360.040923696.2043658.227925.656
60-0.01071.31260.036520931.9919581.444224.1132

\begin{tabular}{lllllllll}
\hline
Univariate ARIMA Extrapolation Forecast Performance \tabularnewline
time & % S.E. & PE & MAPE & Sq.E & MSE & RMSE \tabularnewline
25 & -9e-04 & 0.0816 & 0.0023 & 240.2518 & 6.6737 & 2.5833 \tabularnewline
26 & -0.0013 & 0.1362 & 0.0038 & 565.6795 & 15.7133 & 3.964 \tabularnewline
27 & -0.0021 & 0.1396 & 0.0039 & 591.5036 & 16.4307 & 4.0535 \tabularnewline
28 & -0.0029 & 0.0965 & 0.0027 & 280.2098 & 7.7836 & 2.7899 \tabularnewline
29 & -0.0036 & 0.0386 & 0.0011 & 45.0207 & 1.2506 & 1.1183 \tabularnewline
30 & -0.0043 & 0.0863 & 0.0024 & 236.6848 & 6.5746 & 2.5641 \tabularnewline
31 & -0.0052 & 0.0396 & 0.0011 & 53.8143 & 1.4948 & 1.2226 \tabularnewline
32 & -0.0059 & 0.0392 & 0.0011 & 54.3241 & 1.509 & 1.2284 \tabularnewline
33 & -0.0063 & 0.0905 & 0.0025 & 268.0625 & 7.4462 & 2.7288 \tabularnewline
34 & -0.0068 & 0.1355 & 0.0038 & 552.3451 & 15.3429 & 3.917 \tabularnewline
35 & -0.0072 & 0.0747 & 0.0021 & 154.6623 & 4.2962 & 2.0727 \tabularnewline
36 & -0.0074 & 0.1088 & 0.003 & 286.0986 & 7.9472 & 2.8191 \tabularnewline
37 & -0.0077 & 0.0482 & 0.0013 & 51.8044 & 1.439 & 1.1996 \tabularnewline
38 & -0.0078 & 0.0537 & 0.0015 & 53.7152 & 1.4921 & 1.2215 \tabularnewline
39 & -0.0076 & 0.2824 & 0.0078 & 1144.1716 & 31.7825 & 5.6376 \tabularnewline
40 & -0.0075 & 0.5548 & 0.0154 & 3627.6658 & 100.7685 & 10.0384 \tabularnewline
41 & -0.0078 & 0.757 & 0.021 & 6408.656 & 178.0182 & 13.3423 \tabularnewline
42 & -0.0075 & 1.1488 & 0.0319 & 11421.6976 & 317.2694 & 17.8121 \tabularnewline
43 & -0.0077 & 1.2703 & 0.0353 & 13207.9712 & 366.8881 & 19.1543 \tabularnewline
44 & -0.0079 & 1.2552 & 0.0349 & 12083.5195 & 335.6533 & 18.3208 \tabularnewline
45 & -0.0079 & 1.3924 & 0.0387 & 13494.9863 & 374.8607 & 19.3613 \tabularnewline
46 & -0.0082 & 1.3806 & 0.0384 & 13520.6238 & 375.5729 & 19.3797 \tabularnewline
47 & -0.0087 & 1.2072 & 0.0335 & 11223.9251 & 311.7757 & 17.6572 \tabularnewline
48 & -0.0091 & 1.0217 & 0.0284 & 8238.1124 & 228.8365 & 15.1273 \tabularnewline
49 & -0.0096 & 0.7686 & 0.0214 & 5400.7602 & 150.0211 & 12.2483 \tabularnewline
50 & -0.01 & 0.6765 & 0.0188 & 4694.8951 & 130.4138 & 11.4199 \tabularnewline
51 & -0.0101 & 0.929 & 0.0258 & 8864.7944 & 246.2443 & 15.6922 \tabularnewline
52 & -0.0101 & 0.9182 & 0.0255 & 8694.5243 & 241.5146 & 15.5407 \tabularnewline
53 & -0.0101 & 1.0187 & 0.0283 & 10649.1649 & 295.8101 & 17.1991 \tabularnewline
54 & -0.01 & 1.0492 & 0.0291 & 10888.0889 & 302.4469 & 17.391 \tabularnewline
55 & -0.0098 & 1.1173 & 0.031 & 11680.2341 & 324.4509 & 18.0125 \tabularnewline
56 & -0.0098 & 1.1395 & 0.0317 & 11909.6117 & 330.8225 & 18.1885 \tabularnewline
57 & -0.01 & 1.4408 & 0.04 & 20070.3819 & 557.5106 & 23.6117 \tabularnewline
58 & -0.0101 & 1.4509 & 0.0403 & 21606.3321 & 600.1759 & 24.4985 \tabularnewline
59 & -0.0103 & 1.4736 & 0.0409 & 23696.2043 & 658.2279 & 25.656 \tabularnewline
60 & -0.0107 & 1.3126 & 0.0365 & 20931.9919 & 581.4442 & 24.1132 \tabularnewline
\hline
\end{tabular}
%Source: https://freestatistics.org/blog/index.php?pk=2924&T=2

[TABLE]
[ROW][C]Univariate ARIMA Extrapolation Forecast Performance[/C][/ROW]
[ROW][C]time[/C][C]% S.E.[/C][C]PE[/C][C]MAPE[/C][C]Sq.E[/C][C]MSE[/C][C]RMSE[/C][/ROW]
[ROW][C]25[/C][C]-9e-04[/C][C]0.0816[/C][C]0.0023[/C][C]240.2518[/C][C]6.6737[/C][C]2.5833[/C][/ROW]
[ROW][C]26[/C][C]-0.0013[/C][C]0.1362[/C][C]0.0038[/C][C]565.6795[/C][C]15.7133[/C][C]3.964[/C][/ROW]
[ROW][C]27[/C][C]-0.0021[/C][C]0.1396[/C][C]0.0039[/C][C]591.5036[/C][C]16.4307[/C][C]4.0535[/C][/ROW]
[ROW][C]28[/C][C]-0.0029[/C][C]0.0965[/C][C]0.0027[/C][C]280.2098[/C][C]7.7836[/C][C]2.7899[/C][/ROW]
[ROW][C]29[/C][C]-0.0036[/C][C]0.0386[/C][C]0.0011[/C][C]45.0207[/C][C]1.2506[/C][C]1.1183[/C][/ROW]
[ROW][C]30[/C][C]-0.0043[/C][C]0.0863[/C][C]0.0024[/C][C]236.6848[/C][C]6.5746[/C][C]2.5641[/C][/ROW]
[ROW][C]31[/C][C]-0.0052[/C][C]0.0396[/C][C]0.0011[/C][C]53.8143[/C][C]1.4948[/C][C]1.2226[/C][/ROW]
[ROW][C]32[/C][C]-0.0059[/C][C]0.0392[/C][C]0.0011[/C][C]54.3241[/C][C]1.509[/C][C]1.2284[/C][/ROW]
[ROW][C]33[/C][C]-0.0063[/C][C]0.0905[/C][C]0.0025[/C][C]268.0625[/C][C]7.4462[/C][C]2.7288[/C][/ROW]
[ROW][C]34[/C][C]-0.0068[/C][C]0.1355[/C][C]0.0038[/C][C]552.3451[/C][C]15.3429[/C][C]3.917[/C][/ROW]
[ROW][C]35[/C][C]-0.0072[/C][C]0.0747[/C][C]0.0021[/C][C]154.6623[/C][C]4.2962[/C][C]2.0727[/C][/ROW]
[ROW][C]36[/C][C]-0.0074[/C][C]0.1088[/C][C]0.003[/C][C]286.0986[/C][C]7.9472[/C][C]2.8191[/C][/ROW]
[ROW][C]37[/C][C]-0.0077[/C][C]0.0482[/C][C]0.0013[/C][C]51.8044[/C][C]1.439[/C][C]1.1996[/C][/ROW]
[ROW][C]38[/C][C]-0.0078[/C][C]0.0537[/C][C]0.0015[/C][C]53.7152[/C][C]1.4921[/C][C]1.2215[/C][/ROW]
[ROW][C]39[/C][C]-0.0076[/C][C]0.2824[/C][C]0.0078[/C][C]1144.1716[/C][C]31.7825[/C][C]5.6376[/C][/ROW]
[ROW][C]40[/C][C]-0.0075[/C][C]0.5548[/C][C]0.0154[/C][C]3627.6658[/C][C]100.7685[/C][C]10.0384[/C][/ROW]
[ROW][C]41[/C][C]-0.0078[/C][C]0.757[/C][C]0.021[/C][C]6408.656[/C][C]178.0182[/C][C]13.3423[/C][/ROW]
[ROW][C]42[/C][C]-0.0075[/C][C]1.1488[/C][C]0.0319[/C][C]11421.6976[/C][C]317.2694[/C][C]17.8121[/C][/ROW]
[ROW][C]43[/C][C]-0.0077[/C][C]1.2703[/C][C]0.0353[/C][C]13207.9712[/C][C]366.8881[/C][C]19.1543[/C][/ROW]
[ROW][C]44[/C][C]-0.0079[/C][C]1.2552[/C][C]0.0349[/C][C]12083.5195[/C][C]335.6533[/C][C]18.3208[/C][/ROW]
[ROW][C]45[/C][C]-0.0079[/C][C]1.3924[/C][C]0.0387[/C][C]13494.9863[/C][C]374.8607[/C][C]19.3613[/C][/ROW]
[ROW][C]46[/C][C]-0.0082[/C][C]1.3806[/C][C]0.0384[/C][C]13520.6238[/C][C]375.5729[/C][C]19.3797[/C][/ROW]
[ROW][C]47[/C][C]-0.0087[/C][C]1.2072[/C][C]0.0335[/C][C]11223.9251[/C][C]311.7757[/C][C]17.6572[/C][/ROW]
[ROW][C]48[/C][C]-0.0091[/C][C]1.0217[/C][C]0.0284[/C][C]8238.1124[/C][C]228.8365[/C][C]15.1273[/C][/ROW]
[ROW][C]49[/C][C]-0.0096[/C][C]0.7686[/C][C]0.0214[/C][C]5400.7602[/C][C]150.0211[/C][C]12.2483[/C][/ROW]
[ROW][C]50[/C][C]-0.01[/C][C]0.6765[/C][C]0.0188[/C][C]4694.8951[/C][C]130.4138[/C][C]11.4199[/C][/ROW]
[ROW][C]51[/C][C]-0.0101[/C][C]0.929[/C][C]0.0258[/C][C]8864.7944[/C][C]246.2443[/C][C]15.6922[/C][/ROW]
[ROW][C]52[/C][C]-0.0101[/C][C]0.9182[/C][C]0.0255[/C][C]8694.5243[/C][C]241.5146[/C][C]15.5407[/C][/ROW]
[ROW][C]53[/C][C]-0.0101[/C][C]1.0187[/C][C]0.0283[/C][C]10649.1649[/C][C]295.8101[/C][C]17.1991[/C][/ROW]
[ROW][C]54[/C][C]-0.01[/C][C]1.0492[/C][C]0.0291[/C][C]10888.0889[/C][C]302.4469[/C][C]17.391[/C][/ROW]
[ROW][C]55[/C][C]-0.0098[/C][C]1.1173[/C][C]0.031[/C][C]11680.2341[/C][C]324.4509[/C][C]18.0125[/C][/ROW]
[ROW][C]56[/C][C]-0.0098[/C][C]1.1395[/C][C]0.0317[/C][C]11909.6117[/C][C]330.8225[/C][C]18.1885[/C][/ROW]
[ROW][C]57[/C][C]-0.01[/C][C]1.4408[/C][C]0.04[/C][C]20070.3819[/C][C]557.5106[/C][C]23.6117[/C][/ROW]
[ROW][C]58[/C][C]-0.0101[/C][C]1.4509[/C][C]0.0403[/C][C]21606.3321[/C][C]600.1759[/C][C]24.4985[/C][/ROW]
[ROW][C]59[/C][C]-0.0103[/C][C]1.4736[/C][C]0.0409[/C][C]23696.2043[/C][C]658.2279[/C][C]25.656[/C][/ROW]
[ROW][C]60[/C][C]-0.0107[/C][C]1.3126[/C][C]0.0365[/C][C]20931.9919[/C][C]581.4442[/C][C]24.1132[/C][/ROW]
[/TABLE]
Source: https://freestatistics.org/blog/index.php?pk=2924&T=2

Globally Unique Identifier (entire table): ba.freestatistics.org/blog/index.php?pk=2924&T=2

As an alternative you can also use a QR Code:  

The GUIDs for individual cells are displayed in the table below:

Univariate ARIMA Extrapolation Forecast Performance
time% S.E.PEMAPESq.EMSERMSE
25-9e-040.08160.0023240.25186.67372.5833
26-0.00130.13620.0038565.679515.71333.964
27-0.00210.13960.0039591.503616.43074.0535
28-0.00290.09650.0027280.20987.78362.7899
29-0.00360.03860.001145.02071.25061.1183
30-0.00430.08630.0024236.68486.57462.5641
31-0.00520.03960.001153.81431.49481.2226
32-0.00590.03920.001154.32411.5091.2284
33-0.00630.09050.0025268.06257.44622.7288
34-0.00680.13550.0038552.345115.34293.917
35-0.00720.07470.0021154.66234.29622.0727
36-0.00740.10880.003286.09867.94722.8191
37-0.00770.04820.001351.80441.4391.1996
38-0.00780.05370.001553.71521.49211.2215
39-0.00760.28240.00781144.171631.78255.6376
40-0.00750.55480.01543627.6658100.768510.0384
41-0.00780.7570.0216408.656178.018213.3423
42-0.00751.14880.031911421.6976317.269417.8121
43-0.00771.27030.035313207.9712366.888119.1543
44-0.00791.25520.034912083.5195335.653318.3208
45-0.00791.39240.038713494.9863374.860719.3613
46-0.00821.38060.038413520.6238375.572919.3797
47-0.00871.20720.033511223.9251311.775717.6572
48-0.00911.02170.02848238.1124228.836515.1273
49-0.00960.76860.02145400.7602150.021112.2483
50-0.010.67650.01884694.8951130.413811.4199
51-0.01010.9290.02588864.7944246.244315.6922
52-0.01010.91820.02558694.5243241.514615.5407
53-0.01011.01870.028310649.1649295.810117.1991
54-0.011.04920.029110888.0889302.446917.391
55-0.00981.11730.03111680.2341324.450918.0125
56-0.00981.13950.031711909.6117330.822518.1885
57-0.011.44080.0420070.3819557.510623.6117
58-0.01011.45090.040321606.3321600.175924.4985
59-0.01031.47360.040923696.2043658.227925.656
60-0.01071.31260.036520931.9919581.444224.1132


Parameters (Session):
par1 = 36 ; par2 = -0.6 ; par3 = 1 ; par4 = 0 ; par5 = 12 ; par6 = 3 ; par7 = 2 ; par8 = 2 ; par9 = 1 ; par10 = FALSE ;
Parameters (R input):
par1 = 36 ; par2 = -0.6 ; par3 = 1 ; par4 = 0 ; par5 = 12 ; par6 = 3 ; par7 = 2 ; par8 = 2 ; par9 = 1 ; par10 = FALSE ;
R code (references can be found in the software module):
par1 <- as.numeric(par1) #cut off periods
par2 <- as.numeric(par2) #lambda
par3 <- as.numeric(par3) #degree of non-seasonal differencing
par4 <- as.numeric(par4) #degree of seasonal differencing
par5 <- as.numeric(par5) #seasonal period
par6 <- as.numeric(par6) #p
par7 <- as.numeric(par7) #q
par8 <- as.numeric(par8) #P
par9 <- as.numeric(par9) #Q
if (par10 == 'TRUE') par10 <- TRUE
if (par10 == 'FALSE') par10 <- FALSE
if (par2 == 0) x <- log(x)
if (par2 != 0) x <- x^par2
lx <- length(x)
first <- lx - 2*par1
nx <- lx - par1
nx1 <- nx + 1
fx <- lx - nx
if (fx < 1) {
fx <- par5
nx1 <- lx + fx - 1
first <- lx - 2*fx
}
first <- 1
if (fx < 3) fx <- round(lx/10,0)
(arima.out <- arima(x[1:nx], order=c(par6,par3,par7), seasonal=list(order=c(par8,par4,par9), period=par5), include.mean=par10, method='ML'))
(forecast <- predict(arima.out,fx))
(lb <- forecast$pred - 1.96 * forecast$se)
(ub <- forecast$pred + 1.96 * forecast$se)
if (par2 == 0) {
x <- exp(x)
forecast$pred <- exp(forecast$pred)
lb <- exp(lb)
ub <- exp(ub)
}
if (par2 != 0) {
x <- x^(1/par2)
forecast$pred <- forecast$pred^(1/par2)
lb <- lb^(1/par2)
ub <- ub^(1/par2)
}
(actandfor <- c(x[1:nx], forecast$pred))
(perc.se <- (ub-forecast$pred)/1.96/forecast$pred)
bitmap(file='test1.png')
opar <- par(mar=c(4,4,2,2),las=1)
ylim <- c( min(x[first:nx],lb), max(x[first:nx],ub))
plot(x,ylim=ylim,type='n',xlim=c(first,lx))
usr <- par('usr')
rect(usr[1],usr[3],nx+1,usr[4],border=NA,col='lemonchiffon')
rect(nx1,usr[3],usr[2],usr[4],border=NA,col='lavender')
abline(h= (-3:3)*2 , col ='gray', lty =3)
polygon( c(nx1:lx,lx:nx1), c(lb,rev(ub)), col = 'orange', lty=2,border=NA)
lines(nx1:lx, lb , lty=2)
lines(nx1:lx, ub , lty=2)
lines(x, lwd=2)
lines(nx1:lx, forecast$pred , lwd=2 , col ='white')
box()
par(opar)
dev.off()
prob.dec <- array(NA, dim=fx)
prob.sdec <- array(NA, dim=fx)
prob.ldec <- array(NA, dim=fx)
prob.pval <- array(NA, dim=fx)
perf.pe <- array(0, dim=fx)
perf.mape <- array(0, dim=fx)
perf.se <- array(0, dim=fx)
perf.mse <- array(0, dim=fx)
perf.rmse <- array(0, dim=fx)
for (i in 1:fx) {
locSD <- (ub[i] - forecast$pred[i]) / 1.96
perf.pe[i] = (x[nx+i] - forecast$pred[i]) / forecast$pred[i]
perf.mape[i] = perf.mape[i] + abs(perf.pe[i])
perf.se[i] = (x[nx+i] - forecast$pred[i])^2
perf.mse[i] = perf.mse[i] + perf.se[i]
prob.dec[i] = pnorm((x[nx+i-1] - forecast$pred[i]) / locSD)
prob.sdec[i] = pnorm((x[nx+i-par5] - forecast$pred[i]) / locSD)
prob.ldec[i] = pnorm((x[nx] - forecast$pred[i]) / locSD)
prob.pval[i] = pnorm(abs(x[nx+i] - forecast$pred[i]) / locSD)
}
perf.mape = perf.mape / fx
perf.mse = perf.mse / fx
perf.rmse = sqrt(perf.mse)
bitmap(file='test2.png')
plot(forecast$pred, pch=19, type='b',main='ARIMA Extrapolation Forecast', ylab='Forecast and 95% CI', xlab='time',ylim=c(min(lb),max(ub)))
dum <- forecast$pred
dum[1:12] <- x[(nx+1):lx]
lines(dum, lty=1)
lines(ub,lty=3)
lines(lb,lty=3)
dev.off()
load(file='createtable')
a<-table.start()
a<-table.row.start(a)
a<-table.element(a,'Univariate ARIMA Extrapolation Forecast',9,TRUE)
a<-table.row.end(a)
a<-table.row.start(a)
a<-table.element(a,'time',1,header=TRUE)
a<-table.element(a,'Y[t]',1,header=TRUE)
a<-table.element(a,'F[t]',1,header=TRUE)
a<-table.element(a,'95% LB',1,header=TRUE)
a<-table.element(a,'95% UB',1,header=TRUE)
a<-table.element(a,'p-value
(H0: Y[t] = F[t])',1,header=TRUE)
a<-table.element(a,'P(F[t]>Y[t-1])',1,header=TRUE)
a<-table.element(a,'P(F[t]>Y[t-s])',1,header=TRUE)
mylab <- paste('P(F[t]>Y[',nx,sep='')
mylab <- paste(mylab,'])',sep='')
a<-table.element(a,mylab,1,header=TRUE)
a<-table.row.end(a)
for (i in (nx-par5):nx) {
a<-table.row.start(a)
a<-table.element(a,i,header=TRUE)
a<-table.element(a,x[i])
a<-table.element(a,'-')
a<-table.row.end(a)
}
for (i in 1:fx) {
a<-table.row.start(a)
a<-table.element(a,nx+i,header=TRUE)
a<-table.element(a,round(x[nx+i],4))
a<-table.element(a,round(forecast$pred[i],4))
a<-table.element(a,round(lb[i],4))
a<-table.element(a,round(ub[i],4))
a<-table.element(a,round((1-prob.pval[i]),4))
a<-table.element(a,round((1-prob.dec[i]),4))
a<-table.element(a,round((1-prob.sdec[i]),4))
a<-table.element(a,round((1-prob.ldec[i]),4))
a<-table.row.end(a)
}
a<-table.end(a)
table.save(a,file='mytable.tab')
a<-table.start()
a<-table.row.start(a)
a<-table.element(a,'Univariate ARIMA Extrapolation Forecast Performance',7,TRUE)
a<-table.row.end(a)
a<-table.row.start(a)
a<-table.element(a,'time',1,header=TRUE)
a<-table.element(a,'% S.E.',1,header=TRUE)
a<-table.element(a,'PE',1,header=TRUE)
a<-table.element(a,'MAPE',1,header=TRUE)
a<-table.element(a,'Sq.E',1,header=TRUE)
a<-table.element(a,'MSE',1,header=TRUE)
a<-table.element(a,'RMSE',1,header=TRUE)
a<-table.row.end(a)
for (i in 1:fx) {
a<-table.row.start(a)
a<-table.element(a,nx+i,header=TRUE)
a<-table.element(a,round(perc.se[i],4))
a<-table.element(a,round(perf.pe[i],4))
a<-table.element(a,round(perf.mape[i],4))
a<-table.element(a,round(perf.se[i],4))
a<-table.element(a,round(perf.mse[i],4))
a<-table.element(a,round(perf.rmse[i],4))
a<-table.row.end(a)
}
a<-table.end(a)
table.save(a,file='mytable1.tab')