Free Statistics

of Irreproducible Research!

Author's title

Author*Unverified author*
R Software Modulerwasp_arimabackwardselection.wasp
Title produced by softwareARIMA Backward Selection
Date of computationFri, 07 Dec 2007 07:28:40 -0700
Cite this page as followsStatistical Computations at FreeStatistics.org, Office for Research Development and Education, URL https://freestatistics.org/blog/index.php?v=date/2007/Dec/07/t11970369623nvel78l67vpx04.htm/, Retrieved Mon, 29 Apr 2024 03:20:20 +0000
Statistical Computations at FreeStatistics.org, Office for Research Development and Education, URL https://freestatistics.org/blog/index.php?pk=2843, Retrieved Mon, 29 Apr 2024 03:20:20 +0000
QR Codes:

Original text written by user:
IsPrivate?No (this computation is public)
User-defined keywords
Estimated Impact197
Family? (F = Feedback message, R = changed R code, M = changed R Module, P = changed Parameters, D = changed Data)
-       [ARIMA Backward Selection] [Backward Selectio...] [2007-12-07 14:28:40] [ca5e0f9f346e091f4d0fe7e17f7dba21] [Current]
Feedback Forum

Post a new message
Dataseries X:
101,5
126,6
93,9
89,8
93,4
101,5
110,4
105,9
108,4
113,9
86,1
69,4
101,2
100,5
98
106,6
90,1
96,9
125,9
112
100
123,9
79,8
83,4
113,6
112,9
104
109,9
99
106,3
128,9
111,1
102,9
130
87
87,5
117,6
103,4
110,8
112,6
102,5
112,4
135,6
105,1
127,7
137
91
90,5
122,4
123,3
124,3
120
118,1
119
142,7
123,6
129,6
146,9
108,7
99,4


Summary of compuational transaction
Raw Inputview raw input (R code)
Raw Outputview raw output of R engine
Computing time11 seconds
R Server'Gwilym Jenkins' @ 72.249.127.135

\begin{tabular}{lllllllll}
\hline
Summary of compuational transaction \tabularnewline
Raw Input & view raw input (R code)  \tabularnewline
Raw Output & view raw output of R engine  \tabularnewline
Computing time & 11 seconds \tabularnewline
R Server & 'Gwilym Jenkins' @ 72.249.127.135 \tabularnewline
\hline
\end{tabular}
%Source: https://freestatistics.org/blog/index.php?pk=2843&T=0

[TABLE]
[ROW][C]Summary of compuational transaction[/C][/ROW]
[ROW][C]Raw Input[/C][C]view raw input (R code) [/C][/ROW]
[ROW][C]Raw Output[/C][C]view raw output of R engine [/C][/ROW]
[ROW][C]Computing time[/C][C]11 seconds[/C][/ROW]
[ROW][C]R Server[/C][C]'Gwilym Jenkins' @ 72.249.127.135[/C][/ROW]
[/TABLE]
Source: https://freestatistics.org/blog/index.php?pk=2843&T=0

Globally Unique Identifier (entire table): ba.freestatistics.org/blog/index.php?pk=2843&T=0

As an alternative you can also use a QR Code:  

The GUIDs for individual cells are displayed in the table below:

Summary of compuational transaction
Raw Inputview raw input (R code)
Raw Outputview raw output of R engine
Computing time11 seconds
R Server'Gwilym Jenkins' @ 72.249.127.135


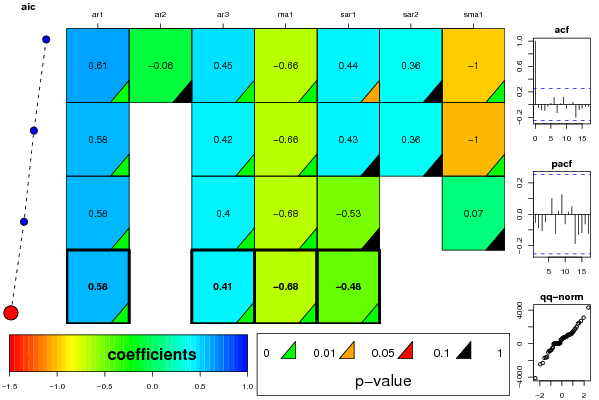
ARIMA Parameter Estimation and Backward Selection
Iterationar1ar2ar3ma1sar1sar2sma1
Estimates ( 1 )0.6081-0.06270.4543-0.6650.440.3609-0.9999
(p-val)(6e-04 )(0.7224 )(0.0069 )(0 )(0.0278 )(0.1184 )(0.0068 )
Estimates ( 2 )0.578800.4206-0.65950.43190.3647-1.0033
(p-val)(9e-04 )(NA )(0.0078 )(1e-04 )(0.1304 )(0.2166 )(0 )
Estimates ( 3 )0.584100.4009-0.6827-0.532900.0719
(p-val)(2e-04 )(NA )(0.006 )(0 )(0.2324 )(NA )(0.8966 )
Estimates ( 4 )0.579500.4057-0.6761-0.476900
(p-val)(1e-04 )(NA )(0.0043 )(0 )(0.0031 )(NA )(NA )
Estimates ( 5 )NANANANANANANA
(p-val)(NA )(NA )(NA )(NA )(NA )(NA )(NA )
Estimates ( 6 )NANANANANANANA
(p-val)(NA )(NA )(NA )(NA )(NA )(NA )(NA )

\begin{tabular}{lllllllll}
\hline
ARIMA Parameter Estimation and Backward Selection \tabularnewline
Iteration & ar1 & ar2 & ar3 & ma1 & sar1 & sar2 & sma1 \tabularnewline
Estimates ( 1 ) & 0.6081 & -0.0627 & 0.4543 & -0.665 & 0.44 & 0.3609 & -0.9999 \tabularnewline
(p-val) & (6e-04 ) & (0.7224 ) & (0.0069 ) & (0 ) & (0.0278 ) & (0.1184 ) & (0.0068 ) \tabularnewline
Estimates ( 2 ) & 0.5788 & 0 & 0.4206 & -0.6595 & 0.4319 & 0.3647 & -1.0033 \tabularnewline
(p-val) & (9e-04 ) & (NA ) & (0.0078 ) & (1e-04 ) & (0.1304 ) & (0.2166 ) & (0 ) \tabularnewline
Estimates ( 3 ) & 0.5841 & 0 & 0.4009 & -0.6827 & -0.5329 & 0 & 0.0719 \tabularnewline
(p-val) & (2e-04 ) & (NA ) & (0.006 ) & (0 ) & (0.2324 ) & (NA ) & (0.8966 ) \tabularnewline
Estimates ( 4 ) & 0.5795 & 0 & 0.4057 & -0.6761 & -0.4769 & 0 & 0 \tabularnewline
(p-val) & (1e-04 ) & (NA ) & (0.0043 ) & (0 ) & (0.0031 ) & (NA ) & (NA ) \tabularnewline
Estimates ( 5 ) & NA & NA & NA & NA & NA & NA & NA \tabularnewline
(p-val) & (NA ) & (NA ) & (NA ) & (NA ) & (NA ) & (NA ) & (NA ) \tabularnewline
Estimates ( 6 ) & NA & NA & NA & NA & NA & NA & NA \tabularnewline
(p-val) & (NA ) & (NA ) & (NA ) & (NA ) & (NA ) & (NA ) & (NA ) \tabularnewline
\hline
\end{tabular}
%Source: https://freestatistics.org/blog/index.php?pk=2843&T=1

[TABLE]
[ROW][C]ARIMA Parameter Estimation and Backward Selection[/C][/ROW]
[ROW][C]Iteration[/C][C]ar1[/C][C]ar2[/C][C]ar3[/C][C]ma1[/C][C]sar1[/C][C]sar2[/C][C]sma1[/C][/ROW]
[ROW][C]Estimates ( 1 )[/C][C]0.6081[/C][C]-0.0627[/C][C]0.4543[/C][C]-0.665[/C][C]0.44[/C][C]0.3609[/C][C]-0.9999[/C][/ROW]
[ROW][C](p-val)[/C][C](6e-04 )[/C][C](0.7224 )[/C][C](0.0069 )[/C][C](0 )[/C][C](0.0278 )[/C][C](0.1184 )[/C][C](0.0068 )[/C][/ROW]
[ROW][C]Estimates ( 2 )[/C][C]0.5788[/C][C]0[/C][C]0.4206[/C][C]-0.6595[/C][C]0.4319[/C][C]0.3647[/C][C]-1.0033[/C][/ROW]
[ROW][C](p-val)[/C][C](9e-04 )[/C][C](NA )[/C][C](0.0078 )[/C][C](1e-04 )[/C][C](0.1304 )[/C][C](0.2166 )[/C][C](0 )[/C][/ROW]
[ROW][C]Estimates ( 3 )[/C][C]0.5841[/C][C]0[/C][C]0.4009[/C][C]-0.6827[/C][C]-0.5329[/C][C]0[/C][C]0.0719[/C][/ROW]
[ROW][C](p-val)[/C][C](2e-04 )[/C][C](NA )[/C][C](0.006 )[/C][C](0 )[/C][C](0.2324 )[/C][C](NA )[/C][C](0.8966 )[/C][/ROW]
[ROW][C]Estimates ( 4 )[/C][C]0.5795[/C][C]0[/C][C]0.4057[/C][C]-0.6761[/C][C]-0.4769[/C][C]0[/C][C]0[/C][/ROW]
[ROW][C](p-val)[/C][C](1e-04 )[/C][C](NA )[/C][C](0.0043 )[/C][C](0 )[/C][C](0.0031 )[/C][C](NA )[/C][C](NA )[/C][/ROW]
[ROW][C]Estimates ( 5 )[/C][C]NA[/C][C]NA[/C][C]NA[/C][C]NA[/C][C]NA[/C][C]NA[/C][C]NA[/C][/ROW]
[ROW][C](p-val)[/C][C](NA )[/C][C](NA )[/C][C](NA )[/C][C](NA )[/C][C](NA )[/C][C](NA )[/C][C](NA )[/C][/ROW]
[ROW][C]Estimates ( 6 )[/C][C]NA[/C][C]NA[/C][C]NA[/C][C]NA[/C][C]NA[/C][C]NA[/C][C]NA[/C][/ROW]
[ROW][C](p-val)[/C][C](NA )[/C][C](NA )[/C][C](NA )[/C][C](NA )[/C][C](NA )[/C][C](NA )[/C][C](NA )[/C][/ROW]
[/TABLE]
Source: https://freestatistics.org/blog/index.php?pk=2843&T=1

Globally Unique Identifier (entire table): ba.freestatistics.org/blog/index.php?pk=2843&T=1

As an alternative you can also use a QR Code:  

The GUIDs for individual cells are displayed in the table below:

ARIMA Parameter Estimation and Backward Selection
Iterationar1ar2ar3ma1sar1sar2sma1
Estimates ( 1 )0.6081-0.06270.4543-0.6650.440.3609-0.9999
(p-val)(6e-04 )(0.7224 )(0.0069 )(0 )(0.0278 )(0.1184 )(0.0068 )
Estimates ( 2 )0.578800.4206-0.65950.43190.3647-1.0033
(p-val)(9e-04 )(NA )(0.0078 )(1e-04 )(0.1304 )(0.2166 )(0 )
Estimates ( 3 )0.584100.4009-0.6827-0.532900.0719
(p-val)(2e-04 )(NA )(0.006 )(0 )(0.2324 )(NA )(0.8966 )
Estimates ( 4 )0.579500.4057-0.6761-0.476900
(p-val)(1e-04 )(NA )(0.0043 )(0 )(0.0031 )(NA )(NA )
Estimates ( 5 )NANANANANANANA
(p-val)(NA )(NA )(NA )(NA )(NA )(NA )(NA )
Estimates ( 6 )NANANANANANANA
(p-val)(NA )(NA )(NA )(NA )(NA )(NA )(NA )


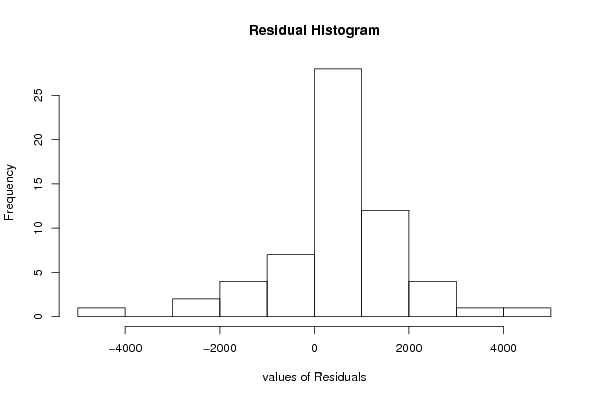
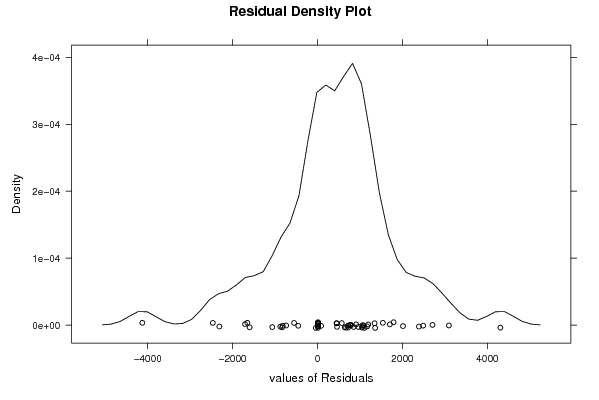
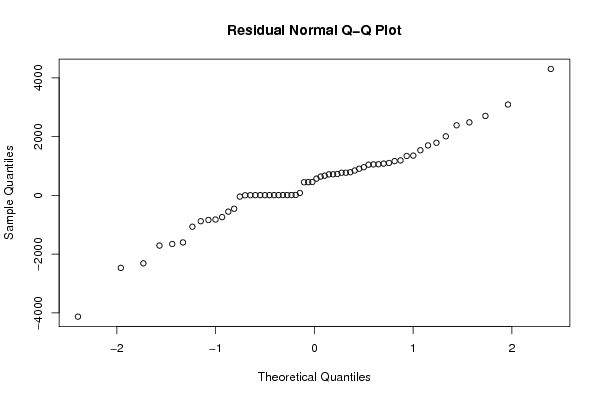
Estimated ARIMA Residuals
Value
4.81625124989096
-40.7405859454576
-4127.43177901184
1538.09680321135
3093.59359712013
1791.43203957305
447.326213633494
2706.45844677902
1355.37591997818
-738.505051596789
909.216486212919
-2312.39178409079
2487.78213425067
2011.69396697183
83.9377846766223
728.623121090734
772.394753576827
641.197212963218
452.674952010586
1046.66172581520
-877.777839412817
-1708.20887990002
671.279888297017
-552.85740161756
961.130246165213
772.299425920204
-1653.53156764065
570.783234206145
-821.217717903705
717.482501498676
1059.92691958277
1082.60738373741
-2466.13097677612
4305.80738228721
1104.50486345819
1167.88452306055
-1599.77034270801
-1065.92135163817
1342.58123044124
2387.34080062424
790.258274022624
1702.75050267666
-454.555481312378
458.414819644545
846.858198637233
719.172892236993
1192.9941395174
1056.21126544710
-836.055995202895

\begin{tabular}{lllllllll}
\hline
Estimated ARIMA Residuals \tabularnewline
Value \tabularnewline
4.81625124989096 \tabularnewline
-40.7405859454576 \tabularnewline
-4127.43177901184 \tabularnewline
1538.09680321135 \tabularnewline
3093.59359712013 \tabularnewline
1791.43203957305 \tabularnewline
447.326213633494 \tabularnewline
2706.45844677902 \tabularnewline
1355.37591997818 \tabularnewline
-738.505051596789 \tabularnewline
909.216486212919 \tabularnewline
-2312.39178409079 \tabularnewline
2487.78213425067 \tabularnewline
2011.69396697183 \tabularnewline
83.9377846766223 \tabularnewline
728.623121090734 \tabularnewline
772.394753576827 \tabularnewline
641.197212963218 \tabularnewline
452.674952010586 \tabularnewline
1046.66172581520 \tabularnewline
-877.777839412817 \tabularnewline
-1708.20887990002 \tabularnewline
671.279888297017 \tabularnewline
-552.85740161756 \tabularnewline
961.130246165213 \tabularnewline
772.299425920204 \tabularnewline
-1653.53156764065 \tabularnewline
570.783234206145 \tabularnewline
-821.217717903705 \tabularnewline
717.482501498676 \tabularnewline
1059.92691958277 \tabularnewline
1082.60738373741 \tabularnewline
-2466.13097677612 \tabularnewline
4305.80738228721 \tabularnewline
1104.50486345819 \tabularnewline
1167.88452306055 \tabularnewline
-1599.77034270801 \tabularnewline
-1065.92135163817 \tabularnewline
1342.58123044124 \tabularnewline
2387.34080062424 \tabularnewline
790.258274022624 \tabularnewline
1702.75050267666 \tabularnewline
-454.555481312378 \tabularnewline
458.414819644545 \tabularnewline
846.858198637233 \tabularnewline
719.172892236993 \tabularnewline
1192.9941395174 \tabularnewline
1056.21126544710 \tabularnewline
-836.055995202895 \tabularnewline
\hline
\end{tabular}
%Source: https://freestatistics.org/blog/index.php?pk=2843&T=2

[TABLE]
[ROW][C]Estimated ARIMA Residuals[/C][/ROW]
[ROW][C]Value[/C][/ROW]
[ROW][C]4.81625124989096[/C][/ROW]
[ROW][C]-40.7405859454576[/C][/ROW]
[ROW][C]-4127.43177901184[/C][/ROW]
[ROW][C]1538.09680321135[/C][/ROW]
[ROW][C]3093.59359712013[/C][/ROW]
[ROW][C]1791.43203957305[/C][/ROW]
[ROW][C]447.326213633494[/C][/ROW]
[ROW][C]2706.45844677902[/C][/ROW]
[ROW][C]1355.37591997818[/C][/ROW]
[ROW][C]-738.505051596789[/C][/ROW]
[ROW][C]909.216486212919[/C][/ROW]
[ROW][C]-2312.39178409079[/C][/ROW]
[ROW][C]2487.78213425067[/C][/ROW]
[ROW][C]2011.69396697183[/C][/ROW]
[ROW][C]83.9377846766223[/C][/ROW]
[ROW][C]728.623121090734[/C][/ROW]
[ROW][C]772.394753576827[/C][/ROW]
[ROW][C]641.197212963218[/C][/ROW]
[ROW][C]452.674952010586[/C][/ROW]
[ROW][C]1046.66172581520[/C][/ROW]
[ROW][C]-877.777839412817[/C][/ROW]
[ROW][C]-1708.20887990002[/C][/ROW]
[ROW][C]671.279888297017[/C][/ROW]
[ROW][C]-552.85740161756[/C][/ROW]
[ROW][C]961.130246165213[/C][/ROW]
[ROW][C]772.299425920204[/C][/ROW]
[ROW][C]-1653.53156764065[/C][/ROW]
[ROW][C]570.783234206145[/C][/ROW]
[ROW][C]-821.217717903705[/C][/ROW]
[ROW][C]717.482501498676[/C][/ROW]
[ROW][C]1059.92691958277[/C][/ROW]
[ROW][C]1082.60738373741[/C][/ROW]
[ROW][C]-2466.13097677612[/C][/ROW]
[ROW][C]4305.80738228721[/C][/ROW]
[ROW][C]1104.50486345819[/C][/ROW]
[ROW][C]1167.88452306055[/C][/ROW]
[ROW][C]-1599.77034270801[/C][/ROW]
[ROW][C]-1065.92135163817[/C][/ROW]
[ROW][C]1342.58123044124[/C][/ROW]
[ROW][C]2387.34080062424[/C][/ROW]
[ROW][C]790.258274022624[/C][/ROW]
[ROW][C]1702.75050267666[/C][/ROW]
[ROW][C]-454.555481312378[/C][/ROW]
[ROW][C]458.414819644545[/C][/ROW]
[ROW][C]846.858198637233[/C][/ROW]
[ROW][C]719.172892236993[/C][/ROW]
[ROW][C]1192.9941395174[/C][/ROW]
[ROW][C]1056.21126544710[/C][/ROW]
[ROW][C]-836.055995202895[/C][/ROW]
[/TABLE]
Source: https://freestatistics.org/blog/index.php?pk=2843&T=2

Globally Unique Identifier (entire table): ba.freestatistics.org/blog/index.php?pk=2843&T=2

As an alternative you can also use a QR Code:  

The GUIDs for individual cells are displayed in the table below:

Estimated ARIMA Residuals
Value
4.81625124989096
-40.7405859454576
-4127.43177901184
1538.09680321135
3093.59359712013
1791.43203957305
447.326213633494
2706.45844677902
1355.37591997818
-738.505051596789
909.216486212919
-2312.39178409079
2487.78213425067
2011.69396697183
83.9377846766223
728.623121090734
772.394753576827
641.197212963218
452.674952010586
1046.66172581520
-877.777839412817
-1708.20887990002
671.279888297017
-552.85740161756
961.130246165213
772.299425920204
-1653.53156764065
570.783234206145
-821.217717903705
717.482501498676
1059.92691958277
1082.60738373741
-2466.13097677612
4305.80738228721
1104.50486345819
1167.88452306055
-1599.77034270801
-1065.92135163817
1342.58123044124
2387.34080062424
790.258274022624
1702.75050267666
-454.555481312378
458.414819644545
846.858198637233
719.172892236993
1192.9941395174
1056.21126544710
-836.055995202895


Parameters (Session):
par1 = FALSE ; par2 = 2.0 ; par3 = 0 ; par4 = 1 ; par5 = 12 ; par6 = 3 ; par7 = 1 ; par8 = 2 ; par9 = 1 ;
Parameters (R input):
par1 = FALSE ; par2 = 2.0 ; par3 = 0 ; par4 = 1 ; par5 = 12 ; par6 = 3 ; par7 = 1 ; par8 = 2 ; par9 = 1 ;
R code (references can be found in the software module):
library(lattice)
if (par1 == 'TRUE') par1 <- TRUE
if (par1 == 'FALSE') par1 <- FALSE
par2 <- as.numeric(par2) #Box-Cox lambda transformation parameter
par3 <- as.numeric(par3) #degree of non-seasonal differencing
par4 <- as.numeric(par4) #degree of seasonal differencing
par5 <- as.numeric(par5) #seasonal period
par6 <- as.numeric(par6) #degree (p) of the non-seasonal AR(p) polynomial
par7 <- as.numeric(par7) #degree (q) of the non-seasonal MA(q) polynomial
par8 <- as.numeric(par8) #degree (P) of the seasonal AR(P) polynomial
par9 <- as.numeric(par9) #degree (Q) of the seasonal MA(Q) polynomial
armaGR <- function(arima.out, names, n){
try1 <- arima.out$coef
try2 <- sqrt(diag(arima.out$var.coef))
try.data.frame <- data.frame(matrix(NA,ncol=4,nrow=length(names)))
dimnames(try.data.frame) <- list(names,c('coef','std','tstat','pv'))
try.data.frame[,1] <- try1
for(i in 1:length(try2)) try.data.frame[which(rownames(try.data.frame)==names(try2)[i]),2] <- try2[i]
try.data.frame[,3] <- try.data.frame[,1] / try.data.frame[,2]
try.data.frame[,4] <- round((1-pt(abs(try.data.frame[,3]),df=n-(length(try2)+1)))*2,5)
vector <- rep(NA,length(names))
vector[is.na(try.data.frame[,4])] <- 0
maxi <- which.max(try.data.frame[,4])
continue <- max(try.data.frame[,4],na.rm=TRUE) > .05
vector[maxi] <- 0
list(summary=try.data.frame,next.vector=vector,continue=continue)
}
arimaSelect <- function(series, order=c(13,0,0), seasonal=list(order=c(2,0,0),period=12), include.mean=F){
nrc <- order[1]+order[3]+seasonal$order[1]+seasonal$order[3]
coeff <- matrix(NA, nrow=nrc, ncol=nrc)
pval <- matrix(NA, nrow=nrc, ncol=nrc)
mylist <- rep(list(NULL), nrc)
names <- NULL
if(order[1] > 0) names <- paste('ar',1:order[1],sep='')
if(order[3] > 0) names <- c( names , paste('ma',1:order[3],sep='') )
if(seasonal$order[1] > 0) names <- c(names, paste('sar',1:seasonal$order[1],sep=''))
if(seasonal$order[3] > 0) names <- c(names, paste('sma',1:seasonal$order[3],sep=''))
arima.out <- arima(series, order=order, seasonal=seasonal, include.mean=include.mean, method='ML')
mylist[[1]] <- arima.out
last.arma <- armaGR(arima.out, names, length(series))
mystop <- FALSE
i <- 1
coeff[i,] <- last.arma[[1]][,1]
pval [i,] <- last.arma[[1]][,4]
i <- 2
aic <- arima.out$aic
while(!mystop){
mylist[[i]] <- arima.out
arima.out <- arima(series, order=order, seasonal=seasonal, include.mean=include.mean, method='ML', fixed=last.arma$next.vector)
aic <- c(aic, arima.out$aic)
last.arma <- armaGR(arima.out, names, length(series))
mystop <- !last.arma$continue
coeff[i,] <- last.arma[[1]][,1]
pval [i,] <- last.arma[[1]][,4]
i <- i+1
}
list(coeff, pval, mylist, aic=aic)
}
arimaSelectplot <- function(arimaSelect.out,noms,choix){
noms <- names(arimaSelect.out[[3]][[1]]$coef)
coeff <- arimaSelect.out[[1]]
k <- min(which(is.na(coeff[,1])))-1
coeff <- coeff[1:k,]
pval <- arimaSelect.out[[2]][1:k,]
aic <- arimaSelect.out$aic[1:k]
coeff[coeff==0] <- NA
n <- ncol(coeff)
if(missing(choix)) choix <- k
layout(matrix(c(1,1,1,2,
3,3,3,2,
3,3,3,4,
5,6,7,7),nr=4),
widths=c(10,35,45,15),
heights=c(30,30,15,15))
couleurs <- rainbow(75)[1:50]#(50)
ticks <- pretty(coeff)
par(mar=c(1,1,3,1))
plot(aic,k:1-.5,type='o',pch=21,bg='blue',cex=2,axes=F,lty=2,xpd=NA)
points(aic[choix],k-choix+.5,pch=21,cex=4,bg=2,xpd=NA)
title('aic',line=2)
par(mar=c(3,0,0,0))
plot(0,axes=F,xlab='',ylab='',xlim=range(ticks),ylim=c(.1,1))
rect(xleft = min(ticks) + (0:49)/50*(max(ticks)-min(ticks)),
xright = min(ticks) + (1:50)/50*(max(ticks)-min(ticks)),
ytop = rep(1,50),
ybottom= rep(0,50),col=couleurs,border=NA)
axis(1,ticks)
rect(xleft=min(ticks),xright=max(ticks),ytop=1,ybottom=0)
text(mean(coeff,na.rm=T),.5,'coefficients',cex=2,font=2)
par(mar=c(1,1,3,1))
image(1:n,1:k,t(coeff[k:1,]),axes=F,col=couleurs,zlim=range(ticks))
for(i in 1:n) for(j in 1:k) if(!is.na(coeff[j,i])) {
if(pval[j,i]<.01) symb = 'green'
else if( (pval[j,i]<.05) & (pval[j,i]>=.01)) symb = 'orange'
else if( (pval[j,i]<.1) & (pval[j,i]>=.05)) symb = 'red'
else symb = 'black'
polygon(c(i+.5 ,i+.2 ,i+.5 ,i+.5),
c(k-j+0.5,k-j+0.5,k-j+0.8,k-j+0.5),
col=symb)
if(j==choix) {
rect(xleft=i-.5,
xright=i+.5,
ybottom=k-j+1.5,
ytop=k-j+.5,
lwd=4)
text(i,
k-j+1,
round(coeff[j,i],2),
cex=1.2,
font=2)
}
else{
rect(xleft=i-.5,xright=i+.5,ybottom=k-j+1.5,ytop=k-j+.5)
text(i,k-j+1,round(coeff[j,i],2),cex=1.2,font=1)
}
}
axis(3,1:n,noms)
par(mar=c(0.5,0,0,0.5))
plot(0,axes=F,xlab='',ylab='',type='n',xlim=c(0,8),ylim=c(-.2,.8))
cols <- c('green','orange','red','black')
niv <- c('0','0.01','0.05','0.1')
for(i in 0:3){
polygon(c(1+2*i ,1+2*i ,1+2*i-.5 ,1+2*i),
c(.4 ,.7 , .4 , .4),
col=cols[i+1])
text(2*i,0.5,niv[i+1],cex=1.5)
}
text(8,.5,1,cex=1.5)
text(4,0,'p-value',cex=2)
box()
residus <- arimaSelect.out[[3]][[choix]]$res
par(mar=c(1,2,4,1))
acf(residus,main='')
title('acf',line=.5)
par(mar=c(1,2,4,1))
pacf(residus,main='')
title('pacf',line=.5)
par(mar=c(2,2,4,1))
qqnorm(residus,main='')
title('qq-norm',line=.5)
residus
}
if (par2 == 0) x <- log(x)
if (par2 != 0) x <- x^par2
(selection <- arimaSelect(x, order=c(par6,par3,par7), seasonal=list(order=c(par8,par4,par9), period=par5)))
bitmap(file='test1.png')
resid <- arimaSelectplot(selection)
dev.off()
resid
bitmap(file='test2.png')
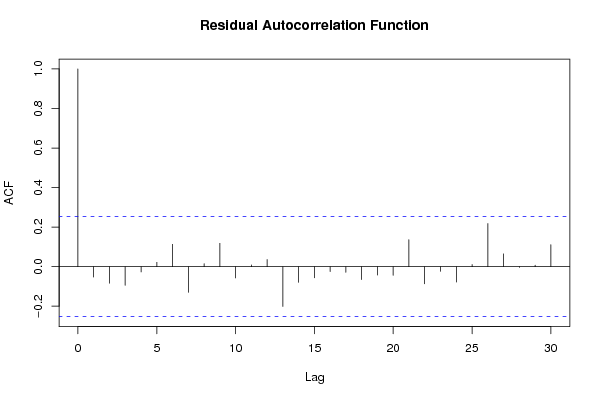
acf(resid,length(resid)/2, main='Residual Autocorrelation Function')
dev.off()
bitmap(file='test3.png')
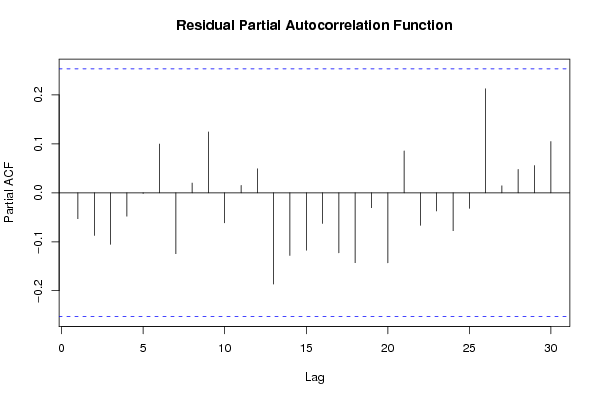
pacf(resid,length(resid)/2, main='Residual Partial Autocorrelation Function')
dev.off()
bitmap(file='test4.png')
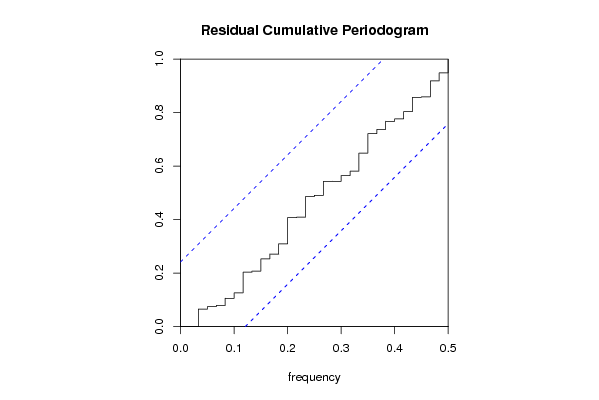
cpgram(resid, main='Residual Cumulative Periodogram')
dev.off()
bitmap(file='test5.png')
hist(resid, main='Residual Histogram', xlab='values of Residuals')
dev.off()
bitmap(file='test6.png')
densityplot(~resid,col='black',main='Residual Density Plot', xlab='values of Residuals')
dev.off()
bitmap(file='test7.png')
qqnorm(resid, main='Residual Normal Q-Q Plot')
dev.off()
ncols <- length(selection[[1]][1,])
nrows <- length(selection[[2]][,1])-1
load(file='createtable')
a<-table.start()
a<-table.row.start(a)
a<-table.element(a,'ARIMA Parameter Estimation and Backward Selection', ncols+1,TRUE)
a<-table.row.end(a)
a<-table.row.start(a)
a<-table.element(a,'Iteration', header=TRUE)
for (i in 1:ncols) {
a<-table.element(a,names(selection[[3]][[1]]$coef)[i],header=TRUE)
}
a<-table.row.end(a)
for (j in 1:nrows) {
a<-table.row.start(a)
mydum <- 'Estimates ('
mydum <- paste(mydum,j)
mydum <- paste(mydum,')')
a<-table.element(a,mydum, header=TRUE)
for (i in 1:ncols) {
a<-table.element(a,round(selection[[1]][j,i],4))
}
a<-table.row.end(a)
a<-table.row.start(a)
a<-table.element(a,'(p-val)', header=TRUE)
for (i in 1:ncols) {
mydum <- '('
mydum <- paste(mydum,round(selection[[2]][j,i],4),sep='')
mydum <- paste(mydum,')')
a<-table.element(a,mydum)
}
a<-table.row.end(a)
}
a<-table.end(a)
table.save(a,file='mytable.tab')
a<-table.start()
a<-table.row.start(a)
a<-table.element(a,'Estimated ARIMA Residuals', 1,TRUE)
a<-table.row.end(a)
a<-table.row.start(a)
a<-table.element(a,'Value', 1,TRUE)
a<-table.row.end(a)
for (i in (par4*par5+par3):length(resid)) {
a<-table.row.start(a)
a<-table.element(a,resid[i])
a<-table.row.end(a)
}
a<-table.end(a)
table.save(a,file='mytable1.tab')