Free Statistics

of Irreproducible Research!

Author's title

Author*Unverified author*
R Software Modulerwasp_arimabackwardselection.wasp
Title produced by softwareARIMA Backward Selection
Date of computationFri, 07 Dec 2007 07:16:41 -0700
Cite this page as followsStatistical Computations at FreeStatistics.org, Office for Research Development and Education, URL https://freestatistics.org/blog/index.php?v=date/2007/Dec/07/t1197036222h3m93gehs04i0vp.htm/, Retrieved Mon, 29 Apr 2024 06:28:12 +0000
Statistical Computations at FreeStatistics.org, Office for Research Development and Education, URL https://freestatistics.org/blog/index.php?pk=2838, Retrieved Mon, 29 Apr 2024 06:28:12 +0000
QR Codes:

Original text written by user:
IsPrivate?No (this computation is public)
User-defined keywords
Estimated Impact196
Family? (F = Feedback message, R = changed R code, M = changed R Module, P = changed Parameters, D = changed Data)
-       [ARIMA Backward Selection] [Backward Selectio...] [2007-12-07 14:16:41] [ca5e0f9f346e091f4d0fe7e17f7dba21] [Current]
Feedback Forum

Post a new message
Dataseries X:
99
115,4
106,9
107,1
99,3
99,2
108,3
105,6
99,5
107,4
93,1
88,1
110,7
113,1
99,6
93,6
98,6
99,6
114,3
107,8
101,2
112,5
100,5
93,9
116,2
112
106,4
95,7
96
95,8
103
102,2
98,4
111,4
86,6
91,3
107,9
101,8
104,4
93,4
100,1
98,5
112,9
101,4
107,1
110,8
90,3
95,5
111,4
113
107,5
95,9
106,3
105,2
117,2
106,9
108,2
110
96,1
100,6


Summary of compuational transaction
Raw Inputview raw input (R code)
Raw Outputview raw output of R engine
Computing time14 seconds
R Server'Herman Ole Andreas Wold' @ 193.190.124.10:1001

\begin{tabular}{lllllllll}
\hline
Summary of compuational transaction \tabularnewline
Raw Input & view raw input (R code)  \tabularnewline
Raw Output & view raw output of R engine  \tabularnewline
Computing time & 14 seconds \tabularnewline
R Server & 'Herman Ole Andreas Wold' @ 193.190.124.10:1001 \tabularnewline
\hline
\end{tabular}
%Source: https://freestatistics.org/blog/index.php?pk=2838&T=0

[TABLE]
[ROW][C]Summary of compuational transaction[/C][/ROW]
[ROW][C]Raw Input[/C][C]view raw input (R code) [/C][/ROW]
[ROW][C]Raw Output[/C][C]view raw output of R engine [/C][/ROW]
[ROW][C]Computing time[/C][C]14 seconds[/C][/ROW]
[ROW][C]R Server[/C][C]'Herman Ole Andreas Wold' @ 193.190.124.10:1001[/C][/ROW]
[/TABLE]
Source: https://freestatistics.org/blog/index.php?pk=2838&T=0

Globally Unique Identifier (entire table): ba.freestatistics.org/blog/index.php?pk=2838&T=0

As an alternative you can also use a QR Code:  

The GUIDs for individual cells are displayed in the table below:

Summary of compuational transaction
Raw Inputview raw input (R code)
Raw Outputview raw output of R engine
Computing time14 seconds
R Server'Herman Ole Andreas Wold' @ 193.190.124.10:1001


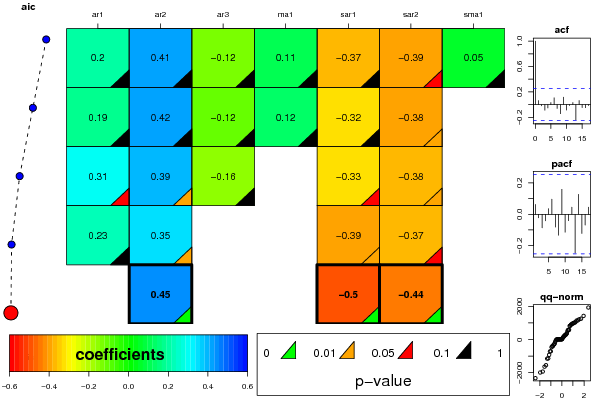
ARIMA Parameter Estimation and Backward Selection
Iterationar1ar2ar3ma1sar1sar2sma1
Estimates ( 1 )0.20270.4137-0.12320.1084-0.3651-0.39360.0492
(p-val)(0.8355 )(0.156 )(0.7476 )(0.9104 )(0.5675 )(0.076 )(0.9443 )
Estimates ( 2 )0.18960.4169-0.11840.1219-0.3227-0.38490
(p-val)(0.8458 )(0.1527 )(0.7573 )(0.899 )(0.1062 )(0.041 )(NA )
Estimates ( 3 )0.30920.3854-0.15840-0.3267-0.38350
(p-val)(0.0891 )(0.0195 )(0.3708 )(NA )(0.0986 )(0.0407 )(NA )
Estimates ( 4 )0.230.348200-0.3891-0.36820
(p-val)(0.1694 )(0.0328 )(NA )(NA )(0.0476 )(0.0511 )(NA )
Estimates ( 5 )00.453900-0.5036-0.4420
(p-val)(NA )(0.0022 )(NA )(NA )(0.0052 )(0.0085 )(NA )
Estimates ( 6 )NANANANANANANA
(p-val)(NA )(NA )(NA )(NA )(NA )(NA )(NA )

\begin{tabular}{lllllllll}
\hline
ARIMA Parameter Estimation and Backward Selection \tabularnewline
Iteration & ar1 & ar2 & ar3 & ma1 & sar1 & sar2 & sma1 \tabularnewline
Estimates ( 1 ) & 0.2027 & 0.4137 & -0.1232 & 0.1084 & -0.3651 & -0.3936 & 0.0492 \tabularnewline
(p-val) & (0.8355 ) & (0.156 ) & (0.7476 ) & (0.9104 ) & (0.5675 ) & (0.076 ) & (0.9443 ) \tabularnewline
Estimates ( 2 ) & 0.1896 & 0.4169 & -0.1184 & 0.1219 & -0.3227 & -0.3849 & 0 \tabularnewline
(p-val) & (0.8458 ) & (0.1527 ) & (0.7573 ) & (0.899 ) & (0.1062 ) & (0.041 ) & (NA ) \tabularnewline
Estimates ( 3 ) & 0.3092 & 0.3854 & -0.1584 & 0 & -0.3267 & -0.3835 & 0 \tabularnewline
(p-val) & (0.0891 ) & (0.0195 ) & (0.3708 ) & (NA ) & (0.0986 ) & (0.0407 ) & (NA ) \tabularnewline
Estimates ( 4 ) & 0.23 & 0.3482 & 0 & 0 & -0.3891 & -0.3682 & 0 \tabularnewline
(p-val) & (0.1694 ) & (0.0328 ) & (NA ) & (NA ) & (0.0476 ) & (0.0511 ) & (NA ) \tabularnewline
Estimates ( 5 ) & 0 & 0.4539 & 0 & 0 & -0.5036 & -0.442 & 0 \tabularnewline
(p-val) & (NA ) & (0.0022 ) & (NA ) & (NA ) & (0.0052 ) & (0.0085 ) & (NA ) \tabularnewline
Estimates ( 6 ) & NA & NA & NA & NA & NA & NA & NA \tabularnewline
(p-val) & (NA ) & (NA ) & (NA ) & (NA ) & (NA ) & (NA ) & (NA ) \tabularnewline
\hline
\end{tabular}
%Source: https://freestatistics.org/blog/index.php?pk=2838&T=1

[TABLE]
[ROW][C]ARIMA Parameter Estimation and Backward Selection[/C][/ROW]
[ROW][C]Iteration[/C][C]ar1[/C][C]ar2[/C][C]ar3[/C][C]ma1[/C][C]sar1[/C][C]sar2[/C][C]sma1[/C][/ROW]
[ROW][C]Estimates ( 1 )[/C][C]0.2027[/C][C]0.4137[/C][C]-0.1232[/C][C]0.1084[/C][C]-0.3651[/C][C]-0.3936[/C][C]0.0492[/C][/ROW]
[ROW][C](p-val)[/C][C](0.8355 )[/C][C](0.156 )[/C][C](0.7476 )[/C][C](0.9104 )[/C][C](0.5675 )[/C][C](0.076 )[/C][C](0.9443 )[/C][/ROW]
[ROW][C]Estimates ( 2 )[/C][C]0.1896[/C][C]0.4169[/C][C]-0.1184[/C][C]0.1219[/C][C]-0.3227[/C][C]-0.3849[/C][C]0[/C][/ROW]
[ROW][C](p-val)[/C][C](0.8458 )[/C][C](0.1527 )[/C][C](0.7573 )[/C][C](0.899 )[/C][C](0.1062 )[/C][C](0.041 )[/C][C](NA )[/C][/ROW]
[ROW][C]Estimates ( 3 )[/C][C]0.3092[/C][C]0.3854[/C][C]-0.1584[/C][C]0[/C][C]-0.3267[/C][C]-0.3835[/C][C]0[/C][/ROW]
[ROW][C](p-val)[/C][C](0.0891 )[/C][C](0.0195 )[/C][C](0.3708 )[/C][C](NA )[/C][C](0.0986 )[/C][C](0.0407 )[/C][C](NA )[/C][/ROW]
[ROW][C]Estimates ( 4 )[/C][C]0.23[/C][C]0.3482[/C][C]0[/C][C]0[/C][C]-0.3891[/C][C]-0.3682[/C][C]0[/C][/ROW]
[ROW][C](p-val)[/C][C](0.1694 )[/C][C](0.0328 )[/C][C](NA )[/C][C](NA )[/C][C](0.0476 )[/C][C](0.0511 )[/C][C](NA )[/C][/ROW]
[ROW][C]Estimates ( 5 )[/C][C]0[/C][C]0.4539[/C][C]0[/C][C]0[/C][C]-0.5036[/C][C]-0.442[/C][C]0[/C][/ROW]
[ROW][C](p-val)[/C][C](NA )[/C][C](0.0022 )[/C][C](NA )[/C][C](NA )[/C][C](0.0052 )[/C][C](0.0085 )[/C][C](NA )[/C][/ROW]
[ROW][C]Estimates ( 6 )[/C][C]NA[/C][C]NA[/C][C]NA[/C][C]NA[/C][C]NA[/C][C]NA[/C][C]NA[/C][/ROW]
[ROW][C](p-val)[/C][C](NA )[/C][C](NA )[/C][C](NA )[/C][C](NA )[/C][C](NA )[/C][C](NA )[/C][C](NA )[/C][/ROW]
[/TABLE]
Source: https://freestatistics.org/blog/index.php?pk=2838&T=1

Globally Unique Identifier (entire table): ba.freestatistics.org/blog/index.php?pk=2838&T=1

As an alternative you can also use a QR Code:  

The GUIDs for individual cells are displayed in the table below:

ARIMA Parameter Estimation and Backward Selection
Iterationar1ar2ar3ma1sar1sar2sma1
Estimates ( 1 )0.20270.4137-0.12320.1084-0.3651-0.39360.0492
(p-val)(0.8355 )(0.156 )(0.7476 )(0.9104 )(0.5675 )(0.076 )(0.9443 )
Estimates ( 2 )0.18960.4169-0.11840.1219-0.3227-0.38490
(p-val)(0.8458 )(0.1527 )(0.7573 )(0.899 )(0.1062 )(0.041 )(NA )
Estimates ( 3 )0.30920.3854-0.15840-0.3267-0.38350
(p-val)(0.0891 )(0.0195 )(0.3708 )(NA )(0.0986 )(0.0407 )(NA )
Estimates ( 4 )0.230.348200-0.3891-0.36820
(p-val)(0.1694 )(0.0328 )(NA )(NA )(0.0476 )(0.0511 )(NA )
Estimates ( 5 )00.453900-0.5036-0.4420
(p-val)(NA )(0.0022 )(NA )(NA )(0.0052 )(0.0085 )(NA )
Estimates ( 6 )NANANANANANANA
(p-val)(NA )(NA )(NA )(NA )(NA )(NA )(NA )


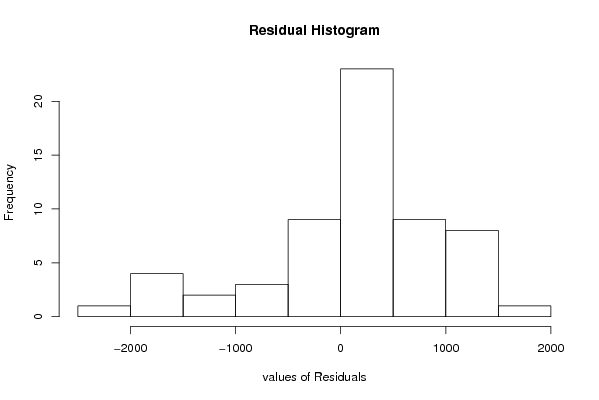
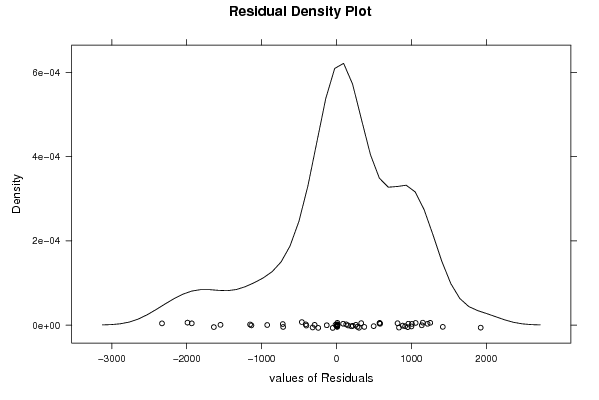
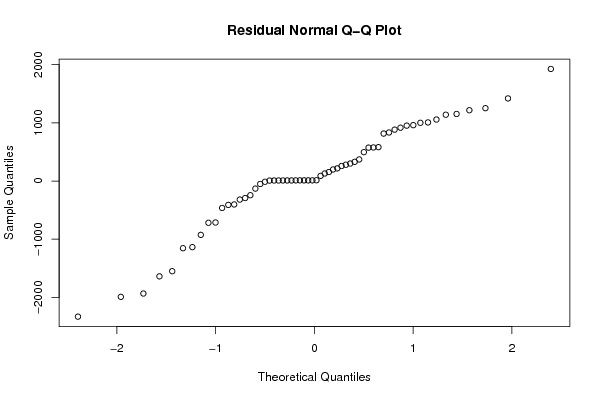
Estimated ARIMA Residuals
Value
7.76158475496236
1925.28867617708
-1153.91156273344
-1989.30362619342
-1932.44761502154
916.025400853512
959.727252272112
1251.53245925248
154.721804868451
-129.959299653452
834.163187699633
1138.70722592612
329.990422891161
1056.35563087447
-1136.03848780761
371.170082525959
-410.087236075151
-717.239500857827
-402.549629920166
-1548.85415465360
-243.683785190352
576.860896337439
573.604470414751
-1637.26962937715
279.527036844104
88.8833299231311
-2329.77914883545
300.726416009308
-318.319202120677
1000.33344201421
582.004617304793
1419.13604469897
-924.850764442135
1216.17285431424
-50.4727789726311
-462.744071983709
882.75427884091
217.308053812440
1007.00120875017
496.154785566085
-292.088293885712
951.436750140434
815.247821937861
129.364536267738
-12.7539424729530
258.070163619164
-712.430854013863
198.613494882625
1152.2383934844

\begin{tabular}{lllllllll}
\hline
Estimated ARIMA Residuals \tabularnewline
Value \tabularnewline
7.76158475496236 \tabularnewline
1925.28867617708 \tabularnewline
-1153.91156273344 \tabularnewline
-1989.30362619342 \tabularnewline
-1932.44761502154 \tabularnewline
916.025400853512 \tabularnewline
959.727252272112 \tabularnewline
1251.53245925248 \tabularnewline
154.721804868451 \tabularnewline
-129.959299653452 \tabularnewline
834.163187699633 \tabularnewline
1138.70722592612 \tabularnewline
329.990422891161 \tabularnewline
1056.35563087447 \tabularnewline
-1136.03848780761 \tabularnewline
371.170082525959 \tabularnewline
-410.087236075151 \tabularnewline
-717.239500857827 \tabularnewline
-402.549629920166 \tabularnewline
-1548.85415465360 \tabularnewline
-243.683785190352 \tabularnewline
576.860896337439 \tabularnewline
573.604470414751 \tabularnewline
-1637.26962937715 \tabularnewline
279.527036844104 \tabularnewline
88.8833299231311 \tabularnewline
-2329.77914883545 \tabularnewline
300.726416009308 \tabularnewline
-318.319202120677 \tabularnewline
1000.33344201421 \tabularnewline
582.004617304793 \tabularnewline
1419.13604469897 \tabularnewline
-924.850764442135 \tabularnewline
1216.17285431424 \tabularnewline
-50.4727789726311 \tabularnewline
-462.744071983709 \tabularnewline
882.75427884091 \tabularnewline
217.308053812440 \tabularnewline
1007.00120875017 \tabularnewline
496.154785566085 \tabularnewline
-292.088293885712 \tabularnewline
951.436750140434 \tabularnewline
815.247821937861 \tabularnewline
129.364536267738 \tabularnewline
-12.7539424729530 \tabularnewline
258.070163619164 \tabularnewline
-712.430854013863 \tabularnewline
198.613494882625 \tabularnewline
1152.2383934844 \tabularnewline
\hline
\end{tabular}
%Source: https://freestatistics.org/blog/index.php?pk=2838&T=2

[TABLE]
[ROW][C]Estimated ARIMA Residuals[/C][/ROW]
[ROW][C]Value[/C][/ROW]
[ROW][C]7.76158475496236[/C][/ROW]
[ROW][C]1925.28867617708[/C][/ROW]
[ROW][C]-1153.91156273344[/C][/ROW]
[ROW][C]-1989.30362619342[/C][/ROW]
[ROW][C]-1932.44761502154[/C][/ROW]
[ROW][C]916.025400853512[/C][/ROW]
[ROW][C]959.727252272112[/C][/ROW]
[ROW][C]1251.53245925248[/C][/ROW]
[ROW][C]154.721804868451[/C][/ROW]
[ROW][C]-129.959299653452[/C][/ROW]
[ROW][C]834.163187699633[/C][/ROW]
[ROW][C]1138.70722592612[/C][/ROW]
[ROW][C]329.990422891161[/C][/ROW]
[ROW][C]1056.35563087447[/C][/ROW]
[ROW][C]-1136.03848780761[/C][/ROW]
[ROW][C]371.170082525959[/C][/ROW]
[ROW][C]-410.087236075151[/C][/ROW]
[ROW][C]-717.239500857827[/C][/ROW]
[ROW][C]-402.549629920166[/C][/ROW]
[ROW][C]-1548.85415465360[/C][/ROW]
[ROW][C]-243.683785190352[/C][/ROW]
[ROW][C]576.860896337439[/C][/ROW]
[ROW][C]573.604470414751[/C][/ROW]
[ROW][C]-1637.26962937715[/C][/ROW]
[ROW][C]279.527036844104[/C][/ROW]
[ROW][C]88.8833299231311[/C][/ROW]
[ROW][C]-2329.77914883545[/C][/ROW]
[ROW][C]300.726416009308[/C][/ROW]
[ROW][C]-318.319202120677[/C][/ROW]
[ROW][C]1000.33344201421[/C][/ROW]
[ROW][C]582.004617304793[/C][/ROW]
[ROW][C]1419.13604469897[/C][/ROW]
[ROW][C]-924.850764442135[/C][/ROW]
[ROW][C]1216.17285431424[/C][/ROW]
[ROW][C]-50.4727789726311[/C][/ROW]
[ROW][C]-462.744071983709[/C][/ROW]
[ROW][C]882.75427884091[/C][/ROW]
[ROW][C]217.308053812440[/C][/ROW]
[ROW][C]1007.00120875017[/C][/ROW]
[ROW][C]496.154785566085[/C][/ROW]
[ROW][C]-292.088293885712[/C][/ROW]
[ROW][C]951.436750140434[/C][/ROW]
[ROW][C]815.247821937861[/C][/ROW]
[ROW][C]129.364536267738[/C][/ROW]
[ROW][C]-12.7539424729530[/C][/ROW]
[ROW][C]258.070163619164[/C][/ROW]
[ROW][C]-712.430854013863[/C][/ROW]
[ROW][C]198.613494882625[/C][/ROW]
[ROW][C]1152.2383934844[/C][/ROW]
[/TABLE]
Source: https://freestatistics.org/blog/index.php?pk=2838&T=2

Globally Unique Identifier (entire table): ba.freestatistics.org/blog/index.php?pk=2838&T=2

As an alternative you can also use a QR Code:  

The GUIDs for individual cells are displayed in the table below:

Estimated ARIMA Residuals
Value
7.76158475496236
1925.28867617708
-1153.91156273344
-1989.30362619342
-1932.44761502154
916.025400853512
959.727252272112
1251.53245925248
154.721804868451
-129.959299653452
834.163187699633
1138.70722592612
329.990422891161
1056.35563087447
-1136.03848780761
371.170082525959
-410.087236075151
-717.239500857827
-402.549629920166
-1548.85415465360
-243.683785190352
576.860896337439
573.604470414751
-1637.26962937715
279.527036844104
88.8833299231311
-2329.77914883545
300.726416009308
-318.319202120677
1000.33344201421
582.004617304793
1419.13604469897
-924.850764442135
1216.17285431424
-50.4727789726311
-462.744071983709
882.75427884091
217.308053812440
1007.00120875017
496.154785566085
-292.088293885712
951.436750140434
815.247821937861
129.364536267738
-12.7539424729530
258.070163619164
-712.430854013863
198.613494882625
1152.2383934844


Parameters (Session):
par1 = FALSE ; par2 = 2.0 ; par3 = 0 ; par4 = 1 ; par5 = 12 ; par6 = 3 ; par7 = 1 ; par8 = 2 ; par9 = 1 ;
Parameters (R input):
par1 = FALSE ; par2 = 2.0 ; par3 = 0 ; par4 = 1 ; par5 = 12 ; par6 = 3 ; par7 = 1 ; par8 = 2 ; par9 = 1 ;
R code (references can be found in the software module):
library(lattice)
if (par1 == 'TRUE') par1 <- TRUE
if (par1 == 'FALSE') par1 <- FALSE
par2 <- as.numeric(par2) #Box-Cox lambda transformation parameter
par3 <- as.numeric(par3) #degree of non-seasonal differencing
par4 <- as.numeric(par4) #degree of seasonal differencing
par5 <- as.numeric(par5) #seasonal period
par6 <- as.numeric(par6) #degree (p) of the non-seasonal AR(p) polynomial
par7 <- as.numeric(par7) #degree (q) of the non-seasonal MA(q) polynomial
par8 <- as.numeric(par8) #degree (P) of the seasonal AR(P) polynomial
par9 <- as.numeric(par9) #degree (Q) of the seasonal MA(Q) polynomial
armaGR <- function(arima.out, names, n){
try1 <- arima.out$coef
try2 <- sqrt(diag(arima.out$var.coef))
try.data.frame <- data.frame(matrix(NA,ncol=4,nrow=length(names)))
dimnames(try.data.frame) <- list(names,c('coef','std','tstat','pv'))
try.data.frame[,1] <- try1
for(i in 1:length(try2)) try.data.frame[which(rownames(try.data.frame)==names(try2)[i]),2] <- try2[i]
try.data.frame[,3] <- try.data.frame[,1] / try.data.frame[,2]
try.data.frame[,4] <- round((1-pt(abs(try.data.frame[,3]),df=n-(length(try2)+1)))*2,5)
vector <- rep(NA,length(names))
vector[is.na(try.data.frame[,4])] <- 0
maxi <- which.max(try.data.frame[,4])
continue <- max(try.data.frame[,4],na.rm=TRUE) > .05
vector[maxi] <- 0
list(summary=try.data.frame,next.vector=vector,continue=continue)
}
arimaSelect <- function(series, order=c(13,0,0), seasonal=list(order=c(2,0,0),period=12), include.mean=F){
nrc <- order[1]+order[3]+seasonal$order[1]+seasonal$order[3]
coeff <- matrix(NA, nrow=nrc, ncol=nrc)
pval <- matrix(NA, nrow=nrc, ncol=nrc)
mylist <- rep(list(NULL), nrc)
names <- NULL
if(order[1] > 0) names <- paste('ar',1:order[1],sep='')
if(order[3] > 0) names <- c( names , paste('ma',1:order[3],sep='') )
if(seasonal$order[1] > 0) names <- c(names, paste('sar',1:seasonal$order[1],sep=''))
if(seasonal$order[3] > 0) names <- c(names, paste('sma',1:seasonal$order[3],sep=''))
arima.out <- arima(series, order=order, seasonal=seasonal, include.mean=include.mean, method='ML')
mylist[[1]] <- arima.out
last.arma <- armaGR(arima.out, names, length(series))
mystop <- FALSE
i <- 1
coeff[i,] <- last.arma[[1]][,1]
pval [i,] <- last.arma[[1]][,4]
i <- 2
aic <- arima.out$aic
while(!mystop){
mylist[[i]] <- arima.out
arima.out <- arima(series, order=order, seasonal=seasonal, include.mean=include.mean, method='ML', fixed=last.arma$next.vector)
aic <- c(aic, arima.out$aic)
last.arma <- armaGR(arima.out, names, length(series))
mystop <- !last.arma$continue
coeff[i,] <- last.arma[[1]][,1]
pval [i,] <- last.arma[[1]][,4]
i <- i+1
}
list(coeff, pval, mylist, aic=aic)
}
arimaSelectplot <- function(arimaSelect.out,noms,choix){
noms <- names(arimaSelect.out[[3]][[1]]$coef)
coeff <- arimaSelect.out[[1]]
k <- min(which(is.na(coeff[,1])))-1
coeff <- coeff[1:k,]
pval <- arimaSelect.out[[2]][1:k,]
aic <- arimaSelect.out$aic[1:k]
coeff[coeff==0] <- NA
n <- ncol(coeff)
if(missing(choix)) choix <- k
layout(matrix(c(1,1,1,2,
3,3,3,2,
3,3,3,4,
5,6,7,7),nr=4),
widths=c(10,35,45,15),
heights=c(30,30,15,15))
couleurs <- rainbow(75)[1:50]#(50)
ticks <- pretty(coeff)
par(mar=c(1,1,3,1))
plot(aic,k:1-.5,type='o',pch=21,bg='blue',cex=2,axes=F,lty=2,xpd=NA)
points(aic[choix],k-choix+.5,pch=21,cex=4,bg=2,xpd=NA)
title('aic',line=2)
par(mar=c(3,0,0,0))
plot(0,axes=F,xlab='',ylab='',xlim=range(ticks),ylim=c(.1,1))
rect(xleft = min(ticks) + (0:49)/50*(max(ticks)-min(ticks)),
xright = min(ticks) + (1:50)/50*(max(ticks)-min(ticks)),
ytop = rep(1,50),
ybottom= rep(0,50),col=couleurs,border=NA)
axis(1,ticks)
rect(xleft=min(ticks),xright=max(ticks),ytop=1,ybottom=0)
text(mean(coeff,na.rm=T),.5,'coefficients',cex=2,font=2)
par(mar=c(1,1,3,1))
image(1:n,1:k,t(coeff[k:1,]),axes=F,col=couleurs,zlim=range(ticks))
for(i in 1:n) for(j in 1:k) if(!is.na(coeff[j,i])) {
if(pval[j,i]<.01) symb = 'green'
else if( (pval[j,i]<.05) & (pval[j,i]>=.01)) symb = 'orange'
else if( (pval[j,i]<.1) & (pval[j,i]>=.05)) symb = 'red'
else symb = 'black'
polygon(c(i+.5 ,i+.2 ,i+.5 ,i+.5),
c(k-j+0.5,k-j+0.5,k-j+0.8,k-j+0.5),
col=symb)
if(j==choix) {
rect(xleft=i-.5,
xright=i+.5,
ybottom=k-j+1.5,
ytop=k-j+.5,
lwd=4)
text(i,
k-j+1,
round(coeff[j,i],2),
cex=1.2,
font=2)
}
else{
rect(xleft=i-.5,xright=i+.5,ybottom=k-j+1.5,ytop=k-j+.5)
text(i,k-j+1,round(coeff[j,i],2),cex=1.2,font=1)
}
}
axis(3,1:n,noms)
par(mar=c(0.5,0,0,0.5))
plot(0,axes=F,xlab='',ylab='',type='n',xlim=c(0,8),ylim=c(-.2,.8))
cols <- c('green','orange','red','black')
niv <- c('0','0.01','0.05','0.1')
for(i in 0:3){
polygon(c(1+2*i ,1+2*i ,1+2*i-.5 ,1+2*i),
c(.4 ,.7 , .4 , .4),
col=cols[i+1])
text(2*i,0.5,niv[i+1],cex=1.5)
}
text(8,.5,1,cex=1.5)
text(4,0,'p-value',cex=2)
box()
residus <- arimaSelect.out[[3]][[choix]]$res
par(mar=c(1,2,4,1))
acf(residus,main='')
title('acf',line=.5)
par(mar=c(1,2,4,1))
pacf(residus,main='')
title('pacf',line=.5)
par(mar=c(2,2,4,1))
qqnorm(residus,main='')
title('qq-norm',line=.5)
residus
}
if (par2 == 0) x <- log(x)
if (par2 != 0) x <- x^par2
(selection <- arimaSelect(x, order=c(par6,par3,par7), seasonal=list(order=c(par8,par4,par9), period=par5)))
bitmap(file='test1.png')
resid <- arimaSelectplot(selection)
dev.off()
resid
bitmap(file='test2.png')
acf(resid,length(resid)/2, main='Residual Autocorrelation Function')
dev.off()
bitmap(file='test3.png')
pacf(resid,length(resid)/2, main='Residual Partial Autocorrelation Function')
dev.off()
bitmap(file='test4.png')
cpgram(resid, main='Residual Cumulative Periodogram')
dev.off()
bitmap(file='test5.png')
hist(resid, main='Residual Histogram', xlab='values of Residuals')
dev.off()
bitmap(file='test6.png')
densityplot(~resid,col='black',main='Residual Density Plot', xlab='values of Residuals')
dev.off()
bitmap(file='test7.png')
qqnorm(resid, main='Residual Normal Q-Q Plot')
dev.off()
ncols <- length(selection[[1]][1,])
nrows <- length(selection[[2]][,1])-1
load(file='createtable')
a<-table.start()
a<-table.row.start(a)
a<-table.element(a,'ARIMA Parameter Estimation and Backward Selection', ncols+1,TRUE)
a<-table.row.end(a)
a<-table.row.start(a)
a<-table.element(a,'Iteration', header=TRUE)
for (i in 1:ncols) {
a<-table.element(a,names(selection[[3]][[1]]$coef)[i],header=TRUE)
}
a<-table.row.end(a)
for (j in 1:nrows) {
a<-table.row.start(a)
mydum <- 'Estimates ('
mydum <- paste(mydum,j)
mydum <- paste(mydum,')')
a<-table.element(a,mydum, header=TRUE)
for (i in 1:ncols) {
a<-table.element(a,round(selection[[1]][j,i],4))
}
a<-table.row.end(a)
a<-table.row.start(a)
a<-table.element(a,'(p-val)', header=TRUE)
for (i in 1:ncols) {
mydum <- '('
mydum <- paste(mydum,round(selection[[2]][j,i],4),sep='')
mydum <- paste(mydum,')')
a<-table.element(a,mydum)
}
a<-table.row.end(a)
}
a<-table.end(a)
table.save(a,file='mytable.tab')
a<-table.start()
a<-table.row.start(a)
a<-table.element(a,'Estimated ARIMA Residuals', 1,TRUE)
a<-table.row.end(a)
a<-table.row.start(a)
a<-table.element(a,'Value', 1,TRUE)
a<-table.row.end(a)
for (i in (par4*par5+par3):length(resid)) {
a<-table.row.start(a)
a<-table.element(a,resid[i])
a<-table.row.end(a)
}
a<-table.end(a)
table.save(a,file='mytable1.tab')