Free Statistics

of Irreproducible Research!

Author's title

Author*Unverified author*
R Software Modulerwasp_cross.wasp
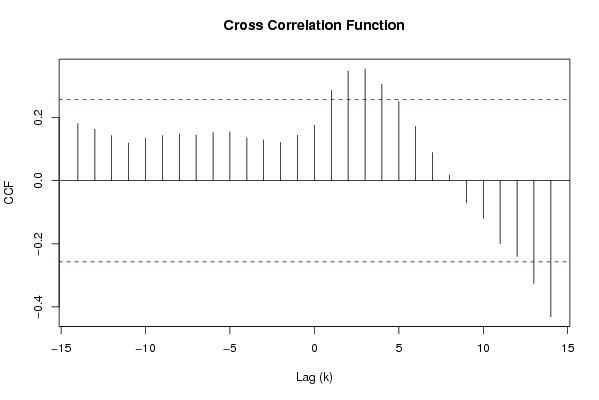
Title produced by softwareCross Correlation Function
Date of computationFri, 07 Dec 2007 07:02:44 -0700
Cite this page as followsStatistical Computations at FreeStatistics.org, Office for Research Development and Education, URL https://freestatistics.org/blog/index.php?v=date/2007/Dec/07/t1197035686vwo00nfgdlusmnm.htm/, Retrieved Mon, 29 Apr 2024 04:09:17 +0000
Statistical Computations at FreeStatistics.org, Office for Research Development and Education, URL https://freestatistics.org/blog/index.php?pk=2834, Retrieved Mon, 29 Apr 2024 04:09:17 +0000
QR Codes:

Original text written by user:
IsPrivate?No (this computation is public)
User-defined keywords
Estimated Impact204
Family? (F = Feedback message, R = changed R code, M = changed R Module, P = changed Parameters, D = changed Data)
-       [Cross Correlation Function] [Cross Correlation...] [2007-12-07 14:02:44] [9bb499d88394279c02e6a8b8cf177cf7] [Current]
Feedback Forum

Post a new message
Dataseries X:
18.33
22.6
24.9
24.8
23.8
25.1
26
27.4
27.3
24.3
28.4
24.4
30.3
31.5
29.8
25.3
25.6
26.7
27.4
28.6
26.3
28.5
28.4
29.4
30.3
29.6
32.1
32.4
36.3
34.6
36.3
40.3
40.4
45.4
39
35.7
40.2
41.7
49.1
49.6
47
52
53.1
57.8
57.9
54.6
51.3
52.7
58.5
56.6
57.9
64.4
65.1
64.6
68.9
68.8
59.3
55
55.4
58
50.8
54.6
58.6
63.6
64.5
66.9
71.9
68.7
74.2
75.8
Dataseries Y:
0.8833
0.87
0.8758
0.8858
0.917
0.9554
0.9922
0.9778
0.9808
0.9811
1.0014
1.0183
1.0622
1.0773
1.0807
1.0848
1.1582
1.1663
1.1372
1.1139
1.1222
1.1692
1.1702
1.2286
1.2613
1.2646
1.2262
1.1985
1.2007
1.2138
1.2266
1.2176
1.2218
1.249
1.2991
1.3408
1.3119
1.3014
1.3201
1.2938
1.2694
1.2165
1.2037
1.2292
1.2256
1.2015
1.1786
1.1856
1.2103
1.1938
1.202
1.2271
1.277
1.265
1.2684
1.2811
1.2727
1.2611
1.2881
1.3213
1.2999
1.3074
1.3242
1.3516
1.3511
1.3419
1.3716
1.3622
1.3896
1.4227


Summary of compuational transaction
Raw Inputview raw input (R code)
Raw Outputview raw output of R engine
Computing time1 seconds
R Server'Gwilym Jenkins' @ 72.249.127.135

\begin{tabular}{lllllllll}
\hline
Summary of compuational transaction \tabularnewline
Raw Input & view raw input (R code)  \tabularnewline
Raw Output & view raw output of R engine  \tabularnewline
Computing time & 1 seconds \tabularnewline
R Server & 'Gwilym Jenkins' @ 72.249.127.135 \tabularnewline
\hline
\end{tabular}
%Source: https://freestatistics.org/blog/index.php?pk=2834&T=0

[TABLE]
[ROW][C]Summary of compuational transaction[/C][/ROW]
[ROW][C]Raw Input[/C][C]view raw input (R code) [/C][/ROW]
[ROW][C]Raw Output[/C][C]view raw output of R engine [/C][/ROW]
[ROW][C]Computing time[/C][C]1 seconds[/C][/ROW]
[ROW][C]R Server[/C][C]'Gwilym Jenkins' @ 72.249.127.135[/C][/ROW]
[/TABLE]
Source: https://freestatistics.org/blog/index.php?pk=2834&T=0

Globally Unique Identifier (entire table): ba.freestatistics.org/blog/index.php?pk=2834&T=0

As an alternative you can also use a QR Code:  

The GUIDs for individual cells are displayed in the table below:

Summary of compuational transaction
Raw Inputview raw input (R code)
Raw Outputview raw output of R engine
Computing time1 seconds
R Server'Gwilym Jenkins' @ 72.249.127.135


Cross Correlation Function
ParameterValue
Box-Cox transformation parameter (lambda) of X series0
Degree of non-seasonal differencing (d) of X series0
Degree of seasonal differencing (D) of X series1
Seasonal Period (s)12
Box-Cox transformation parameter (lambda) of Y series0
Degree of non-seasonal differencing (d) of Y series0
Degree of seasonal differencing (D) of Y series0
krho(Y[t],X[t+k])
-140.181108376970324
-130.162527552411732
-120.142866448967664
-110.119358588707250
-100.134009321979092
-90.142606041287575
-80.148871141286918
-70.144624250842411
-60.152354763012616
-50.154550646595033
-40.135552660229752
-30.128959811270720
-20.120817952881075
-10.143619011287552
00.17539026612456
10.285368843441831
20.347224296967567
30.353994891594104
40.305636723483237
50.251104715286889
60.171685963579507
70.0891197770694813
80.0177917686529697
9-0.0702900205944198
10-0.119613717690344
11-0.199944161630687
12-0.240104499107562
13-0.325677513491895
14-0.430898919345789

\begin{tabular}{lllllllll}
\hline
Cross Correlation Function \tabularnewline
Parameter & Value \tabularnewline
Box-Cox transformation parameter (lambda) of X series & 0 \tabularnewline
Degree of non-seasonal differencing (d) of X series & 0 \tabularnewline
Degree of seasonal differencing (D) of X series & 1 \tabularnewline
Seasonal Period (s) & 12 \tabularnewline
Box-Cox transformation parameter (lambda) of Y series & 0 \tabularnewline
Degree of non-seasonal differencing (d) of Y series & 0 \tabularnewline
Degree of seasonal differencing (D) of Y series & 0 \tabularnewline
k & rho(Y[t],X[t+k]) \tabularnewline
-14 & 0.181108376970324 \tabularnewline
-13 & 0.162527552411732 \tabularnewline
-12 & 0.142866448967664 \tabularnewline
-11 & 0.119358588707250 \tabularnewline
-10 & 0.134009321979092 \tabularnewline
-9 & 0.142606041287575 \tabularnewline
-8 & 0.148871141286918 \tabularnewline
-7 & 0.144624250842411 \tabularnewline
-6 & 0.152354763012616 \tabularnewline
-5 & 0.154550646595033 \tabularnewline
-4 & 0.135552660229752 \tabularnewline
-3 & 0.128959811270720 \tabularnewline
-2 & 0.120817952881075 \tabularnewline
-1 & 0.143619011287552 \tabularnewline
0 & 0.17539026612456 \tabularnewline
1 & 0.285368843441831 \tabularnewline
2 & 0.347224296967567 \tabularnewline
3 & 0.353994891594104 \tabularnewline
4 & 0.305636723483237 \tabularnewline
5 & 0.251104715286889 \tabularnewline
6 & 0.171685963579507 \tabularnewline
7 & 0.0891197770694813 \tabularnewline
8 & 0.0177917686529697 \tabularnewline
9 & -0.0702900205944198 \tabularnewline
10 & -0.119613717690344 \tabularnewline
11 & -0.199944161630687 \tabularnewline
12 & -0.240104499107562 \tabularnewline
13 & -0.325677513491895 \tabularnewline
14 & -0.430898919345789 \tabularnewline
\hline
\end{tabular}
%Source: https://freestatistics.org/blog/index.php?pk=2834&T=1

[TABLE]
[ROW][C]Cross Correlation Function[/C][/ROW]
[ROW][C]Parameter[/C][C]Value[/C][/ROW]
[ROW][C]Box-Cox transformation parameter (lambda) of X series[/C][C]0[/C][/ROW]
[ROW][C]Degree of non-seasonal differencing (d) of X series[/C][C]0[/C][/ROW]
[ROW][C]Degree of seasonal differencing (D) of X series[/C][C]1[/C][/ROW]
[ROW][C]Seasonal Period (s)[/C][C]12[/C][/ROW]
[ROW][C]Box-Cox transformation parameter (lambda) of Y series[/C][C]0[/C][/ROW]
[ROW][C]Degree of non-seasonal differencing (d) of Y series[/C][C]0[/C][/ROW]
[ROW][C]Degree of seasonal differencing (D) of Y series[/C][C]0[/C][/ROW]
[ROW][C]k[/C][C]rho(Y[t],X[t+k])[/C][/ROW]
[ROW][C]-14[/C][C]0.181108376970324[/C][/ROW]
[ROW][C]-13[/C][C]0.162527552411732[/C][/ROW]
[ROW][C]-12[/C][C]0.142866448967664[/C][/ROW]
[ROW][C]-11[/C][C]0.119358588707250[/C][/ROW]
[ROW][C]-10[/C][C]0.134009321979092[/C][/ROW]
[ROW][C]-9[/C][C]0.142606041287575[/C][/ROW]
[ROW][C]-8[/C][C]0.148871141286918[/C][/ROW]
[ROW][C]-7[/C][C]0.144624250842411[/C][/ROW]
[ROW][C]-6[/C][C]0.152354763012616[/C][/ROW]
[ROW][C]-5[/C][C]0.154550646595033[/C][/ROW]
[ROW][C]-4[/C][C]0.135552660229752[/C][/ROW]
[ROW][C]-3[/C][C]0.128959811270720[/C][/ROW]
[ROW][C]-2[/C][C]0.120817952881075[/C][/ROW]
[ROW][C]-1[/C][C]0.143619011287552[/C][/ROW]
[ROW][C]0[/C][C]0.17539026612456[/C][/ROW]
[ROW][C]1[/C][C]0.285368843441831[/C][/ROW]
[ROW][C]2[/C][C]0.347224296967567[/C][/ROW]
[ROW][C]3[/C][C]0.353994891594104[/C][/ROW]
[ROW][C]4[/C][C]0.305636723483237[/C][/ROW]
[ROW][C]5[/C][C]0.251104715286889[/C][/ROW]
[ROW][C]6[/C][C]0.171685963579507[/C][/ROW]
[ROW][C]7[/C][C]0.0891197770694813[/C][/ROW]
[ROW][C]8[/C][C]0.0177917686529697[/C][/ROW]
[ROW][C]9[/C][C]-0.0702900205944198[/C][/ROW]
[ROW][C]10[/C][C]-0.119613717690344[/C][/ROW]
[ROW][C]11[/C][C]-0.199944161630687[/C][/ROW]
[ROW][C]12[/C][C]-0.240104499107562[/C][/ROW]
[ROW][C]13[/C][C]-0.325677513491895[/C][/ROW]
[ROW][C]14[/C][C]-0.430898919345789[/C][/ROW]
[/TABLE]
Source: https://freestatistics.org/blog/index.php?pk=2834&T=1

Globally Unique Identifier (entire table): ba.freestatistics.org/blog/index.php?pk=2834&T=1

As an alternative you can also use a QR Code:  

The GUIDs for individual cells are displayed in the table below:

Cross Correlation Function
ParameterValue
Box-Cox transformation parameter (lambda) of X series0
Degree of non-seasonal differencing (d) of X series0
Degree of seasonal differencing (D) of X series1
Seasonal Period (s)12
Box-Cox transformation parameter (lambda) of Y series0
Degree of non-seasonal differencing (d) of Y series0
Degree of seasonal differencing (D) of Y series0
krho(Y[t],X[t+k])
-140.181108376970324
-130.162527552411732
-120.142866448967664
-110.119358588707250
-100.134009321979092
-90.142606041287575
-80.148871141286918
-70.144624250842411
-60.152354763012616
-50.154550646595033
-40.135552660229752
-30.128959811270720
-20.120817952881075
-10.143619011287552
00.17539026612456
10.285368843441831
20.347224296967567
30.353994891594104
40.305636723483237
50.251104715286889
60.171685963579507
70.0891197770694813
80.0177917686529697
9-0.0702900205944198
10-0.119613717690344
11-0.199944161630687
12-0.240104499107562
13-0.325677513491895
14-0.430898919345789


Parameters (Session):
par1 = 0.0 ; par2 = 0 ; par3 = 1 ; par4 = 12 ; par5 = 0.0 ; par6 = 0 ; par7 = 0 ;
Parameters (R input):
par1 = 0.0 ; par2 = 0 ; par3 = 1 ; par4 = 12 ; par5 = 0.0 ; par6 = 0 ; par7 = 0 ;
R code (references can be found in the software module):
par1 <- as.numeric(par1)
par2 <- as.numeric(par2)
par3 <- as.numeric(par3)
par4 <- as.numeric(par4)
par5 <- as.numeric(par5)
par6 <- as.numeric(par6)
par7 <- as.numeric(par7)
if (par1 == 0) {
x <- log(x)
} else {
x <- (x ^ par1 - 1) / par1
}
if (par5 == 0) {
y <- log(y)
} else {
y <- (y ^ par5 - 1) / par5
}
if (par2 > 0) x <- diff(x,lag=1,difference=par2)
if (par6 > 0) y <- diff(y,lag=1,difference=par6)
if (par3 > 0) x <- diff(x,lag=par4,difference=par3)
if (par7 > 0) x <- diff(y,lag=par4,difference=par7)
x
y
bitmap(file='test1.png')
(r <- ccf(x,y,main='Cross Correlation Function',ylab='CCF',xlab='Lag (k)'))
dev.off()
load(file='createtable')
a<-table.start()
a<-table.row.start(a)
a<-table.element(a,'Cross Correlation Function',2,TRUE)
a<-table.row.end(a)
a<-table.row.start(a)
a<-table.element(a,'Parameter',header=TRUE)
a<-table.element(a,'Value',header=TRUE)
a<-table.row.end(a)
a<-table.row.start(a)
a<-table.element(a,'Box-Cox transformation parameter (lambda) of X series',header=TRUE)
a<-table.element(a,par1)
a<-table.row.end(a)
a<-table.row.start(a)
a<-table.element(a,'Degree of non-seasonal differencing (d) of X series',header=TRUE)
a<-table.element(a,par2)
a<-table.row.end(a)
a<-table.row.start(a)
a<-table.element(a,'Degree of seasonal differencing (D) of X series',header=TRUE)
a<-table.element(a,par3)
a<-table.row.end(a)
a<-table.row.start(a)
a<-table.element(a,'Seasonal Period (s)',header=TRUE)
a<-table.element(a,par4)
a<-table.row.end(a)
a<-table.row.start(a)
a<-table.element(a,'Box-Cox transformation parameter (lambda) of Y series',header=TRUE)
a<-table.element(a,par5)
a<-table.row.end(a)
a<-table.row.start(a)
a<-table.element(a,'Degree of non-seasonal differencing (d) of Y series',header=TRUE)
a<-table.element(a,par6)
a<-table.row.end(a)
a<-table.row.start(a)
a<-table.element(a,'Degree of seasonal differencing (D) of Y series',header=TRUE)
a<-table.element(a,par7)
a<-table.row.end(a)
a<-table.row.start(a)
a<-table.element(a,'k',header=TRUE)
a<-table.element(a,'rho(Y[t],X[t+k])',header=TRUE)
a<-table.row.end(a)
mylength <- length(r$acf)
myhalf <- floor((mylength-1)/2)
for (i in 1:mylength) {
a<-table.row.start(a)
a<-table.element(a,i-myhalf-1,header=TRUE)
a<-table.element(a,r$acf[i])
a<-table.row.end(a)
}
a<-table.end(a)
table.save(a,file='mytable.tab')