Free Statistics

of Irreproducible Research!

Author's title

Author*Unverified author*
R Software Modulerwasp_cross.wasp
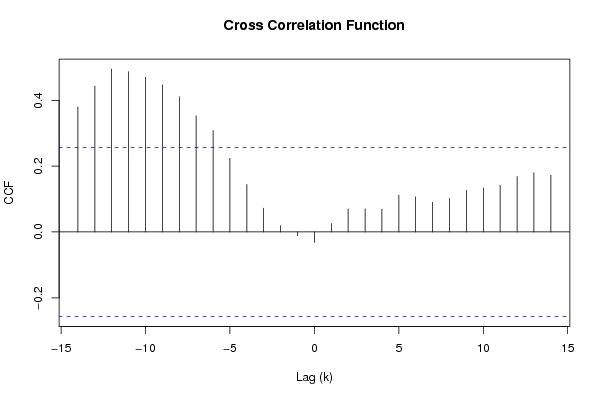
Title produced by softwareCross Correlation Function
Date of computationFri, 07 Dec 2007 06:54:07 -0700
Cite this page as followsStatistical Computations at FreeStatistics.org, Office for Research Development and Education, URL https://freestatistics.org/blog/index.php?v=date/2007/Dec/07/t1197034935ij9y835soesy5e3.htm/, Retrieved Mon, 29 Apr 2024 06:42:19 +0000
Statistical Computations at FreeStatistics.org, Office for Research Development and Education, URL https://freestatistics.org/blog/index.php?pk=2828, Retrieved Mon, 29 Apr 2024 06:42:19 +0000
QR Codes:

Original text written by user:
IsPrivate?No (this computation is public)
User-defined keywords
Estimated Impact163
Family? (F = Feedback message, R = changed R code, M = changed R Module, P = changed Parameters, D = changed Data)
-       [Cross Correlation Function] [Cross Correlation...] [2007-12-07 13:54:07] [9bb499d88394279c02e6a8b8cf177cf7] [Current]
Feedback Forum

Post a new message
Dataseries X:
18.33
22.6
24.9
24.8
23.8
25.1
26
27.4
27.3
24.3
28.4
24.4
30.3
31.5
29.8
25.3
25.6
26.7
27.4
28.6
26.3
28.5
28.4
29.4
30.3
29.6
32.1
32.4
36.3
34.6
36.3
40.3
40.4
45.4
39
35.7
40.2
41.7
49.1
49.6
47
52
53.1
57.8
57.9
54.6
51.3
52.7
58.5
56.6
57.9
64.4
65.1
64.6
68.9
68.8
59.3
55
55.4
58
50.8
54.6
58.6
63.6
64.5
66.9
71.9
68.7
74.2
75.8
Dataseries Y:
9041.46
9476.91
9420.10
9690.65
10084.25
10344.12
10086.71
9959.87
10256.23
10172.04
10258.34
10703.35
11484.51
11568.05
10991.80
10545.34
11462.71
11462.40
11285.57
11552.26
12171.38
12174.88
12531.67
13099.33
13331.94
13021.59
13040.64
13030.09
12362.41
12602.89
12794.66
12874.90
13015.84
13495.45
14123.82
14246.00
13652.94
13616.55
13934.98
13773.79
13585.12
13810.92
13657.18
14075.57
14663.08
15107.66
15358.34
16375.51
17602.60
17824.63
17892.97
19639.74
21790.73
19187.52
20357.82
20291.34
19264.86
18858.49
20156.19
20222.50
20251.14
21373.38
21091.86
21856.72
21532.48
21085.27
21388.73
21363.38
22842.24
24231.43


Summary of compuational transaction
Raw Inputview raw input (R code)
Raw Outputview raw output of R engine
Computing time1 seconds
R Server'Gwilym Jenkins' @ 72.249.127.135

\begin{tabular}{lllllllll}
\hline
Summary of compuational transaction \tabularnewline
Raw Input & view raw input (R code)  \tabularnewline
Raw Output & view raw output of R engine  \tabularnewline
Computing time & 1 seconds \tabularnewline
R Server & 'Gwilym Jenkins' @ 72.249.127.135 \tabularnewline
\hline
\end{tabular}
%Source: https://freestatistics.org/blog/index.php?pk=2828&T=0

[TABLE]
[ROW][C]Summary of compuational transaction[/C][/ROW]
[ROW][C]Raw Input[/C][C]view raw input (R code) [/C][/ROW]
[ROW][C]Raw Output[/C][C]view raw output of R engine [/C][/ROW]
[ROW][C]Computing time[/C][C]1 seconds[/C][/ROW]
[ROW][C]R Server[/C][C]'Gwilym Jenkins' @ 72.249.127.135[/C][/ROW]
[/TABLE]
Source: https://freestatistics.org/blog/index.php?pk=2828&T=0

Globally Unique Identifier (entire table): ba.freestatistics.org/blog/index.php?pk=2828&T=0

As an alternative you can also use a QR Code:  

The GUIDs for individual cells are displayed in the table below:

Summary of compuational transaction
Raw Inputview raw input (R code)
Raw Outputview raw output of R engine
Computing time1 seconds
R Server'Gwilym Jenkins' @ 72.249.127.135


Cross Correlation Function
ParameterValue
Box-Cox transformation parameter (lambda) of X series0
Degree of non-seasonal differencing (d) of X series0
Degree of seasonal differencing (D) of X series1
Seasonal Period (s)12
Box-Cox transformation parameter (lambda) of Y series0
Degree of non-seasonal differencing (d) of Y series0
Degree of seasonal differencing (D) of Y series1
krho(Y[t],X[t+k])
-140.379967651170268
-130.443478041499805
-120.495432310265645
-110.487006833172667
-100.47023740205533
-90.447161133826279
-80.410992793278694
-70.352987967358106
-60.308226401796507
-50.224049359307389
-40.144545460419049
-30.072294383013464
-20.0191560750990610
-1-0.0113354571813298
0-0.0317348286873134
10.0250314910243479
20.0701017940455596
30.0704497894972542
40.0696596734321885
50.111909997092350
60.106798250138138
70.0904104543844337
80.101944679969212
90.126211597558190
100.133840526708857
110.141923280076273
120.168673638612911
130.180235024139801
140.172111392985158

\begin{tabular}{lllllllll}
\hline
Cross Correlation Function \tabularnewline
Parameter & Value \tabularnewline
Box-Cox transformation parameter (lambda) of X series & 0 \tabularnewline
Degree of non-seasonal differencing (d) of X series & 0 \tabularnewline
Degree of seasonal differencing (D) of X series & 1 \tabularnewline
Seasonal Period (s) & 12 \tabularnewline
Box-Cox transformation parameter (lambda) of Y series & 0 \tabularnewline
Degree of non-seasonal differencing (d) of Y series & 0 \tabularnewline
Degree of seasonal differencing (D) of Y series & 1 \tabularnewline
k & rho(Y[t],X[t+k]) \tabularnewline
-14 & 0.379967651170268 \tabularnewline
-13 & 0.443478041499805 \tabularnewline
-12 & 0.495432310265645 \tabularnewline
-11 & 0.487006833172667 \tabularnewline
-10 & 0.47023740205533 \tabularnewline
-9 & 0.447161133826279 \tabularnewline
-8 & 0.410992793278694 \tabularnewline
-7 & 0.352987967358106 \tabularnewline
-6 & 0.308226401796507 \tabularnewline
-5 & 0.224049359307389 \tabularnewline
-4 & 0.144545460419049 \tabularnewline
-3 & 0.072294383013464 \tabularnewline
-2 & 0.0191560750990610 \tabularnewline
-1 & -0.0113354571813298 \tabularnewline
0 & -0.0317348286873134 \tabularnewline
1 & 0.0250314910243479 \tabularnewline
2 & 0.0701017940455596 \tabularnewline
3 & 0.0704497894972542 \tabularnewline
4 & 0.0696596734321885 \tabularnewline
5 & 0.111909997092350 \tabularnewline
6 & 0.106798250138138 \tabularnewline
7 & 0.0904104543844337 \tabularnewline
8 & 0.101944679969212 \tabularnewline
9 & 0.126211597558190 \tabularnewline
10 & 0.133840526708857 \tabularnewline
11 & 0.141923280076273 \tabularnewline
12 & 0.168673638612911 \tabularnewline
13 & 0.180235024139801 \tabularnewline
14 & 0.172111392985158 \tabularnewline
\hline
\end{tabular}
%Source: https://freestatistics.org/blog/index.php?pk=2828&T=1

[TABLE]
[ROW][C]Cross Correlation Function[/C][/ROW]
[ROW][C]Parameter[/C][C]Value[/C][/ROW]
[ROW][C]Box-Cox transformation parameter (lambda) of X series[/C][C]0[/C][/ROW]
[ROW][C]Degree of non-seasonal differencing (d) of X series[/C][C]0[/C][/ROW]
[ROW][C]Degree of seasonal differencing (D) of X series[/C][C]1[/C][/ROW]
[ROW][C]Seasonal Period (s)[/C][C]12[/C][/ROW]
[ROW][C]Box-Cox transformation parameter (lambda) of Y series[/C][C]0[/C][/ROW]
[ROW][C]Degree of non-seasonal differencing (d) of Y series[/C][C]0[/C][/ROW]
[ROW][C]Degree of seasonal differencing (D) of Y series[/C][C]1[/C][/ROW]
[ROW][C]k[/C][C]rho(Y[t],X[t+k])[/C][/ROW]
[ROW][C]-14[/C][C]0.379967651170268[/C][/ROW]
[ROW][C]-13[/C][C]0.443478041499805[/C][/ROW]
[ROW][C]-12[/C][C]0.495432310265645[/C][/ROW]
[ROW][C]-11[/C][C]0.487006833172667[/C][/ROW]
[ROW][C]-10[/C][C]0.47023740205533[/C][/ROW]
[ROW][C]-9[/C][C]0.447161133826279[/C][/ROW]
[ROW][C]-8[/C][C]0.410992793278694[/C][/ROW]
[ROW][C]-7[/C][C]0.352987967358106[/C][/ROW]
[ROW][C]-6[/C][C]0.308226401796507[/C][/ROW]
[ROW][C]-5[/C][C]0.224049359307389[/C][/ROW]
[ROW][C]-4[/C][C]0.144545460419049[/C][/ROW]
[ROW][C]-3[/C][C]0.072294383013464[/C][/ROW]
[ROW][C]-2[/C][C]0.0191560750990610[/C][/ROW]
[ROW][C]-1[/C][C]-0.0113354571813298[/C][/ROW]
[ROW][C]0[/C][C]-0.0317348286873134[/C][/ROW]
[ROW][C]1[/C][C]0.0250314910243479[/C][/ROW]
[ROW][C]2[/C][C]0.0701017940455596[/C][/ROW]
[ROW][C]3[/C][C]0.0704497894972542[/C][/ROW]
[ROW][C]4[/C][C]0.0696596734321885[/C][/ROW]
[ROW][C]5[/C][C]0.111909997092350[/C][/ROW]
[ROW][C]6[/C][C]0.106798250138138[/C][/ROW]
[ROW][C]7[/C][C]0.0904104543844337[/C][/ROW]
[ROW][C]8[/C][C]0.101944679969212[/C][/ROW]
[ROW][C]9[/C][C]0.126211597558190[/C][/ROW]
[ROW][C]10[/C][C]0.133840526708857[/C][/ROW]
[ROW][C]11[/C][C]0.141923280076273[/C][/ROW]
[ROW][C]12[/C][C]0.168673638612911[/C][/ROW]
[ROW][C]13[/C][C]0.180235024139801[/C][/ROW]
[ROW][C]14[/C][C]0.172111392985158[/C][/ROW]
[/TABLE]
Source: https://freestatistics.org/blog/index.php?pk=2828&T=1

Globally Unique Identifier (entire table): ba.freestatistics.org/blog/index.php?pk=2828&T=1

As an alternative you can also use a QR Code:  

The GUIDs for individual cells are displayed in the table below:

Cross Correlation Function
ParameterValue
Box-Cox transformation parameter (lambda) of X series0
Degree of non-seasonal differencing (d) of X series0
Degree of seasonal differencing (D) of X series1
Seasonal Period (s)12
Box-Cox transformation parameter (lambda) of Y series0
Degree of non-seasonal differencing (d) of Y series0
Degree of seasonal differencing (D) of Y series1
krho(Y[t],X[t+k])
-140.379967651170268
-130.443478041499805
-120.495432310265645
-110.487006833172667
-100.47023740205533
-90.447161133826279
-80.410992793278694
-70.352987967358106
-60.308226401796507
-50.224049359307389
-40.144545460419049
-30.072294383013464
-20.0191560750990610
-1-0.0113354571813298
0-0.0317348286873134
10.0250314910243479
20.0701017940455596
30.0704497894972542
40.0696596734321885
50.111909997092350
60.106798250138138
70.0904104543844337
80.101944679969212
90.126211597558190
100.133840526708857
110.141923280076273
120.168673638612911
130.180235024139801
140.172111392985158


Parameters (Session):
par1 = 0.0 ; par2 = 0 ; par3 = 1 ; par4 = 12 ; par5 = 0.0 ; par6 = 0 ; par7 = 1 ;
Parameters (R input):
par1 = 0.0 ; par2 = 0 ; par3 = 1 ; par4 = 12 ; par5 = 0.0 ; par6 = 0 ; par7 = 1 ;
R code (references can be found in the software module):
par1 <- as.numeric(par1)
par2 <- as.numeric(par2)
par3 <- as.numeric(par3)
par4 <- as.numeric(par4)
par5 <- as.numeric(par5)
par6 <- as.numeric(par6)
par7 <- as.numeric(par7)
if (par1 == 0) {
x <- log(x)
} else {
x <- (x ^ par1 - 1) / par1
}
if (par5 == 0) {
y <- log(y)
} else {
y <- (y ^ par5 - 1) / par5
}
if (par2 > 0) x <- diff(x,lag=1,difference=par2)
if (par6 > 0) y <- diff(y,lag=1,difference=par6)
if (par3 > 0) x <- diff(x,lag=par4,difference=par3)
if (par7 > 0) x <- diff(y,lag=par4,difference=par7)
x
y
bitmap(file='test1.png')
(r <- ccf(x,y,main='Cross Correlation Function',ylab='CCF',xlab='Lag (k)'))
dev.off()
load(file='createtable')
a<-table.start()
a<-table.row.start(a)
a<-table.element(a,'Cross Correlation Function',2,TRUE)
a<-table.row.end(a)
a<-table.row.start(a)
a<-table.element(a,'Parameter',header=TRUE)
a<-table.element(a,'Value',header=TRUE)
a<-table.row.end(a)
a<-table.row.start(a)
a<-table.element(a,'Box-Cox transformation parameter (lambda) of X series',header=TRUE)
a<-table.element(a,par1)
a<-table.row.end(a)
a<-table.row.start(a)
a<-table.element(a,'Degree of non-seasonal differencing (d) of X series',header=TRUE)
a<-table.element(a,par2)
a<-table.row.end(a)
a<-table.row.start(a)
a<-table.element(a,'Degree of seasonal differencing (D) of X series',header=TRUE)
a<-table.element(a,par3)
a<-table.row.end(a)
a<-table.row.start(a)
a<-table.element(a,'Seasonal Period (s)',header=TRUE)
a<-table.element(a,par4)
a<-table.row.end(a)
a<-table.row.start(a)
a<-table.element(a,'Box-Cox transformation parameter (lambda) of Y series',header=TRUE)
a<-table.element(a,par5)
a<-table.row.end(a)
a<-table.row.start(a)
a<-table.element(a,'Degree of non-seasonal differencing (d) of Y series',header=TRUE)
a<-table.element(a,par6)
a<-table.row.end(a)
a<-table.row.start(a)
a<-table.element(a,'Degree of seasonal differencing (D) of Y series',header=TRUE)
a<-table.element(a,par7)
a<-table.row.end(a)
a<-table.row.start(a)
a<-table.element(a,'k',header=TRUE)
a<-table.element(a,'rho(Y[t],X[t+k])',header=TRUE)
a<-table.row.end(a)
mylength <- length(r$acf)
myhalf <- floor((mylength-1)/2)
for (i in 1:mylength) {
a<-table.row.start(a)
a<-table.element(a,i-myhalf-1,header=TRUE)
a<-table.element(a,r$acf[i])
a<-table.row.end(a)
}
a<-table.end(a)
table.save(a,file='mytable.tab')