Free Statistics

of Irreproducible Research!

Author's title

Author*Unverified author*
R Software Modulerwasp_cross.wasp
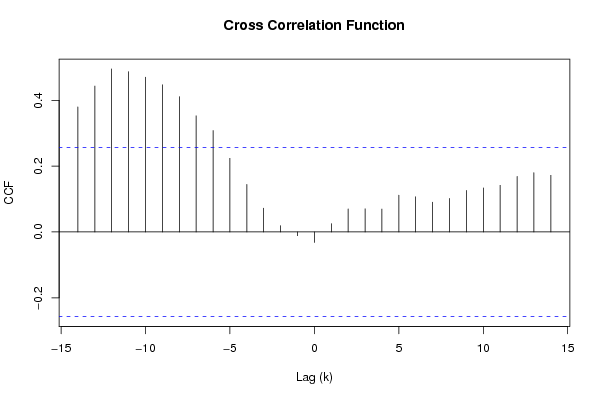
Title produced by softwareCross Correlation Function
Date of computationFri, 07 Dec 2007 06:47:53 -0700
Cite this page as followsStatistical Computations at FreeStatistics.org, Office for Research Development and Education, URL https://freestatistics.org/blog/index.php?v=date/2007/Dec/07/t1197034523hesb1ntz8s22nco.htm/, Retrieved Sun, 28 Apr 2024 23:05:35 +0000
Statistical Computations at FreeStatistics.org, Office for Research Development and Education, URL https://freestatistics.org/blog/index.php?pk=2824, Retrieved Sun, 28 Apr 2024 23:05:35 +0000
QR Codes:

Original text written by user:
IsPrivate?No (this computation is public)
User-defined keywords
Estimated Impact182
Family? (F = Feedback message, R = changed R code, M = changed R Module, P = changed Parameters, D = changed Data)
-       [Cross Correlation Function] [Cross Correlation...] [2007-12-07 13:47:53] [9bb499d88394279c02e6a8b8cf177cf7] [Current]
Feedback Forum

Post a new message
Dataseries X:
0.8833
0.87
0.8758
0.8858
0.917
0.9554
0.9922
0.9778
0.9808
0.9811
1.0014
1.0183
1.0622
1.0773
1.0807
1.0848
1.1582
1.1663
1.1372
1.1139
1.1222
1.1692
1.1702
1.2286
1.2613
1.2646
1.2262
1.1985
1.2007
1.2138
1.2266
1.2176
1.2218
1.249
1.2991
1.3408
1.3119
1.3014
1.3201
1.2938
1.2694
1.2165
1.2037
1.2292
1.2256
1.2015
1.1786
1.1856
1.2103
1.1938
1.202
1.2271
1.277
1.265
1.2684
1.2811
1.2727
1.2611
1.2881
1.3213
1.2999
1.3074
1.3242
1.3516
1.3511
1.3419
1.3716
1.3622
1.3896
1.4227
Dataseries Y:
9041.46
9476.91
9420.10
9690.65
10084.25
10344.12
10086.71
9959.87
10256.23
10172.04
10258.34
10703.35
11484.51
11568.05
10991.80
10545.34
11462.71
11462.40
11285.57
11552.26
12171.38
12174.88
12531.67
13099.33
13331.94
13021.59
13040.64
13030.09
12362.41
12602.89
12794.66
12874.90
13015.84
13495.45
14123.82
14246.00
13652.94
13616.55
13934.98
13773.79
13585.12
13810.92
13657.18
14075.57
14663.08
15107.66
15358.34
16375.51
17602.60
17824.63
17892.97
19639.74
21790.73
19187.52
20357.82
20291.34
19264.86
18858.49
20156.19
20222.50
20251.14
21373.38
21091.86
21856.72
21532.48
21085.27
21388.73
21363.38
22842.24
24231.43


Summary of compuational transaction
Raw Inputview raw input (R code)
Raw Outputview raw output of R engine
Computing time1 seconds
R Server'Gwilym Jenkins' @ 72.249.127.135

\begin{tabular}{lllllllll}
\hline
Summary of compuational transaction \tabularnewline
Raw Input & view raw input (R code)  \tabularnewline
Raw Output & view raw output of R engine  \tabularnewline
Computing time & 1 seconds \tabularnewline
R Server & 'Gwilym Jenkins' @ 72.249.127.135 \tabularnewline
\hline
\end{tabular}
%Source: https://freestatistics.org/blog/index.php?pk=2824&T=0

[TABLE]
[ROW][C]Summary of compuational transaction[/C][/ROW]
[ROW][C]Raw Input[/C][C]view raw input (R code) [/C][/ROW]
[ROW][C]Raw Output[/C][C]view raw output of R engine [/C][/ROW]
[ROW][C]Computing time[/C][C]1 seconds[/C][/ROW]
[ROW][C]R Server[/C][C]'Gwilym Jenkins' @ 72.249.127.135[/C][/ROW]
[/TABLE]
Source: https://freestatistics.org/blog/index.php?pk=2824&T=0

Globally Unique Identifier (entire table): ba.freestatistics.org/blog/index.php?pk=2824&T=0

As an alternative you can also use a QR Code:  

The GUIDs for individual cells are displayed in the table below:

Summary of compuational transaction
Raw Inputview raw input (R code)
Raw Outputview raw output of R engine
Computing time1 seconds
R Server'Gwilym Jenkins' @ 72.249.127.135


Cross Correlation Function
ParameterValue
Box-Cox transformation parameter (lambda) of X series0
Degree of non-seasonal differencing (d) of X series0
Degree of seasonal differencing (D) of X series1
Seasonal Period (s)12
Box-Cox transformation parameter (lambda) of Y series0
Degree of non-seasonal differencing (d) of Y series0
Degree of seasonal differencing (D) of Y series1
krho(Y[t],X[t+k])
-140.379967651170268
-130.443478041499805
-120.495432310265645
-110.487006833172667
-100.47023740205533
-90.447161133826279
-80.410992793278694
-70.352987967358106
-60.308226401796507
-50.224049359307389
-40.144545460419049
-30.072294383013464
-20.0191560750990610
-1-0.0113354571813298
0-0.0317348286873134
10.0250314910243479
20.0701017940455596
30.0704497894972542
40.0696596734321885
50.111909997092350
60.106798250138138
70.0904104543844337
80.101944679969212
90.126211597558190
100.133840526708857
110.141923280076273
120.168673638612911
130.180235024139801
140.172111392985158

\begin{tabular}{lllllllll}
\hline
Cross Correlation Function \tabularnewline
Parameter & Value \tabularnewline
Box-Cox transformation parameter (lambda) of X series & 0 \tabularnewline
Degree of non-seasonal differencing (d) of X series & 0 \tabularnewline
Degree of seasonal differencing (D) of X series & 1 \tabularnewline
Seasonal Period (s) & 12 \tabularnewline
Box-Cox transformation parameter (lambda) of Y series & 0 \tabularnewline
Degree of non-seasonal differencing (d) of Y series & 0 \tabularnewline
Degree of seasonal differencing (D) of Y series & 1 \tabularnewline
k & rho(Y[t],X[t+k]) \tabularnewline
-14 & 0.379967651170268 \tabularnewline
-13 & 0.443478041499805 \tabularnewline
-12 & 0.495432310265645 \tabularnewline
-11 & 0.487006833172667 \tabularnewline
-10 & 0.47023740205533 \tabularnewline
-9 & 0.447161133826279 \tabularnewline
-8 & 0.410992793278694 \tabularnewline
-7 & 0.352987967358106 \tabularnewline
-6 & 0.308226401796507 \tabularnewline
-5 & 0.224049359307389 \tabularnewline
-4 & 0.144545460419049 \tabularnewline
-3 & 0.072294383013464 \tabularnewline
-2 & 0.0191560750990610 \tabularnewline
-1 & -0.0113354571813298 \tabularnewline
0 & -0.0317348286873134 \tabularnewline
1 & 0.0250314910243479 \tabularnewline
2 & 0.0701017940455596 \tabularnewline
3 & 0.0704497894972542 \tabularnewline
4 & 0.0696596734321885 \tabularnewline
5 & 0.111909997092350 \tabularnewline
6 & 0.106798250138138 \tabularnewline
7 & 0.0904104543844337 \tabularnewline
8 & 0.101944679969212 \tabularnewline
9 & 0.126211597558190 \tabularnewline
10 & 0.133840526708857 \tabularnewline
11 & 0.141923280076273 \tabularnewline
12 & 0.168673638612911 \tabularnewline
13 & 0.180235024139801 \tabularnewline
14 & 0.172111392985158 \tabularnewline
\hline
\end{tabular}
%Source: https://freestatistics.org/blog/index.php?pk=2824&T=1

[TABLE]
[ROW][C]Cross Correlation Function[/C][/ROW]
[ROW][C]Parameter[/C][C]Value[/C][/ROW]
[ROW][C]Box-Cox transformation parameter (lambda) of X series[/C][C]0[/C][/ROW]
[ROW][C]Degree of non-seasonal differencing (d) of X series[/C][C]0[/C][/ROW]
[ROW][C]Degree of seasonal differencing (D) of X series[/C][C]1[/C][/ROW]
[ROW][C]Seasonal Period (s)[/C][C]12[/C][/ROW]
[ROW][C]Box-Cox transformation parameter (lambda) of Y series[/C][C]0[/C][/ROW]
[ROW][C]Degree of non-seasonal differencing (d) of Y series[/C][C]0[/C][/ROW]
[ROW][C]Degree of seasonal differencing (D) of Y series[/C][C]1[/C][/ROW]
[ROW][C]k[/C][C]rho(Y[t],X[t+k])[/C][/ROW]
[ROW][C]-14[/C][C]0.379967651170268[/C][/ROW]
[ROW][C]-13[/C][C]0.443478041499805[/C][/ROW]
[ROW][C]-12[/C][C]0.495432310265645[/C][/ROW]
[ROW][C]-11[/C][C]0.487006833172667[/C][/ROW]
[ROW][C]-10[/C][C]0.47023740205533[/C][/ROW]
[ROW][C]-9[/C][C]0.447161133826279[/C][/ROW]
[ROW][C]-8[/C][C]0.410992793278694[/C][/ROW]
[ROW][C]-7[/C][C]0.352987967358106[/C][/ROW]
[ROW][C]-6[/C][C]0.308226401796507[/C][/ROW]
[ROW][C]-5[/C][C]0.224049359307389[/C][/ROW]
[ROW][C]-4[/C][C]0.144545460419049[/C][/ROW]
[ROW][C]-3[/C][C]0.072294383013464[/C][/ROW]
[ROW][C]-2[/C][C]0.0191560750990610[/C][/ROW]
[ROW][C]-1[/C][C]-0.0113354571813298[/C][/ROW]
[ROW][C]0[/C][C]-0.0317348286873134[/C][/ROW]
[ROW][C]1[/C][C]0.0250314910243479[/C][/ROW]
[ROW][C]2[/C][C]0.0701017940455596[/C][/ROW]
[ROW][C]3[/C][C]0.0704497894972542[/C][/ROW]
[ROW][C]4[/C][C]0.0696596734321885[/C][/ROW]
[ROW][C]5[/C][C]0.111909997092350[/C][/ROW]
[ROW][C]6[/C][C]0.106798250138138[/C][/ROW]
[ROW][C]7[/C][C]0.0904104543844337[/C][/ROW]
[ROW][C]8[/C][C]0.101944679969212[/C][/ROW]
[ROW][C]9[/C][C]0.126211597558190[/C][/ROW]
[ROW][C]10[/C][C]0.133840526708857[/C][/ROW]
[ROW][C]11[/C][C]0.141923280076273[/C][/ROW]
[ROW][C]12[/C][C]0.168673638612911[/C][/ROW]
[ROW][C]13[/C][C]0.180235024139801[/C][/ROW]
[ROW][C]14[/C][C]0.172111392985158[/C][/ROW]
[/TABLE]
Source: https://freestatistics.org/blog/index.php?pk=2824&T=1

Globally Unique Identifier (entire table): ba.freestatistics.org/blog/index.php?pk=2824&T=1

As an alternative you can also use a QR Code:  

The GUIDs for individual cells are displayed in the table below:

Cross Correlation Function
ParameterValue
Box-Cox transformation parameter (lambda) of X series0
Degree of non-seasonal differencing (d) of X series0
Degree of seasonal differencing (D) of X series1
Seasonal Period (s)12
Box-Cox transformation parameter (lambda) of Y series0
Degree of non-seasonal differencing (d) of Y series0
Degree of seasonal differencing (D) of Y series1
krho(Y[t],X[t+k])
-140.379967651170268
-130.443478041499805
-120.495432310265645
-110.487006833172667
-100.47023740205533
-90.447161133826279
-80.410992793278694
-70.352987967358106
-60.308226401796507
-50.224049359307389
-40.144545460419049
-30.072294383013464
-20.0191560750990610
-1-0.0113354571813298
0-0.0317348286873134
10.0250314910243479
20.0701017940455596
30.0704497894972542
40.0696596734321885
50.111909997092350
60.106798250138138
70.0904104543844337
80.101944679969212
90.126211597558190
100.133840526708857
110.141923280076273
120.168673638612911
130.180235024139801
140.172111392985158


Parameters (Session):
par1 = 0.0 ; par2 = 0 ; par3 = 1 ; par4 = 12 ; par5 = 0.0 ; par6 = 0 ; par7 = 1 ;
Parameters (R input):
par1 = 0.0 ; par2 = 0 ; par3 = 1 ; par4 = 12 ; par5 = 0.0 ; par6 = 0 ; par7 = 1 ;
R code (references can be found in the software module):
par1 <- as.numeric(par1)
par2 <- as.numeric(par2)
par3 <- as.numeric(par3)
par4 <- as.numeric(par4)
par5 <- as.numeric(par5)
par6 <- as.numeric(par6)
par7 <- as.numeric(par7)
if (par1 == 0) {
x <- log(x)
} else {
x <- (x ^ par1 - 1) / par1
}
if (par5 == 0) {
y <- log(y)
} else {
y <- (y ^ par5 - 1) / par5
}
if (par2 > 0) x <- diff(x,lag=1,difference=par2)
if (par6 > 0) y <- diff(y,lag=1,difference=par6)
if (par3 > 0) x <- diff(x,lag=par4,difference=par3)
if (par7 > 0) x <- diff(y,lag=par4,difference=par7)
x
y
bitmap(file='test1.png')
(r <- ccf(x,y,main='Cross Correlation Function',ylab='CCF',xlab='Lag (k)'))
dev.off()
load(file='createtable')
a<-table.start()
a<-table.row.start(a)
a<-table.element(a,'Cross Correlation Function',2,TRUE)
a<-table.row.end(a)
a<-table.row.start(a)
a<-table.element(a,'Parameter',header=TRUE)
a<-table.element(a,'Value',header=TRUE)
a<-table.row.end(a)
a<-table.row.start(a)
a<-table.element(a,'Box-Cox transformation parameter (lambda) of X series',header=TRUE)
a<-table.element(a,par1)
a<-table.row.end(a)
a<-table.row.start(a)
a<-table.element(a,'Degree of non-seasonal differencing (d) of X series',header=TRUE)
a<-table.element(a,par2)
a<-table.row.end(a)
a<-table.row.start(a)
a<-table.element(a,'Degree of seasonal differencing (D) of X series',header=TRUE)
a<-table.element(a,par3)
a<-table.row.end(a)
a<-table.row.start(a)
a<-table.element(a,'Seasonal Period (s)',header=TRUE)
a<-table.element(a,par4)
a<-table.row.end(a)
a<-table.row.start(a)
a<-table.element(a,'Box-Cox transformation parameter (lambda) of Y series',header=TRUE)
a<-table.element(a,par5)
a<-table.row.end(a)
a<-table.row.start(a)
a<-table.element(a,'Degree of non-seasonal differencing (d) of Y series',header=TRUE)
a<-table.element(a,par6)
a<-table.row.end(a)
a<-table.row.start(a)
a<-table.element(a,'Degree of seasonal differencing (D) of Y series',header=TRUE)
a<-table.element(a,par7)
a<-table.row.end(a)
a<-table.row.start(a)
a<-table.element(a,'k',header=TRUE)
a<-table.element(a,'rho(Y[t],X[t+k])',header=TRUE)
a<-table.row.end(a)
mylength <- length(r$acf)
myhalf <- floor((mylength-1)/2)
for (i in 1:mylength) {
a<-table.row.start(a)
a<-table.element(a,i-myhalf-1,header=TRUE)
a<-table.element(a,r$acf[i])
a<-table.row.end(a)
}
a<-table.end(a)
table.save(a,file='mytable.tab')