Free Statistics

of Irreproducible Research!

Author's title

Author*Unverified author*
R Software Modulerwasp_autocorrelation.wasp
Title produced by software(Partial) Autocorrelation Function
Date of computationFri, 07 Dec 2007 06:16:07 -0700
Cite this page as followsStatistical Computations at FreeStatistics.org, Office for Research Development and Education, URL https://freestatistics.org/blog/index.php?v=date/2007/Dec/07/t1197032667jonm9l2qmwuftpg.htm/, Retrieved Mon, 29 Apr 2024 05:44:55 +0000
Statistical Computations at FreeStatistics.org, Office for Research Development and Education, URL https://freestatistics.org/blog/index.php?pk=2808, Retrieved Mon, 29 Apr 2024 05:44:55 +0000
QR Codes:

Original text written by user:
IsPrivate?No (this computation is public)
User-defined keywords
Estimated Impact179
Family? (F = Feedback message, R = changed R code, M = changed R Module, P = changed Parameters, D = changed Data)
-       [(Partial) Autocorrelation Function] [Autocorrelation F...] [2007-12-07 13:16:07] [40a229849a2b804e343854d9b3fa1a24] [Current]
Feedback Forum

Post a new message
Dataseries X:
106.48
106.83
107.14
107.94
108.46
108.81
108.92
108.99
109.16
109.22
109.43
109.23
109.93
110.09
110.33
110.11
110.35
110.09
110.44
110.39
110.62
110.43
110.46
110.55
110.94
111.56
111.82
111.73
111.57
111.85
112.06
112.2
112.47
112.15
112.36
112.32
112.67
113.02
113.05
113.5
113.67
113.65
114
114.03
114.08
114.49
114.48
114.25
114.68
115.28
115.9
115.87
116.09
116.29
116.76
116.78
116.65
116.46
116.82
116.91


Summary of compuational transaction
Raw Inputview raw input (R code)
Raw Outputview raw output of R engine
Computing time3 seconds
R Server'Herman Ole Andreas Wold' @ 193.190.124.10:1001

\begin{tabular}{lllllllll}
\hline
Summary of compuational transaction \tabularnewline
Raw Input & view raw input (R code)  \tabularnewline
Raw Output & view raw output of R engine  \tabularnewline
Computing time & 3 seconds \tabularnewline
R Server & 'Herman Ole Andreas Wold' @ 193.190.124.10:1001 \tabularnewline
\hline
\end{tabular}
%Source: https://freestatistics.org/blog/index.php?pk=2808&T=0

[TABLE]
[ROW][C]Summary of compuational transaction[/C][/ROW]
[ROW][C]Raw Input[/C][C]view raw input (R code) [/C][/ROW]
[ROW][C]Raw Output[/C][C]view raw output of R engine [/C][/ROW]
[ROW][C]Computing time[/C][C]3 seconds[/C][/ROW]
[ROW][C]R Server[/C][C]'Herman Ole Andreas Wold' @ 193.190.124.10:1001[/C][/ROW]
[/TABLE]
Source: https://freestatistics.org/blog/index.php?pk=2808&T=0

Globally Unique Identifier (entire table): ba.freestatistics.org/blog/index.php?pk=2808&T=0

As an alternative you can also use a QR Code:  

The GUIDs for individual cells are displayed in the table below:

Summary of compuational transaction
Raw Inputview raw input (R code)
Raw Outputview raw output of R engine
Computing time3 seconds
R Server'Herman Ole Andreas Wold' @ 193.190.124.10:1001


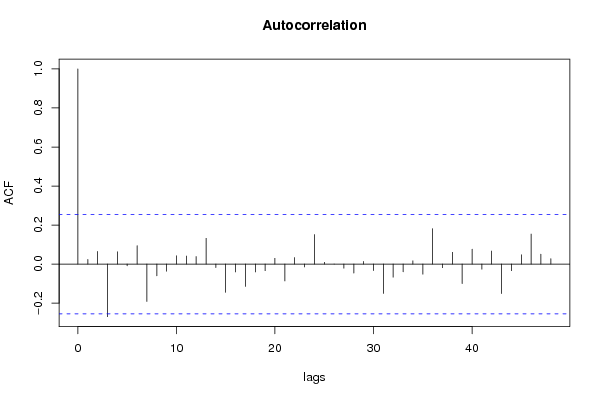
Autocorrelation Function
Time lag kACF(k)T-STATP-value
017.68110
10.0235770.18110.428456
20.065010.49940.309694
3-0.269399-2.06930.978546
40.0626420.48120.316091
5-0.008933-0.06860.527237
60.0945320.72610.235321
7-0.191436-1.47040.926623
8-0.059964-0.46060.676607
9-0.036192-0.2780.609008
100.0423720.32550.372989
110.0410880.31560.37671
120.0388340.29830.383265
130.1320771.01450.157242
14-0.018081-0.13890.554994
15-0.144768-1.1120.864671
16-0.040418-0.31050.621346
17-0.114373-0.87850.808386
18-0.040104-0.3080.620432
19-0.033899-0.26040.602263
200.029770.22870.409958
21-0.08657-0.6650.745666
220.0335840.2580.398666
23-0.014426-0.11080.543928
240.151441.16320.124709
250.0092910.07140.471676
260.0003540.00270.498918
27-0.021208-0.16290.564423
28-0.045763-0.35150.63677
290.013590.10440.45861
30-0.033103-0.25430.599913
31-0.150536-1.15630.873888
32-0.067321-0.51710.69649
33-0.039564-0.30390.618861
340.0170120.13070.448241
35-0.051557-0.3960.65324
360.1811211.39120.084692
37-0.018722-0.14380.55693
380.0601550.46210.322868
39-0.099957-0.76780.777161
400.0761810.58520.280337
41-0.025942-0.19930.578629
420.0668560.51350.30475
43-0.151368-1.16270.875179
44-0.033932-0.26060.602359
450.047250.36290.358974
460.1538551.18180.121017
470.0505370.38820.349638

\begin{tabular}{lllllllll}
\hline
Autocorrelation Function \tabularnewline
Time lag k & ACF(k) & T-STAT & P-value \tabularnewline
0 & 1 & 7.6811 & 0 \tabularnewline
1 & 0.023577 & 0.1811 & 0.428456 \tabularnewline
2 & 0.06501 & 0.4994 & 0.309694 \tabularnewline
3 & -0.269399 & -2.0693 & 0.978546 \tabularnewline
4 & 0.062642 & 0.4812 & 0.316091 \tabularnewline
5 & -0.008933 & -0.0686 & 0.527237 \tabularnewline
6 & 0.094532 & 0.7261 & 0.235321 \tabularnewline
7 & -0.191436 & -1.4704 & 0.926623 \tabularnewline
8 & -0.059964 & -0.4606 & 0.676607 \tabularnewline
9 & -0.036192 & -0.278 & 0.609008 \tabularnewline
10 & 0.042372 & 0.3255 & 0.372989 \tabularnewline
11 & 0.041088 & 0.3156 & 0.37671 \tabularnewline
12 & 0.038834 & 0.2983 & 0.383265 \tabularnewline
13 & 0.132077 & 1.0145 & 0.157242 \tabularnewline
14 & -0.018081 & -0.1389 & 0.554994 \tabularnewline
15 & -0.144768 & -1.112 & 0.864671 \tabularnewline
16 & -0.040418 & -0.3105 & 0.621346 \tabularnewline
17 & -0.114373 & -0.8785 & 0.808386 \tabularnewline
18 & -0.040104 & -0.308 & 0.620432 \tabularnewline
19 & -0.033899 & -0.2604 & 0.602263 \tabularnewline
20 & 0.02977 & 0.2287 & 0.409958 \tabularnewline
21 & -0.08657 & -0.665 & 0.745666 \tabularnewline
22 & 0.033584 & 0.258 & 0.398666 \tabularnewline
23 & -0.014426 & -0.1108 & 0.543928 \tabularnewline
24 & 0.15144 & 1.1632 & 0.124709 \tabularnewline
25 & 0.009291 & 0.0714 & 0.471676 \tabularnewline
26 & 0.000354 & 0.0027 & 0.498918 \tabularnewline
27 & -0.021208 & -0.1629 & 0.564423 \tabularnewline
28 & -0.045763 & -0.3515 & 0.63677 \tabularnewline
29 & 0.01359 & 0.1044 & 0.45861 \tabularnewline
30 & -0.033103 & -0.2543 & 0.599913 \tabularnewline
31 & -0.150536 & -1.1563 & 0.873888 \tabularnewline
32 & -0.067321 & -0.5171 & 0.69649 \tabularnewline
33 & -0.039564 & -0.3039 & 0.618861 \tabularnewline
34 & 0.017012 & 0.1307 & 0.448241 \tabularnewline
35 & -0.051557 & -0.396 & 0.65324 \tabularnewline
36 & 0.181121 & 1.3912 & 0.084692 \tabularnewline
37 & -0.018722 & -0.1438 & 0.55693 \tabularnewline
38 & 0.060155 & 0.4621 & 0.322868 \tabularnewline
39 & -0.099957 & -0.7678 & 0.777161 \tabularnewline
40 & 0.076181 & 0.5852 & 0.280337 \tabularnewline
41 & -0.025942 & -0.1993 & 0.578629 \tabularnewline
42 & 0.066856 & 0.5135 & 0.30475 \tabularnewline
43 & -0.151368 & -1.1627 & 0.875179 \tabularnewline
44 & -0.033932 & -0.2606 & 0.602359 \tabularnewline
45 & 0.04725 & 0.3629 & 0.358974 \tabularnewline
46 & 0.153855 & 1.1818 & 0.121017 \tabularnewline
47 & 0.050537 & 0.3882 & 0.349638 \tabularnewline
\hline
\end{tabular}
%Source: https://freestatistics.org/blog/index.php?pk=2808&T=1

[TABLE]
[ROW][C]Autocorrelation Function[/C][/ROW]
[ROW][C]Time lag k[/C][C]ACF(k)[/C][C]T-STAT[/C][C]P-value[/C][/ROW]
[ROW][C]0[/C][C]1[/C][C]7.6811[/C][C]0[/C][/ROW]
[ROW][C]1[/C][C]0.023577[/C][C]0.1811[/C][C]0.428456[/C][/ROW]
[ROW][C]2[/C][C]0.06501[/C][C]0.4994[/C][C]0.309694[/C][/ROW]
[ROW][C]3[/C][C]-0.269399[/C][C]-2.0693[/C][C]0.978546[/C][/ROW]
[ROW][C]4[/C][C]0.062642[/C][C]0.4812[/C][C]0.316091[/C][/ROW]
[ROW][C]5[/C][C]-0.008933[/C][C]-0.0686[/C][C]0.527237[/C][/ROW]
[ROW][C]6[/C][C]0.094532[/C][C]0.7261[/C][C]0.235321[/C][/ROW]
[ROW][C]7[/C][C]-0.191436[/C][C]-1.4704[/C][C]0.926623[/C][/ROW]
[ROW][C]8[/C][C]-0.059964[/C][C]-0.4606[/C][C]0.676607[/C][/ROW]
[ROW][C]9[/C][C]-0.036192[/C][C]-0.278[/C][C]0.609008[/C][/ROW]
[ROW][C]10[/C][C]0.042372[/C][C]0.3255[/C][C]0.372989[/C][/ROW]
[ROW][C]11[/C][C]0.041088[/C][C]0.3156[/C][C]0.37671[/C][/ROW]
[ROW][C]12[/C][C]0.038834[/C][C]0.2983[/C][C]0.383265[/C][/ROW]
[ROW][C]13[/C][C]0.132077[/C][C]1.0145[/C][C]0.157242[/C][/ROW]
[ROW][C]14[/C][C]-0.018081[/C][C]-0.1389[/C][C]0.554994[/C][/ROW]
[ROW][C]15[/C][C]-0.144768[/C][C]-1.112[/C][C]0.864671[/C][/ROW]
[ROW][C]16[/C][C]-0.040418[/C][C]-0.3105[/C][C]0.621346[/C][/ROW]
[ROW][C]17[/C][C]-0.114373[/C][C]-0.8785[/C][C]0.808386[/C][/ROW]
[ROW][C]18[/C][C]-0.040104[/C][C]-0.308[/C][C]0.620432[/C][/ROW]
[ROW][C]19[/C][C]-0.033899[/C][C]-0.2604[/C][C]0.602263[/C][/ROW]
[ROW][C]20[/C][C]0.02977[/C][C]0.2287[/C][C]0.409958[/C][/ROW]
[ROW][C]21[/C][C]-0.08657[/C][C]-0.665[/C][C]0.745666[/C][/ROW]
[ROW][C]22[/C][C]0.033584[/C][C]0.258[/C][C]0.398666[/C][/ROW]
[ROW][C]23[/C][C]-0.014426[/C][C]-0.1108[/C][C]0.543928[/C][/ROW]
[ROW][C]24[/C][C]0.15144[/C][C]1.1632[/C][C]0.124709[/C][/ROW]
[ROW][C]25[/C][C]0.009291[/C][C]0.0714[/C][C]0.471676[/C][/ROW]
[ROW][C]26[/C][C]0.000354[/C][C]0.0027[/C][C]0.498918[/C][/ROW]
[ROW][C]27[/C][C]-0.021208[/C][C]-0.1629[/C][C]0.564423[/C][/ROW]
[ROW][C]28[/C][C]-0.045763[/C][C]-0.3515[/C][C]0.63677[/C][/ROW]
[ROW][C]29[/C][C]0.01359[/C][C]0.1044[/C][C]0.45861[/C][/ROW]
[ROW][C]30[/C][C]-0.033103[/C][C]-0.2543[/C][C]0.599913[/C][/ROW]
[ROW][C]31[/C][C]-0.150536[/C][C]-1.1563[/C][C]0.873888[/C][/ROW]
[ROW][C]32[/C][C]-0.067321[/C][C]-0.5171[/C][C]0.69649[/C][/ROW]
[ROW][C]33[/C][C]-0.039564[/C][C]-0.3039[/C][C]0.618861[/C][/ROW]
[ROW][C]34[/C][C]0.017012[/C][C]0.1307[/C][C]0.448241[/C][/ROW]
[ROW][C]35[/C][C]-0.051557[/C][C]-0.396[/C][C]0.65324[/C][/ROW]
[ROW][C]36[/C][C]0.181121[/C][C]1.3912[/C][C]0.084692[/C][/ROW]
[ROW][C]37[/C][C]-0.018722[/C][C]-0.1438[/C][C]0.55693[/C][/ROW]
[ROW][C]38[/C][C]0.060155[/C][C]0.4621[/C][C]0.322868[/C][/ROW]
[ROW][C]39[/C][C]-0.099957[/C][C]-0.7678[/C][C]0.777161[/C][/ROW]
[ROW][C]40[/C][C]0.076181[/C][C]0.5852[/C][C]0.280337[/C][/ROW]
[ROW][C]41[/C][C]-0.025942[/C][C]-0.1993[/C][C]0.578629[/C][/ROW]
[ROW][C]42[/C][C]0.066856[/C][C]0.5135[/C][C]0.30475[/C][/ROW]
[ROW][C]43[/C][C]-0.151368[/C][C]-1.1627[/C][C]0.875179[/C][/ROW]
[ROW][C]44[/C][C]-0.033932[/C][C]-0.2606[/C][C]0.602359[/C][/ROW]
[ROW][C]45[/C][C]0.04725[/C][C]0.3629[/C][C]0.358974[/C][/ROW]
[ROW][C]46[/C][C]0.153855[/C][C]1.1818[/C][C]0.121017[/C][/ROW]
[ROW][C]47[/C][C]0.050537[/C][C]0.3882[/C][C]0.349638[/C][/ROW]
[/TABLE]
Source: https://freestatistics.org/blog/index.php?pk=2808&T=1

Globally Unique Identifier (entire table): ba.freestatistics.org/blog/index.php?pk=2808&T=1

As an alternative you can also use a QR Code:  

The GUIDs for individual cells are displayed in the table below:

Autocorrelation Function
Time lag kACF(k)T-STATP-value
017.68110
10.0235770.18110.428456
20.065010.49940.309694
3-0.269399-2.06930.978546
40.0626420.48120.316091
5-0.008933-0.06860.527237
60.0945320.72610.235321
7-0.191436-1.47040.926623
8-0.059964-0.46060.676607
9-0.036192-0.2780.609008
100.0423720.32550.372989
110.0410880.31560.37671
120.0388340.29830.383265
130.1320771.01450.157242
14-0.018081-0.13890.554994
15-0.144768-1.1120.864671
16-0.040418-0.31050.621346
17-0.114373-0.87850.808386
18-0.040104-0.3080.620432
19-0.033899-0.26040.602263
200.029770.22870.409958
21-0.08657-0.6650.745666
220.0335840.2580.398666
23-0.014426-0.11080.543928
240.151441.16320.124709
250.0092910.07140.471676
260.0003540.00270.498918
27-0.021208-0.16290.564423
28-0.045763-0.35150.63677
290.013590.10440.45861
30-0.033103-0.25430.599913
31-0.150536-1.15630.873888
32-0.067321-0.51710.69649
33-0.039564-0.30390.618861
340.0170120.13070.448241
35-0.051557-0.3960.65324
360.1811211.39120.084692
37-0.018722-0.14380.55693
380.0601550.46210.322868
39-0.099957-0.76780.777161
400.0761810.58520.280337
41-0.025942-0.19930.578629
420.0668560.51350.30475
43-0.151368-1.16270.875179
44-0.033932-0.26060.602359
450.047250.36290.358974
460.1538551.18180.121017
470.0505370.38820.349638


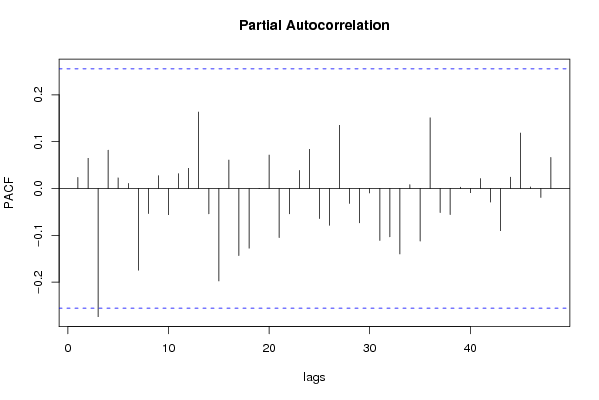
Partial Autocorrelation Function
Time lag kPACF(k)T-STATP-value
00.0235770.18110.428456
10.064490.49540.311094
2-0.273643-2.10190.980079
30.0816760.62740.266419
40.0226350.17390.431285
50.0108080.0830.46706
6-0.174494-1.34030.907359
7-0.053569-0.41150.658892
80.0272760.20950.417385
9-0.055937-0.42970.665496
100.0315630.24240.40464
110.0431740.33160.370674
120.1631061.25280.107603
13-0.054152-0.4160.660522
14-0.197332-1.51570.932537
150.0606780.46610.321438
16-0.14311-1.09920.861937
17-0.127359-0.97830.83403
18-0.000445-0.00340.501359
190.0712650.54740.293087
20-0.104736-0.80450.787828
21-0.054178-0.41620.660595
220.0385950.29650.383961
230.0835690.64190.261709
24-0.064337-0.49420.688495
25-0.078528-0.60320.725651
260.1347441.0350.152449
27-0.031872-0.24480.596273
28-0.073418-0.56390.712532
29-0.009616-0.07390.529314
30-0.110903-0.85190.801133
31-0.103208-0.79280.784452
32-0.139762-1.07350.856298
330.0080880.06210.475336
34-0.112188-0.86170.803837
350.1508791.15890.125579
36-0.051416-0.39490.652842
37-0.055806-0.42870.665131
380.0027820.02140.491511
39-0.008962-0.06880.527324
400.0210390.16160.436087
41-0.029074-0.22330.587972
42-0.09001-0.69140.75398
430.0241270.18530.426806
440.118410.90950.183387
450.0031970.02460.490246
46-0.019108-0.14680.558092
470.0663320.50950.30615

\begin{tabular}{lllllllll}
\hline
Partial Autocorrelation Function \tabularnewline
Time lag k & PACF(k) & T-STAT & P-value \tabularnewline
0 & 0.023577 & 0.1811 & 0.428456 \tabularnewline
1 & 0.06449 & 0.4954 & 0.311094 \tabularnewline
2 & -0.273643 & -2.1019 & 0.980079 \tabularnewline
3 & 0.081676 & 0.6274 & 0.266419 \tabularnewline
4 & 0.022635 & 0.1739 & 0.431285 \tabularnewline
5 & 0.010808 & 0.083 & 0.46706 \tabularnewline
6 & -0.174494 & -1.3403 & 0.907359 \tabularnewline
7 & -0.053569 & -0.4115 & 0.658892 \tabularnewline
8 & 0.027276 & 0.2095 & 0.417385 \tabularnewline
9 & -0.055937 & -0.4297 & 0.665496 \tabularnewline
10 & 0.031563 & 0.2424 & 0.40464 \tabularnewline
11 & 0.043174 & 0.3316 & 0.370674 \tabularnewline
12 & 0.163106 & 1.2528 & 0.107603 \tabularnewline
13 & -0.054152 & -0.416 & 0.660522 \tabularnewline
14 & -0.197332 & -1.5157 & 0.932537 \tabularnewline
15 & 0.060678 & 0.4661 & 0.321438 \tabularnewline
16 & -0.14311 & -1.0992 & 0.861937 \tabularnewline
17 & -0.127359 & -0.9783 & 0.83403 \tabularnewline
18 & -0.000445 & -0.0034 & 0.501359 \tabularnewline
19 & 0.071265 & 0.5474 & 0.293087 \tabularnewline
20 & -0.104736 & -0.8045 & 0.787828 \tabularnewline
21 & -0.054178 & -0.4162 & 0.660595 \tabularnewline
22 & 0.038595 & 0.2965 & 0.383961 \tabularnewline
23 & 0.083569 & 0.6419 & 0.261709 \tabularnewline
24 & -0.064337 & -0.4942 & 0.688495 \tabularnewline
25 & -0.078528 & -0.6032 & 0.725651 \tabularnewline
26 & 0.134744 & 1.035 & 0.152449 \tabularnewline
27 & -0.031872 & -0.2448 & 0.596273 \tabularnewline
28 & -0.073418 & -0.5639 & 0.712532 \tabularnewline
29 & -0.009616 & -0.0739 & 0.529314 \tabularnewline
30 & -0.110903 & -0.8519 & 0.801133 \tabularnewline
31 & -0.103208 & -0.7928 & 0.784452 \tabularnewline
32 & -0.139762 & -1.0735 & 0.856298 \tabularnewline
33 & 0.008088 & 0.0621 & 0.475336 \tabularnewline
34 & -0.112188 & -0.8617 & 0.803837 \tabularnewline
35 & 0.150879 & 1.1589 & 0.125579 \tabularnewline
36 & -0.051416 & -0.3949 & 0.652842 \tabularnewline
37 & -0.055806 & -0.4287 & 0.665131 \tabularnewline
38 & 0.002782 & 0.0214 & 0.491511 \tabularnewline
39 & -0.008962 & -0.0688 & 0.527324 \tabularnewline
40 & 0.021039 & 0.1616 & 0.436087 \tabularnewline
41 & -0.029074 & -0.2233 & 0.587972 \tabularnewline
42 & -0.09001 & -0.6914 & 0.75398 \tabularnewline
43 & 0.024127 & 0.1853 & 0.426806 \tabularnewline
44 & 0.11841 & 0.9095 & 0.183387 \tabularnewline
45 & 0.003197 & 0.0246 & 0.490246 \tabularnewline
46 & -0.019108 & -0.1468 & 0.558092 \tabularnewline
47 & 0.066332 & 0.5095 & 0.30615 \tabularnewline
\hline
\end{tabular}
%Source: https://freestatistics.org/blog/index.php?pk=2808&T=2

[TABLE]
[ROW][C]Partial Autocorrelation Function[/C][/ROW]
[ROW][C]Time lag k[/C][C]PACF(k)[/C][C]T-STAT[/C][C]P-value[/C][/ROW]
[ROW][C]0[/C][C]0.023577[/C][C]0.1811[/C][C]0.428456[/C][/ROW]
[ROW][C]1[/C][C]0.06449[/C][C]0.4954[/C][C]0.311094[/C][/ROW]
[ROW][C]2[/C][C]-0.273643[/C][C]-2.1019[/C][C]0.980079[/C][/ROW]
[ROW][C]3[/C][C]0.081676[/C][C]0.6274[/C][C]0.266419[/C][/ROW]
[ROW][C]4[/C][C]0.022635[/C][C]0.1739[/C][C]0.431285[/C][/ROW]
[ROW][C]5[/C][C]0.010808[/C][C]0.083[/C][C]0.46706[/C][/ROW]
[ROW][C]6[/C][C]-0.174494[/C][C]-1.3403[/C][C]0.907359[/C][/ROW]
[ROW][C]7[/C][C]-0.053569[/C][C]-0.4115[/C][C]0.658892[/C][/ROW]
[ROW][C]8[/C][C]0.027276[/C][C]0.2095[/C][C]0.417385[/C][/ROW]
[ROW][C]9[/C][C]-0.055937[/C][C]-0.4297[/C][C]0.665496[/C][/ROW]
[ROW][C]10[/C][C]0.031563[/C][C]0.2424[/C][C]0.40464[/C][/ROW]
[ROW][C]11[/C][C]0.043174[/C][C]0.3316[/C][C]0.370674[/C][/ROW]
[ROW][C]12[/C][C]0.163106[/C][C]1.2528[/C][C]0.107603[/C][/ROW]
[ROW][C]13[/C][C]-0.054152[/C][C]-0.416[/C][C]0.660522[/C][/ROW]
[ROW][C]14[/C][C]-0.197332[/C][C]-1.5157[/C][C]0.932537[/C][/ROW]
[ROW][C]15[/C][C]0.060678[/C][C]0.4661[/C][C]0.321438[/C][/ROW]
[ROW][C]16[/C][C]-0.14311[/C][C]-1.0992[/C][C]0.861937[/C][/ROW]
[ROW][C]17[/C][C]-0.127359[/C][C]-0.9783[/C][C]0.83403[/C][/ROW]
[ROW][C]18[/C][C]-0.000445[/C][C]-0.0034[/C][C]0.501359[/C][/ROW]
[ROW][C]19[/C][C]0.071265[/C][C]0.5474[/C][C]0.293087[/C][/ROW]
[ROW][C]20[/C][C]-0.104736[/C][C]-0.8045[/C][C]0.787828[/C][/ROW]
[ROW][C]21[/C][C]-0.054178[/C][C]-0.4162[/C][C]0.660595[/C][/ROW]
[ROW][C]22[/C][C]0.038595[/C][C]0.2965[/C][C]0.383961[/C][/ROW]
[ROW][C]23[/C][C]0.083569[/C][C]0.6419[/C][C]0.261709[/C][/ROW]
[ROW][C]24[/C][C]-0.064337[/C][C]-0.4942[/C][C]0.688495[/C][/ROW]
[ROW][C]25[/C][C]-0.078528[/C][C]-0.6032[/C][C]0.725651[/C][/ROW]
[ROW][C]26[/C][C]0.134744[/C][C]1.035[/C][C]0.152449[/C][/ROW]
[ROW][C]27[/C][C]-0.031872[/C][C]-0.2448[/C][C]0.596273[/C][/ROW]
[ROW][C]28[/C][C]-0.073418[/C][C]-0.5639[/C][C]0.712532[/C][/ROW]
[ROW][C]29[/C][C]-0.009616[/C][C]-0.0739[/C][C]0.529314[/C][/ROW]
[ROW][C]30[/C][C]-0.110903[/C][C]-0.8519[/C][C]0.801133[/C][/ROW]
[ROW][C]31[/C][C]-0.103208[/C][C]-0.7928[/C][C]0.784452[/C][/ROW]
[ROW][C]32[/C][C]-0.139762[/C][C]-1.0735[/C][C]0.856298[/C][/ROW]
[ROW][C]33[/C][C]0.008088[/C][C]0.0621[/C][C]0.475336[/C][/ROW]
[ROW][C]34[/C][C]-0.112188[/C][C]-0.8617[/C][C]0.803837[/C][/ROW]
[ROW][C]35[/C][C]0.150879[/C][C]1.1589[/C][C]0.125579[/C][/ROW]
[ROW][C]36[/C][C]-0.051416[/C][C]-0.3949[/C][C]0.652842[/C][/ROW]
[ROW][C]37[/C][C]-0.055806[/C][C]-0.4287[/C][C]0.665131[/C][/ROW]
[ROW][C]38[/C][C]0.002782[/C][C]0.0214[/C][C]0.491511[/C][/ROW]
[ROW][C]39[/C][C]-0.008962[/C][C]-0.0688[/C][C]0.527324[/C][/ROW]
[ROW][C]40[/C][C]0.021039[/C][C]0.1616[/C][C]0.436087[/C][/ROW]
[ROW][C]41[/C][C]-0.029074[/C][C]-0.2233[/C][C]0.587972[/C][/ROW]
[ROW][C]42[/C][C]-0.09001[/C][C]-0.6914[/C][C]0.75398[/C][/ROW]
[ROW][C]43[/C][C]0.024127[/C][C]0.1853[/C][C]0.426806[/C][/ROW]
[ROW][C]44[/C][C]0.11841[/C][C]0.9095[/C][C]0.183387[/C][/ROW]
[ROW][C]45[/C][C]0.003197[/C][C]0.0246[/C][C]0.490246[/C][/ROW]
[ROW][C]46[/C][C]-0.019108[/C][C]-0.1468[/C][C]0.558092[/C][/ROW]
[ROW][C]47[/C][C]0.066332[/C][C]0.5095[/C][C]0.30615[/C][/ROW]
[/TABLE]
Source: https://freestatistics.org/blog/index.php?pk=2808&T=2

Globally Unique Identifier (entire table): ba.freestatistics.org/blog/index.php?pk=2808&T=2

As an alternative you can also use a QR Code:  

The GUIDs for individual cells are displayed in the table below:

Partial Autocorrelation Function
Time lag kPACF(k)T-STATP-value
00.0235770.18110.428456
10.064490.49540.311094
2-0.273643-2.10190.980079
30.0816760.62740.266419
40.0226350.17390.431285
50.0108080.0830.46706
6-0.174494-1.34030.907359
7-0.053569-0.41150.658892
80.0272760.20950.417385
9-0.055937-0.42970.665496
100.0315630.24240.40464
110.0431740.33160.370674
120.1631061.25280.107603
13-0.054152-0.4160.660522
14-0.197332-1.51570.932537
150.0606780.46610.321438
16-0.14311-1.09920.861937
17-0.127359-0.97830.83403
18-0.000445-0.00340.501359
190.0712650.54740.293087
20-0.104736-0.80450.787828
21-0.054178-0.41620.660595
220.0385950.29650.383961
230.0835690.64190.261709
24-0.064337-0.49420.688495
25-0.078528-0.60320.725651
260.1347441.0350.152449
27-0.031872-0.24480.596273
28-0.073418-0.56390.712532
29-0.009616-0.07390.529314
30-0.110903-0.85190.801133
31-0.103208-0.79280.784452
32-0.139762-1.07350.856298
330.0080880.06210.475336
34-0.112188-0.86170.803837
350.1508791.15890.125579
36-0.051416-0.39490.652842
37-0.055806-0.42870.665131
380.0027820.02140.491511
39-0.008962-0.06880.527324
400.0210390.16160.436087
41-0.029074-0.22330.587972
42-0.09001-0.69140.75398
430.0241270.18530.426806
440.118410.90950.183387
450.0031970.02460.490246
46-0.019108-0.14680.558092
470.0663320.50950.30615


Parameters (Session):
par1 = 48 ; par2 = 1 ; par3 = 1 ; par4 = 0 ; par5 = 12 ;
Parameters (R input):
par1 = 48 ; par2 = 1 ; par3 = 1 ; par4 = 0 ; par5 = 12 ;
R code (references can be found in the software module):
if (par1 == 'Default') {
par1 = 10*log10(length(x))
} else {
par1 <- as.numeric(par1)
}
par2 <- as.numeric(par2)
par3 <- as.numeric(par3)
par4 <- as.numeric(par4)
par5 <- as.numeric(par5)
if (par2 == 0) {
x <- log(x)
} else {
x <- (x ^ par2 - 1) / par2
}
if (par3 > 0) x <- diff(x,lag=1,difference=par3)
if (par4 > 0) x <- diff(x,lag=par5,difference=par4)
bitmap(file='pic1.png')
racf <- acf(x,par1,main='Autocorrelation',xlab='lags',ylab='ACF')
dev.off()
bitmap(file='pic2.png')
rpacf <- pacf(x,par1,main='Partial Autocorrelation',xlab='lags',ylab='PACF')
dev.off()
(myacf <- c(racf$acf))
(mypacf <- c(rpacf$acf))
lengthx <- length(x)
sqrtn <- sqrt(lengthx)
load(file='createtable')
a<-table.start()
a<-table.row.start(a)
a<-table.element(a,'Autocorrelation Function',4,TRUE)
a<-table.row.end(a)
a<-table.row.start(a)
a<-table.element(a,'Time lag k',header=TRUE)
a<-table.element(a,hyperlink('basics.htm','ACF(k)','click here for more information about the Autocorrelation Function'),header=TRUE)
a<-table.element(a,'T-STAT',header=TRUE)
a<-table.element(a,'P-value',header=TRUE)
a<-table.row.end(a)
for (i in 1:par1) {
a<-table.row.start(a)
a<-table.element(a,i-1,header=TRUE)
a<-table.element(a,round(myacf[i],6))
mytstat <- myacf[i]*sqrtn
a<-table.element(a,round(mytstat,4))
a<-table.element(a,round(1-pt(mytstat,lengthx),6))
a<-table.row.end(a)
}
a<-table.end(a)
table.save(a,file='mytable.tab')
a<-table.start()
a<-table.row.start(a)
a<-table.element(a,'Partial Autocorrelation Function',4,TRUE)
a<-table.row.end(a)
a<-table.row.start(a)
a<-table.element(a,'Time lag k',header=TRUE)
a<-table.element(a,hyperlink('basics.htm','PACF(k)','click here for more information about the Partial Autocorrelation Function'),header=TRUE)
a<-table.element(a,'T-STAT',header=TRUE)
a<-table.element(a,'P-value',header=TRUE)
a<-table.row.end(a)
for (i in 1:par1) {
a<-table.row.start(a)
a<-table.element(a,i-1,header=TRUE)
a<-table.element(a,round(mypacf[i],6))
mytstat <- mypacf[i]*sqrtn
a<-table.element(a,round(mytstat,4))
a<-table.element(a,round(1-pt(mytstat,lengthx),6))
a<-table.row.end(a)
}
a<-table.end(a)
table.save(a,file='mytable1.tab')